Download to read offline
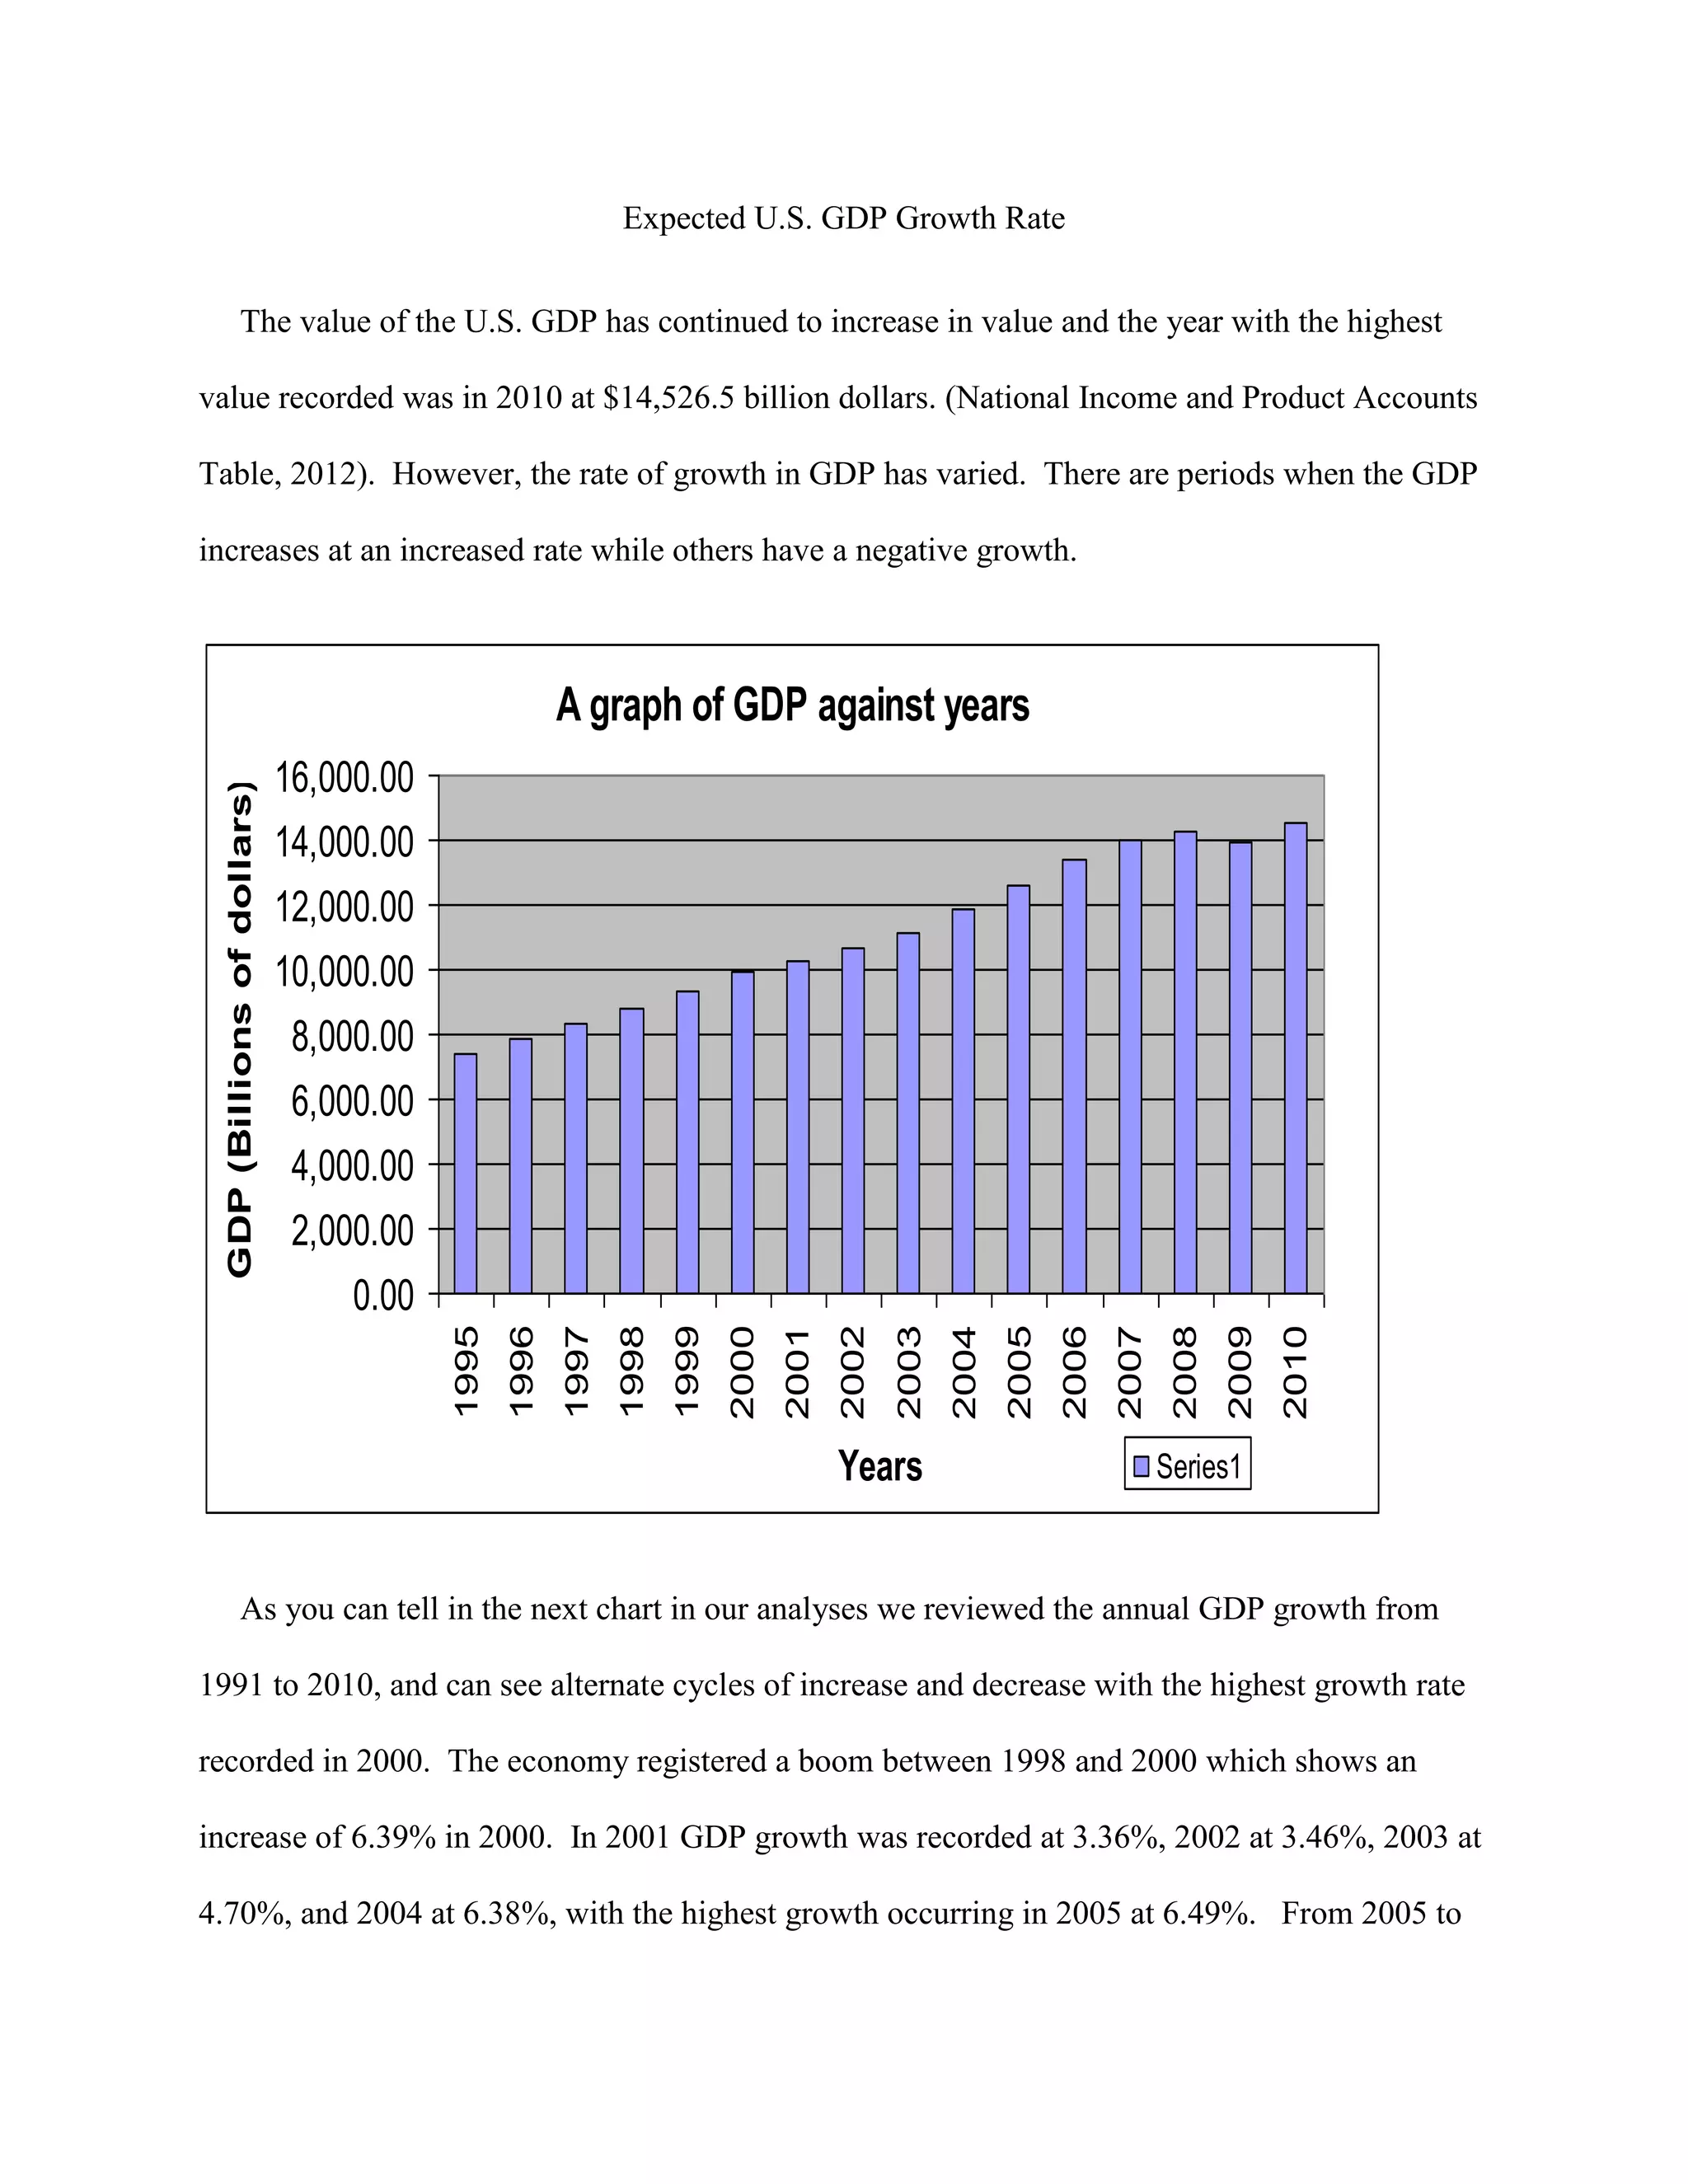
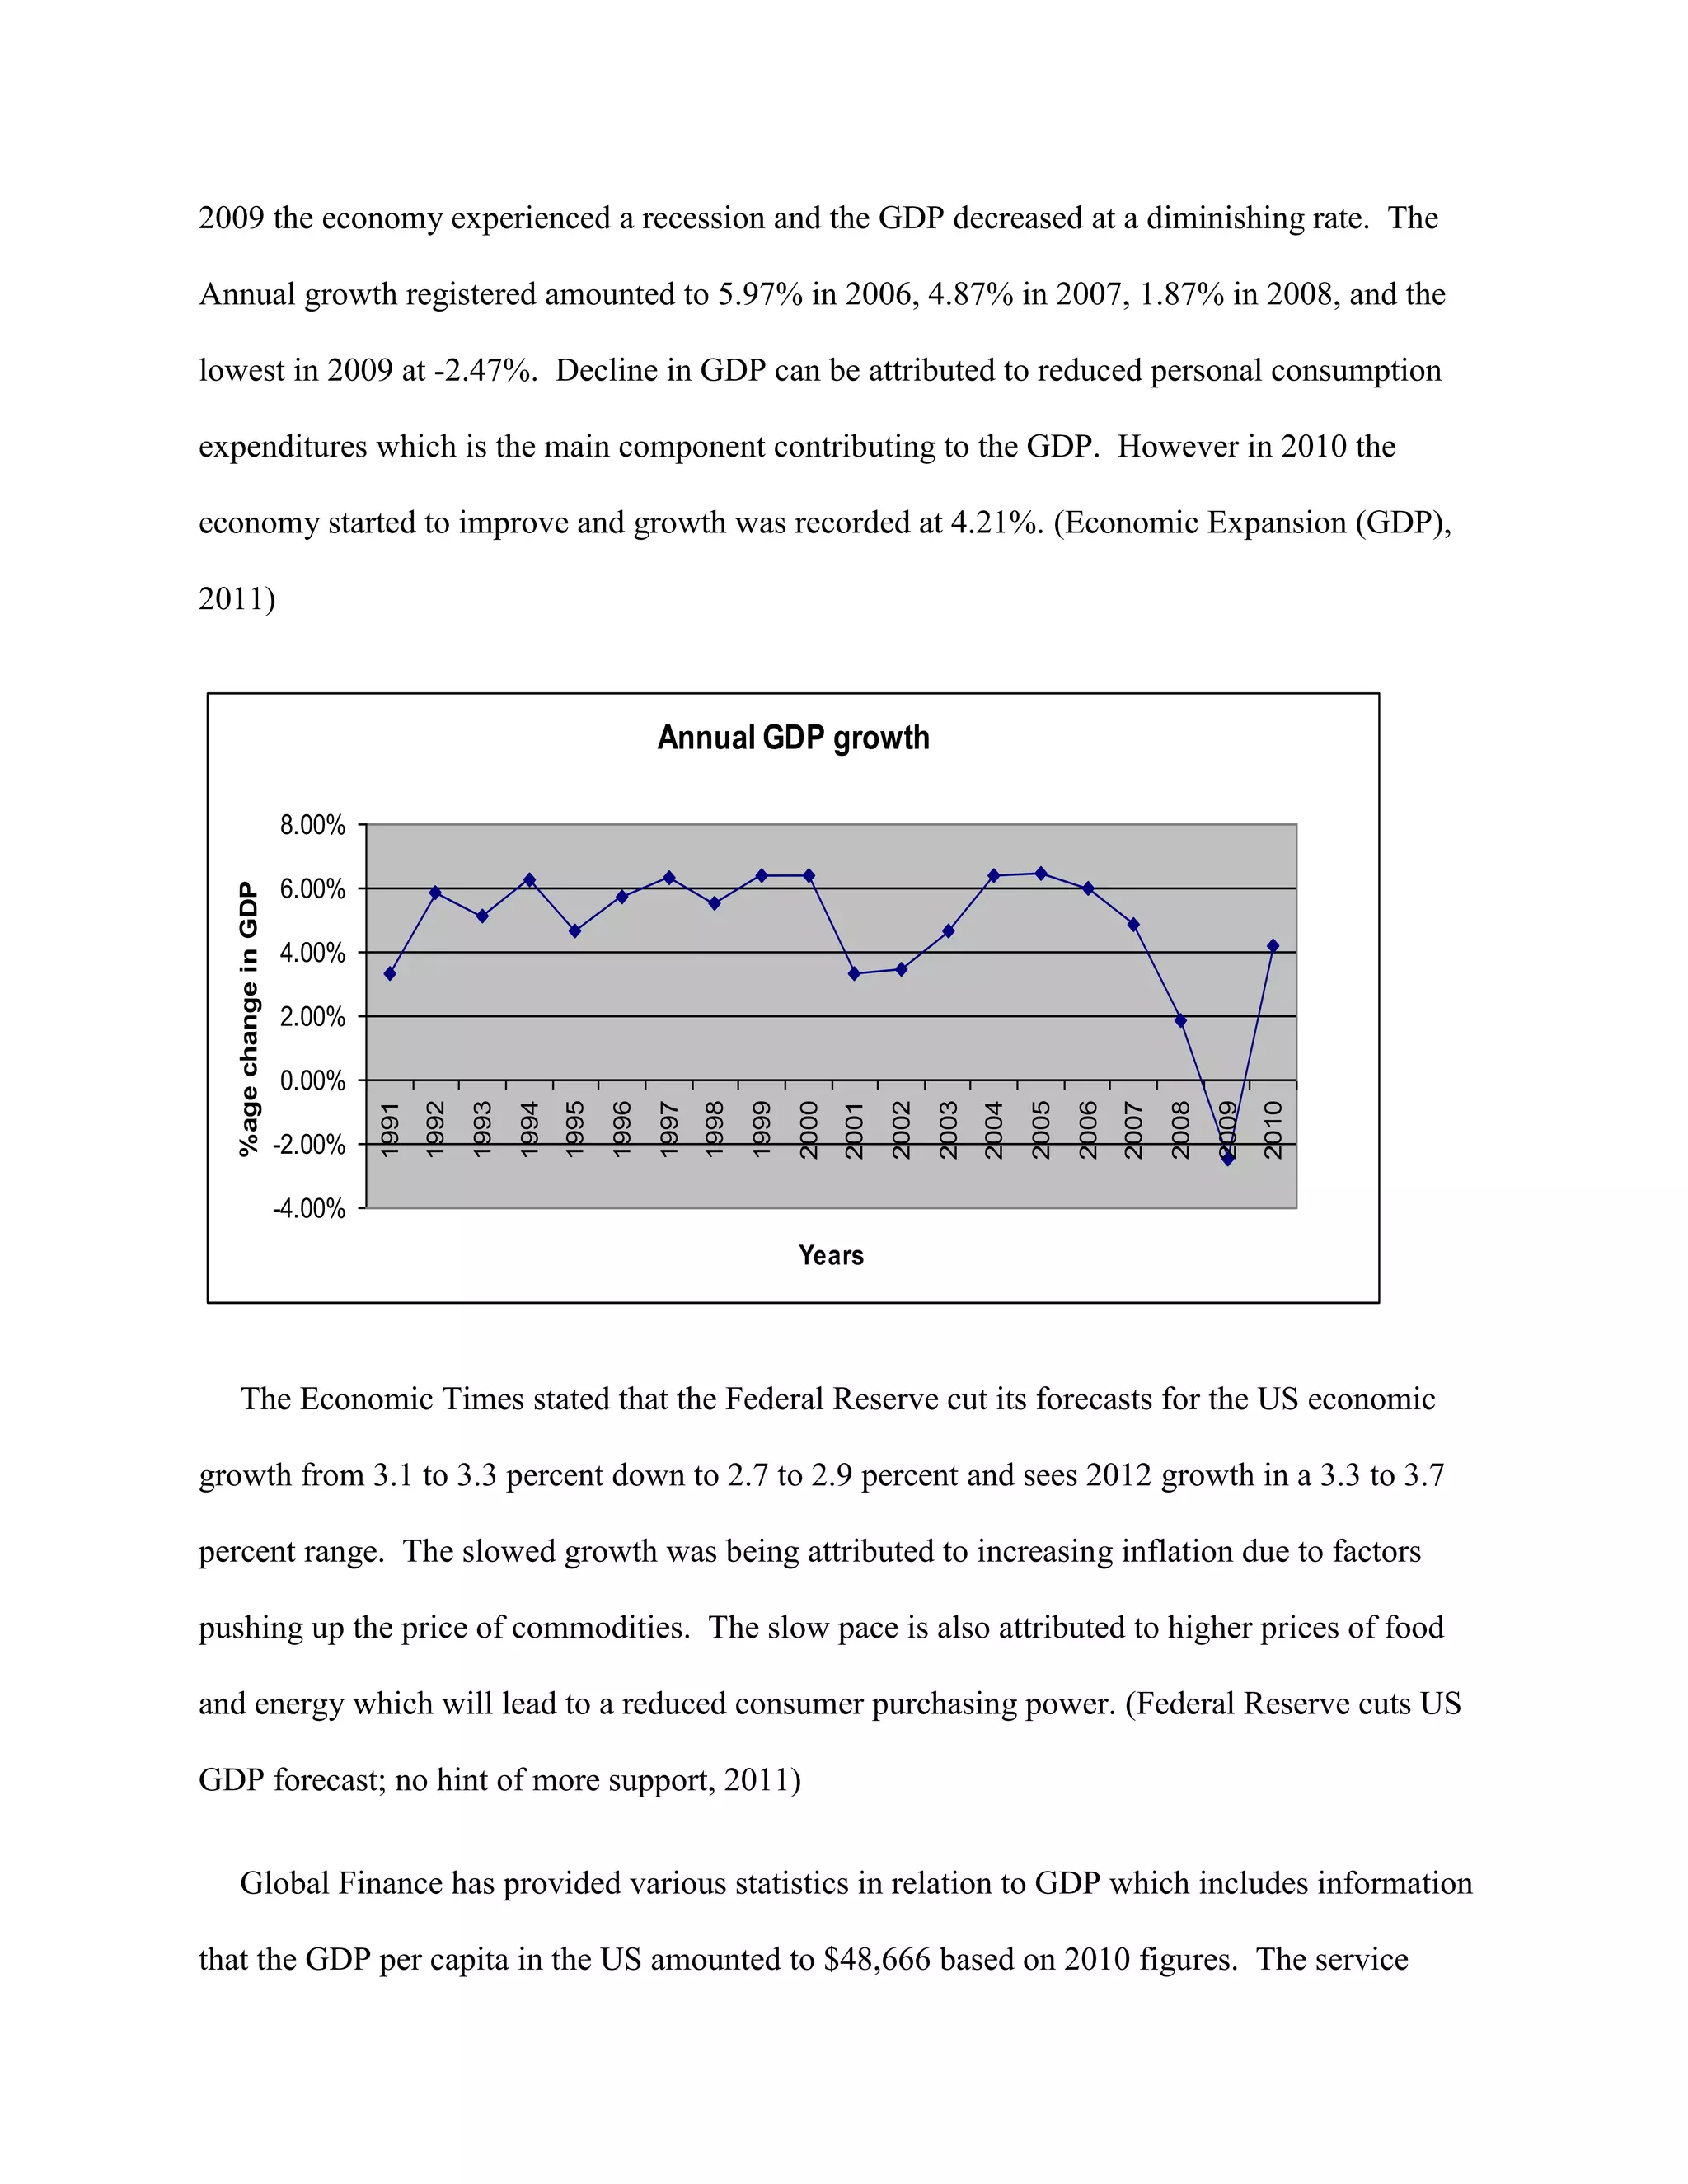
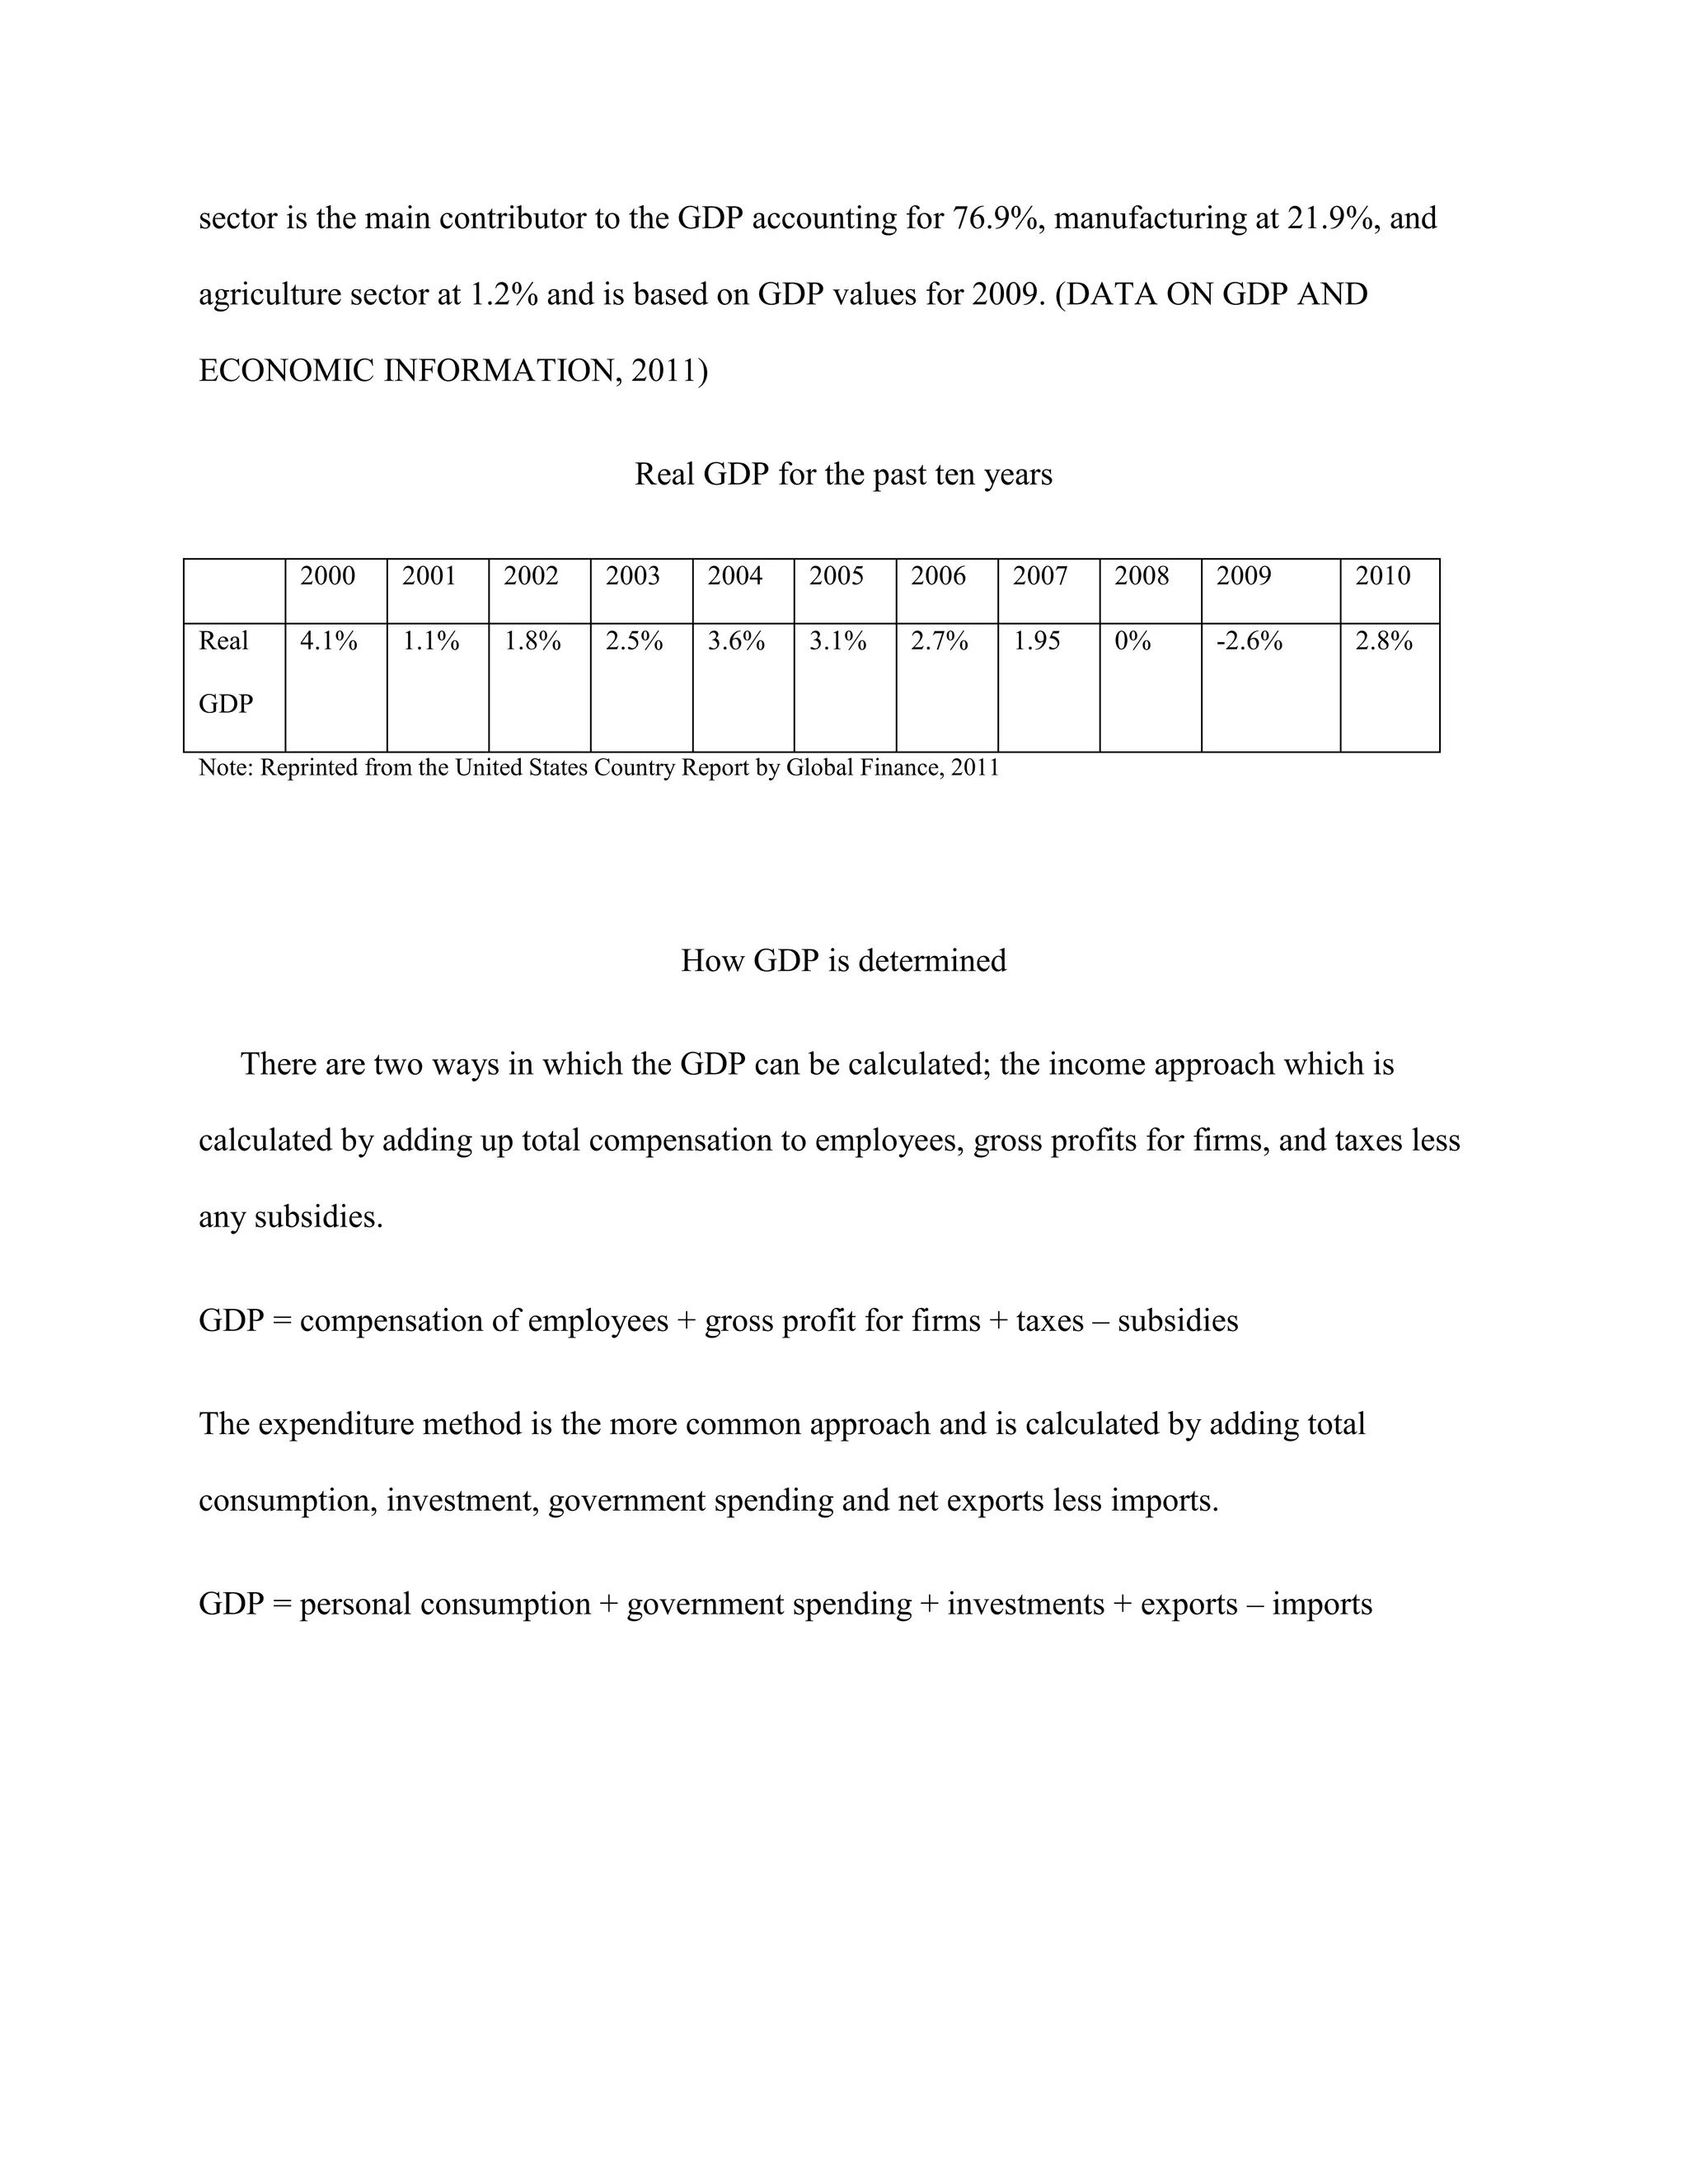

The document examines expected U.S. GDP growth rates based on past trends and forecasts. It analyzes annual GDP growth from 1991 to 2010, which varied from periods of increase to decrease, with the highest growth in 2000 at 6.39%. Forecasts expect 2012 growth in the 3.3-3.7% range. GDP is determined either through the income approach (compensation + profits + taxes - subsidies) or expenditure approach (consumption + government spending + investments + exports - imports). A positive GDP reflects economic growth while negative GDP indicates a recession.


