
Download to read offline

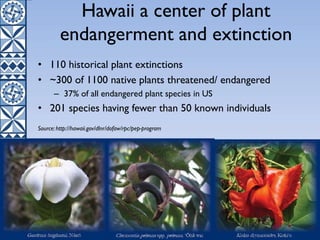
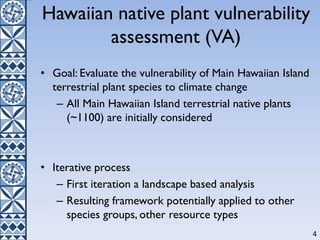
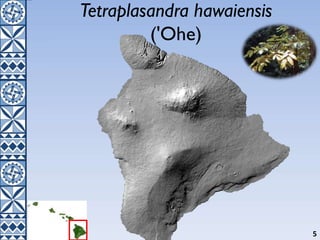
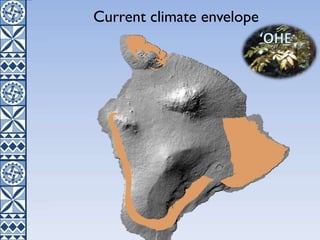
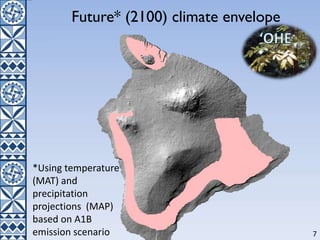
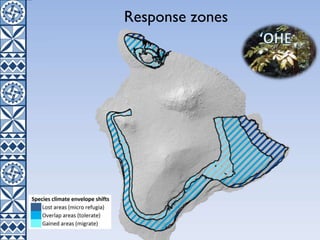
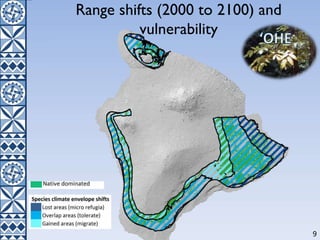
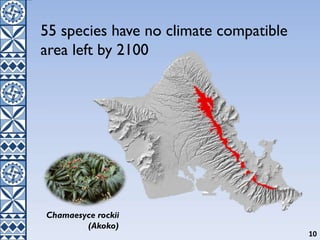
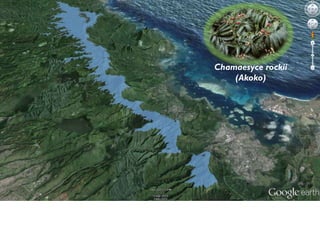
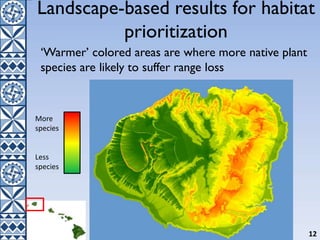
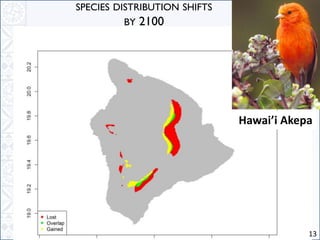
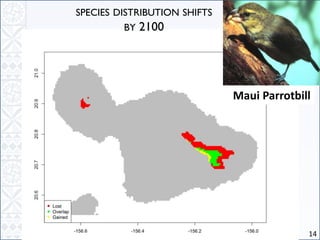
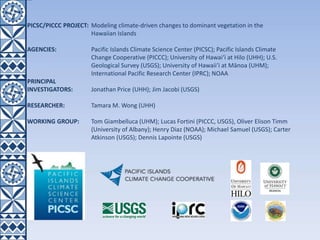
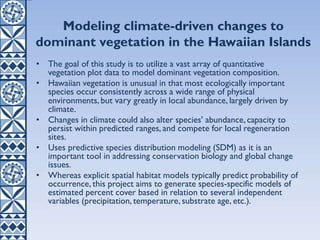
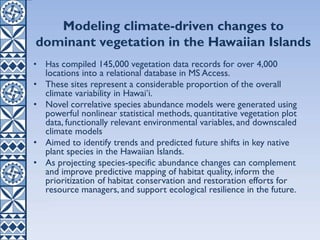
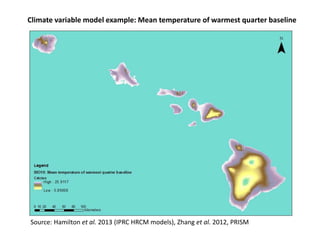
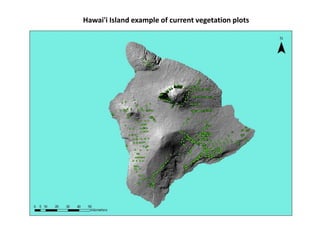
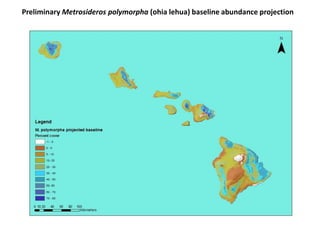

The document summarizes two projects related to conservation and climate change in Hawaii. The first project evaluates the vulnerability of all native Hawaiian plant species to climate change using landscape-based modeling of species' climate envelopes and projected habitat shifts. Some species are projected to lose all suitable climate space by 2100. The second project models changes in dominant vegetation composition across Hawaii driven by climate variables, using over 145,000 vegetation plot records. Preliminary results project shifts in abundance of key native species like Metrosideros polymorpha under climate change. Both projects aim to inform conservation planning and resource management in Hawaii.


![[DSC Europe 25] Bojan Djuricic - Predictive Design Process.pdf](https://cdn.slidesharecdn.com/ss_thumbnails/5awdrbedqdek3gqu2ezy-4-the-predictive-design-bojan-djuricic-260120105856-6c399e9b-thumbnail.jpg?width=640&height=640&fit=bounds)

![[DSC Europe 25] Andrzej Kowalczyk - AI - how to start small and grow in the f...](https://cdn.slidesharecdn.com/ss_thumbnails/oy1zmo94qv6vpcqjvno2-andrzej-kowalczyk-ai-how-to-start-small-and-grow-in-the-future-1-260119121559-cf093b23-thumbnail.jpg?width=640&height=640&fit=bounds)


