
Download to read offline
![Proportion of Population 65 years and over
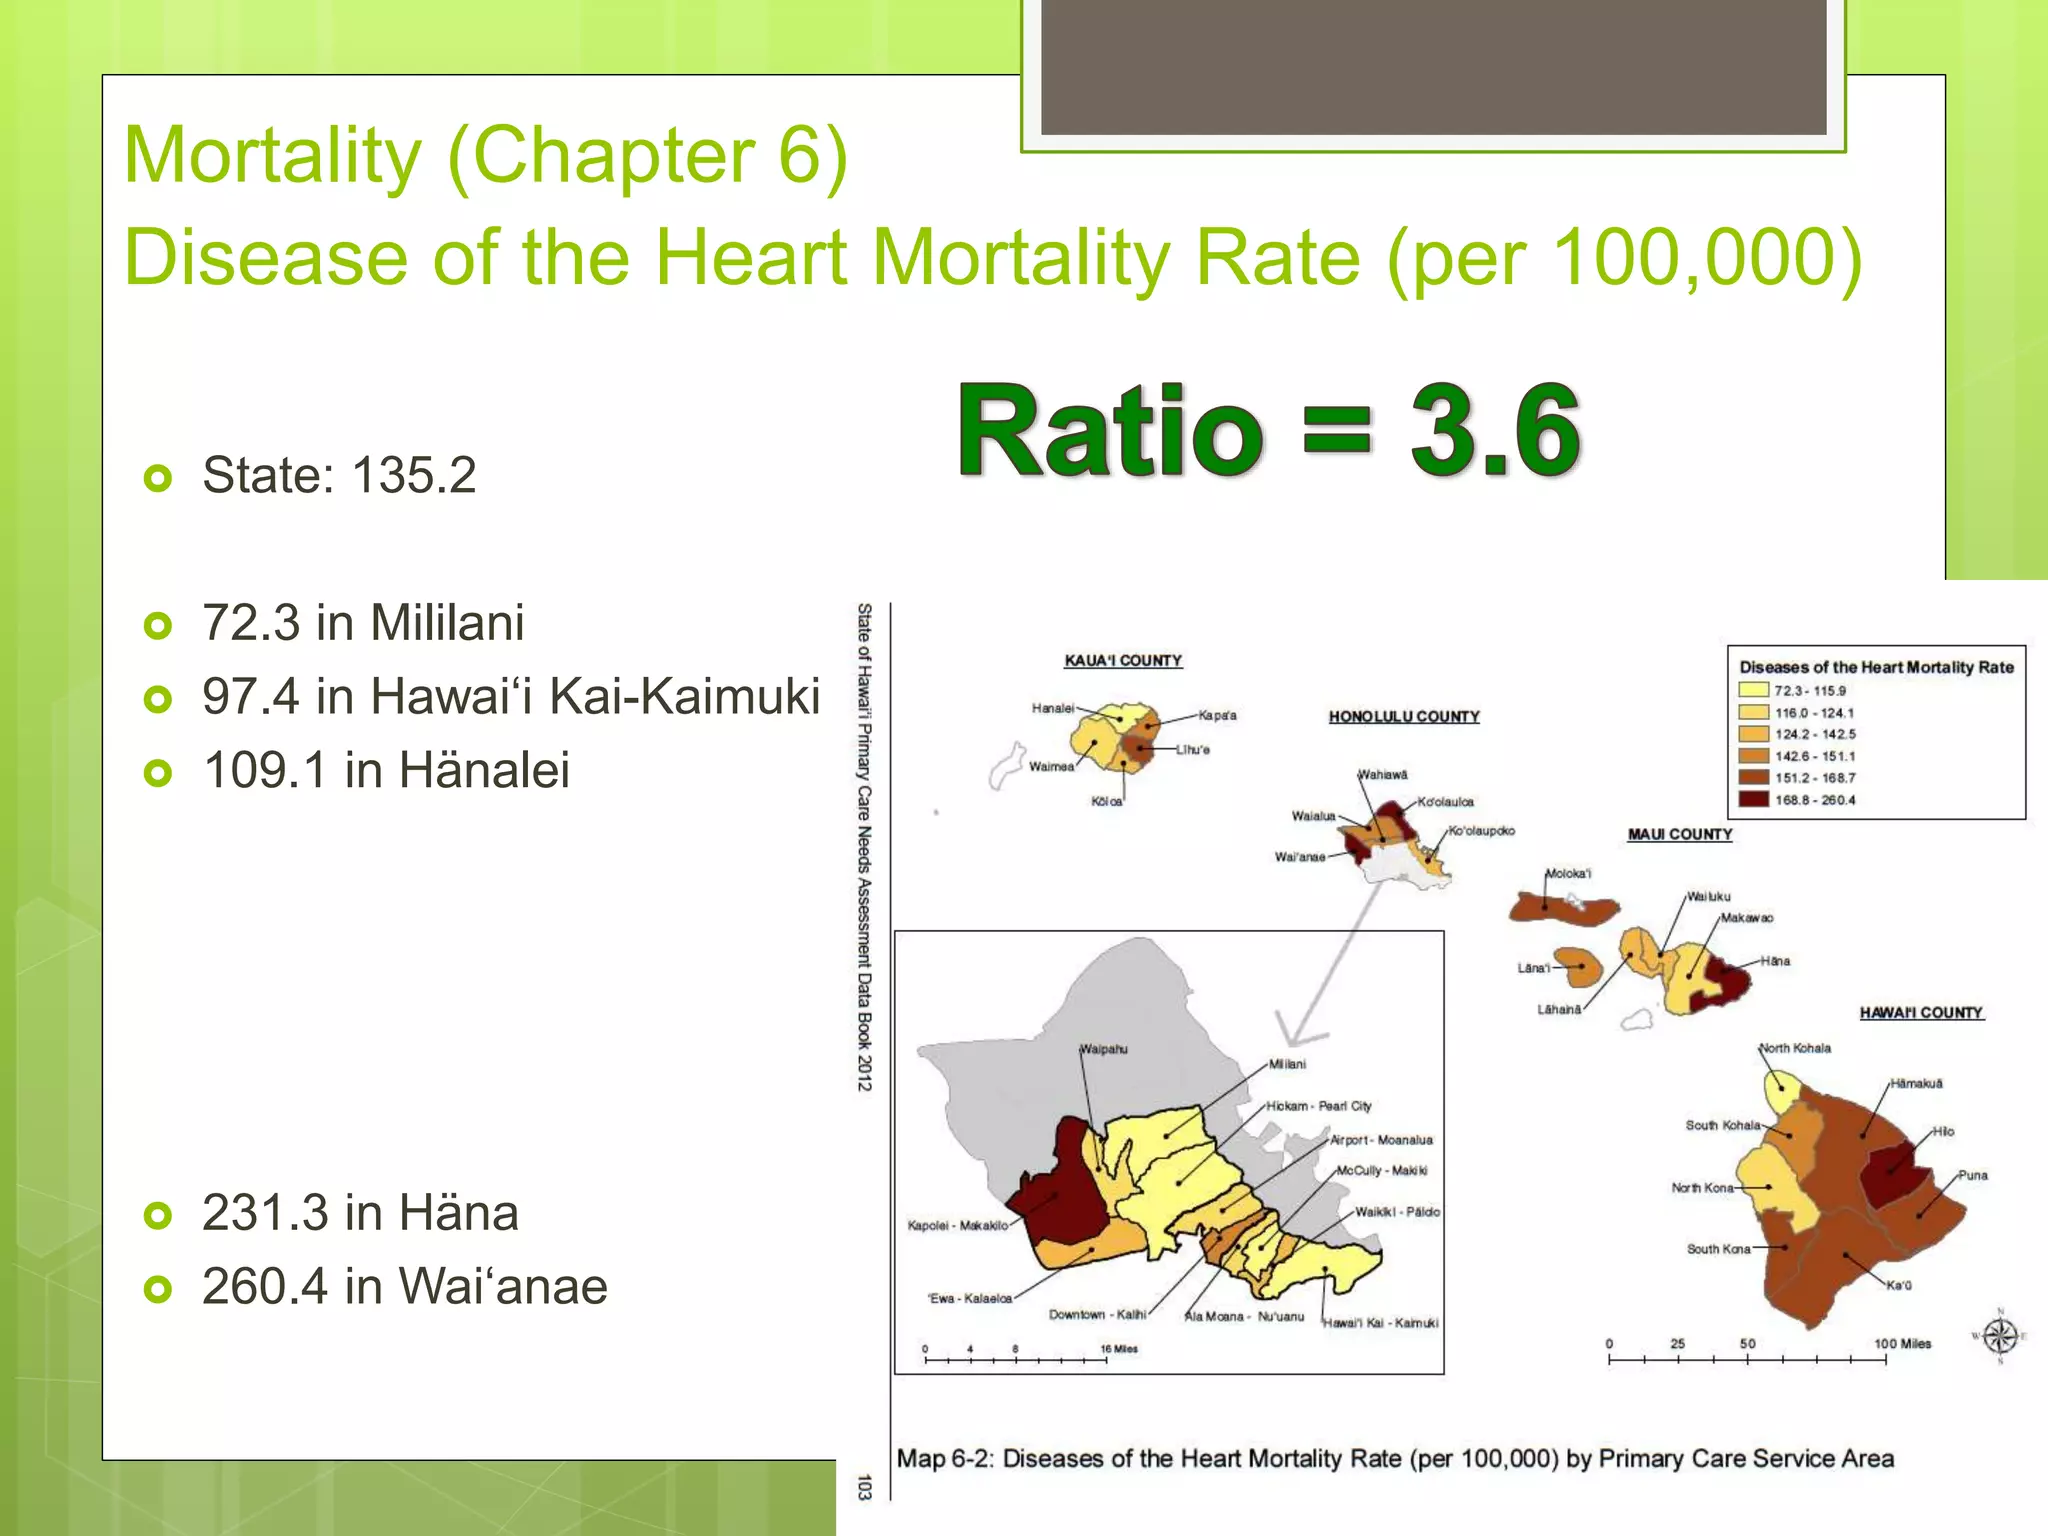
State: 14.0%
[13.3% in 2000]
7.7% in Mililani
8.1% in Kapolei-Makakilo
19.7% in Waikïkï-Pälolo
20.1% in Hawai‘i Kai-
Kaimuki
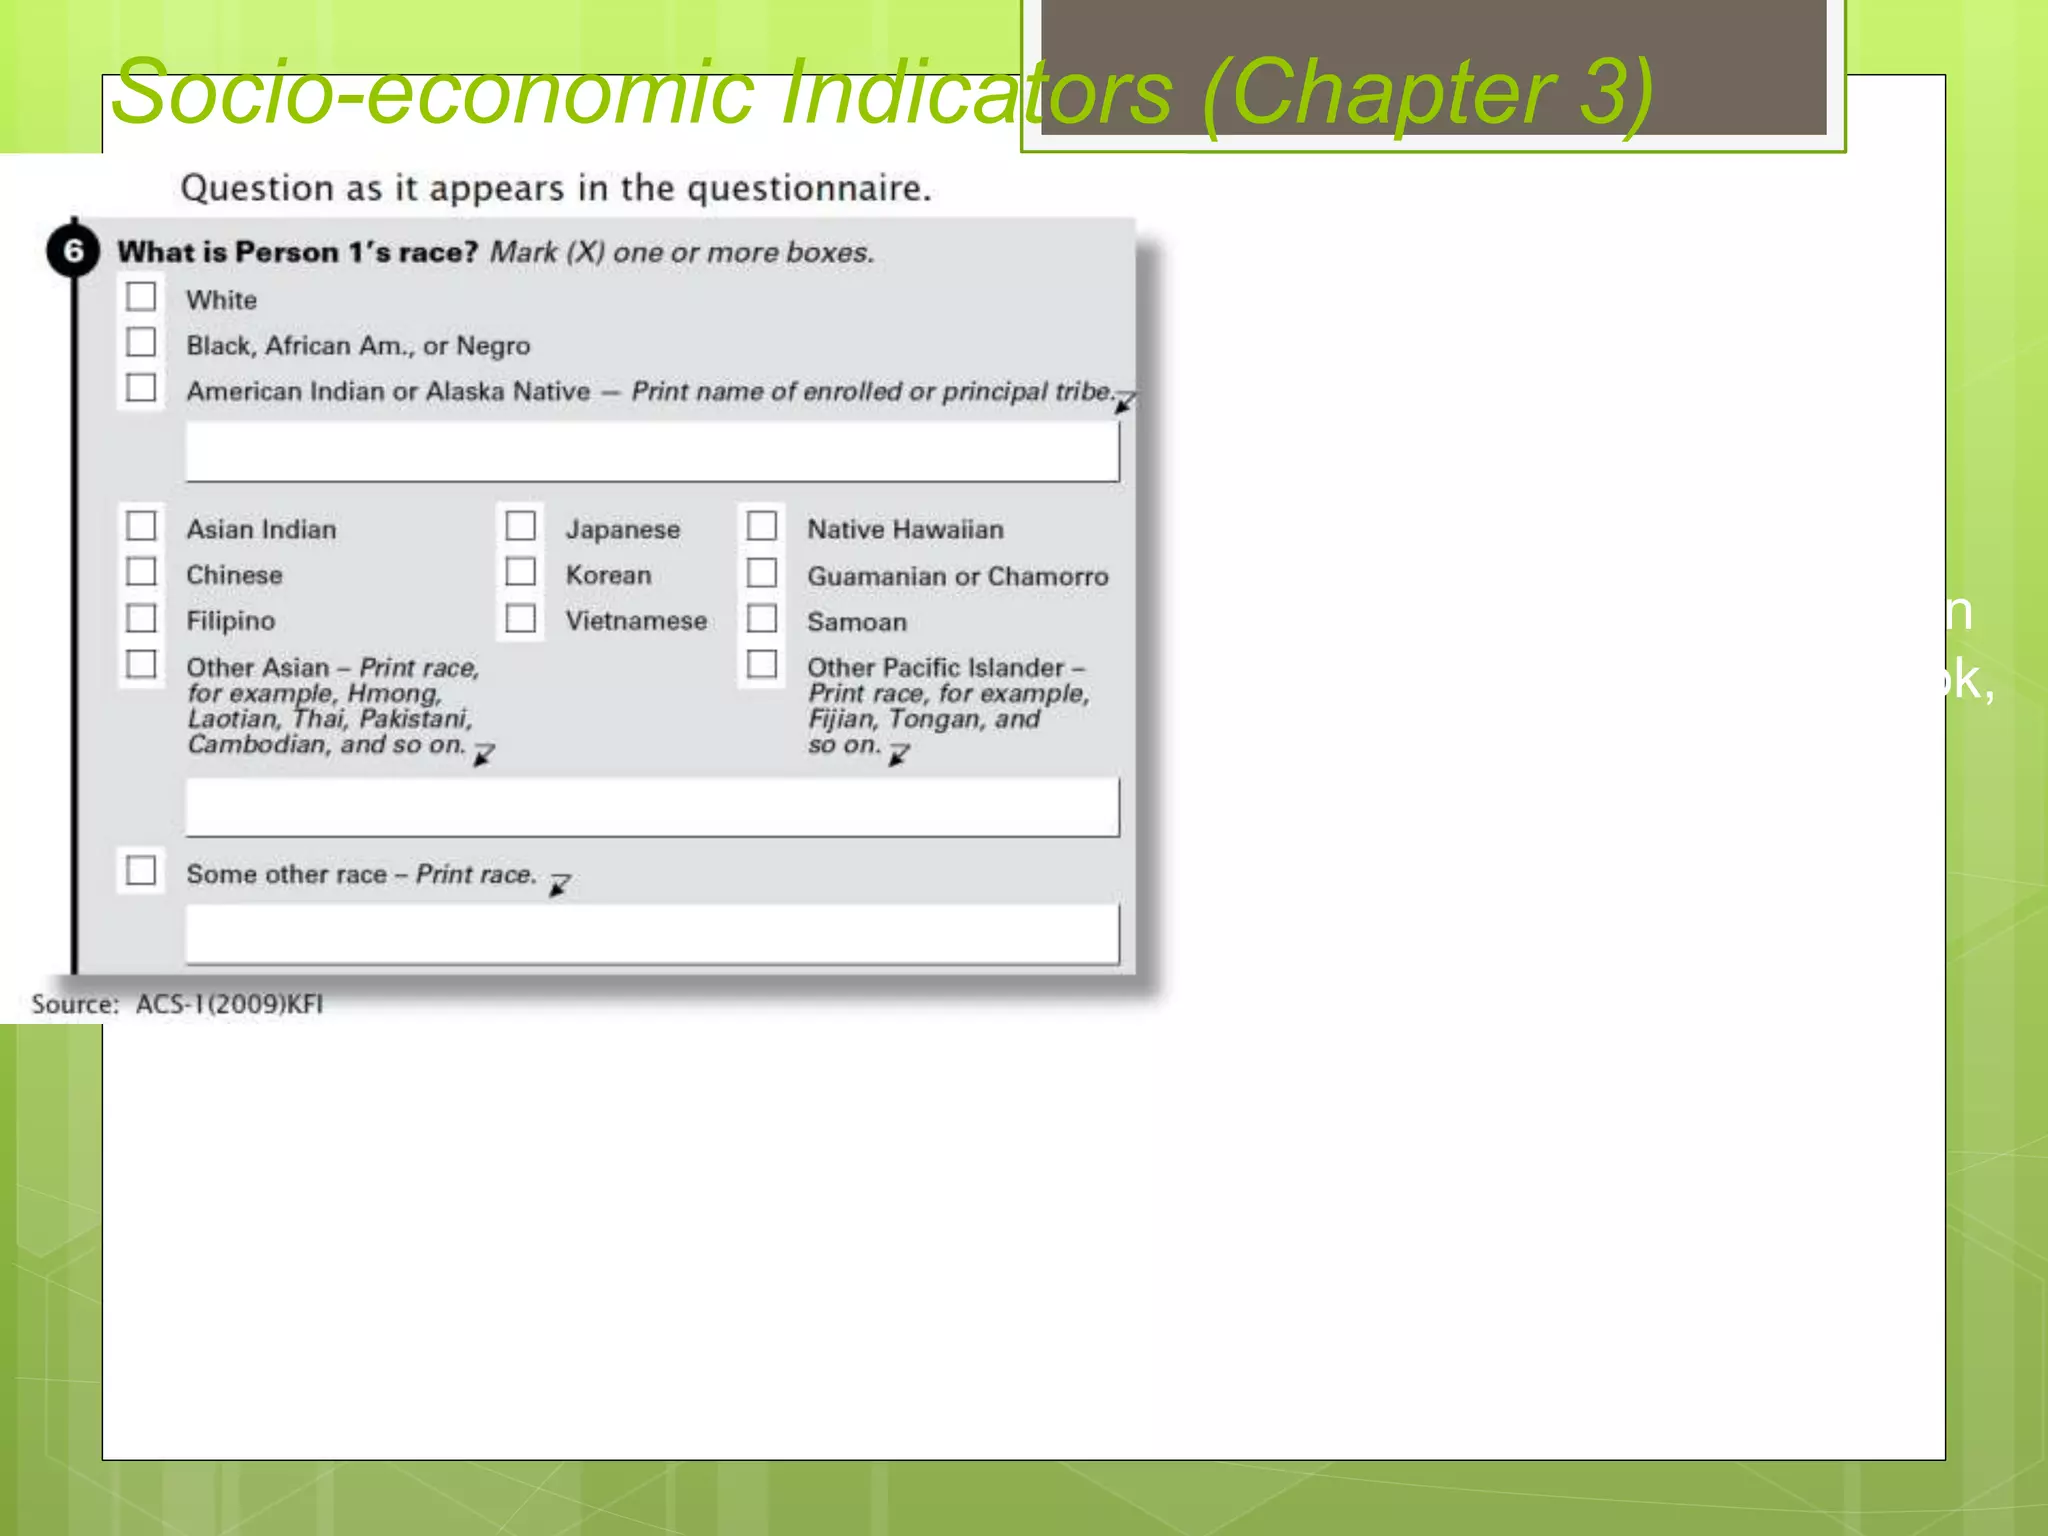
Socio-economic Indicators (Chapter 3)](https://image.slidesharecdn.com/f3qjysmqwgsxmlfabhec-signature-cbb7d3bd6ba43ef4d1b1b9642b3286ae3b75bfce39b7b2a77eac67f06786d1f0-poli-151030181619-lva1-app6892/75/Use-of-GIS-Technology-to-Inform-Planning-Efforts-Through-Visualization-of-Community-Level-Data-in-Hawaii-17-2048.jpg)
![Proportion of Population Native Hawaiian
State: 21.3%
[19.8% in 2000]
11.3% in Waikïkï-Pälolo
11.3% in Airport-Moanalua
57.4% Häna
58.5% in Wai‘anae
61.8% in Moloka‘i](https://image.slidesharecdn.com/f3qjysmqwgsxmlfabhec-signature-cbb7d3bd6ba43ef4d1b1b9642b3286ae3b75bfce39b7b2a77eac67f06786d1f0-poli-151030181619-lva1-app6892/75/Use-of-GIS-Technology-to-Inform-Planning-Efforts-Through-Visualization-of-Community-Level-Data-in-Hawaii-18-2048.jpg)
![Proportion of Population Filipino
State: 25.1%
[22.8% in 2000]
7.0% in Hawai‘i Kai-Kaimuki
45.6% Lïhu‘e
54.4% Waipahu
63.9% Läna‘i
Socio-economic Indicators (Chapter 3)](https://image.slidesharecdn.com/f3qjysmqwgsxmlfabhec-signature-cbb7d3bd6ba43ef4d1b1b9642b3286ae3b75bfce39b7b2a77eac67f06786d1f0-poli-151030181619-lva1-app6892/75/Use-of-GIS-Technology-to-Inform-Planning-Efforts-Through-Visualization-of-Community-Level-Data-in-Hawaii-40-2048.jpg)

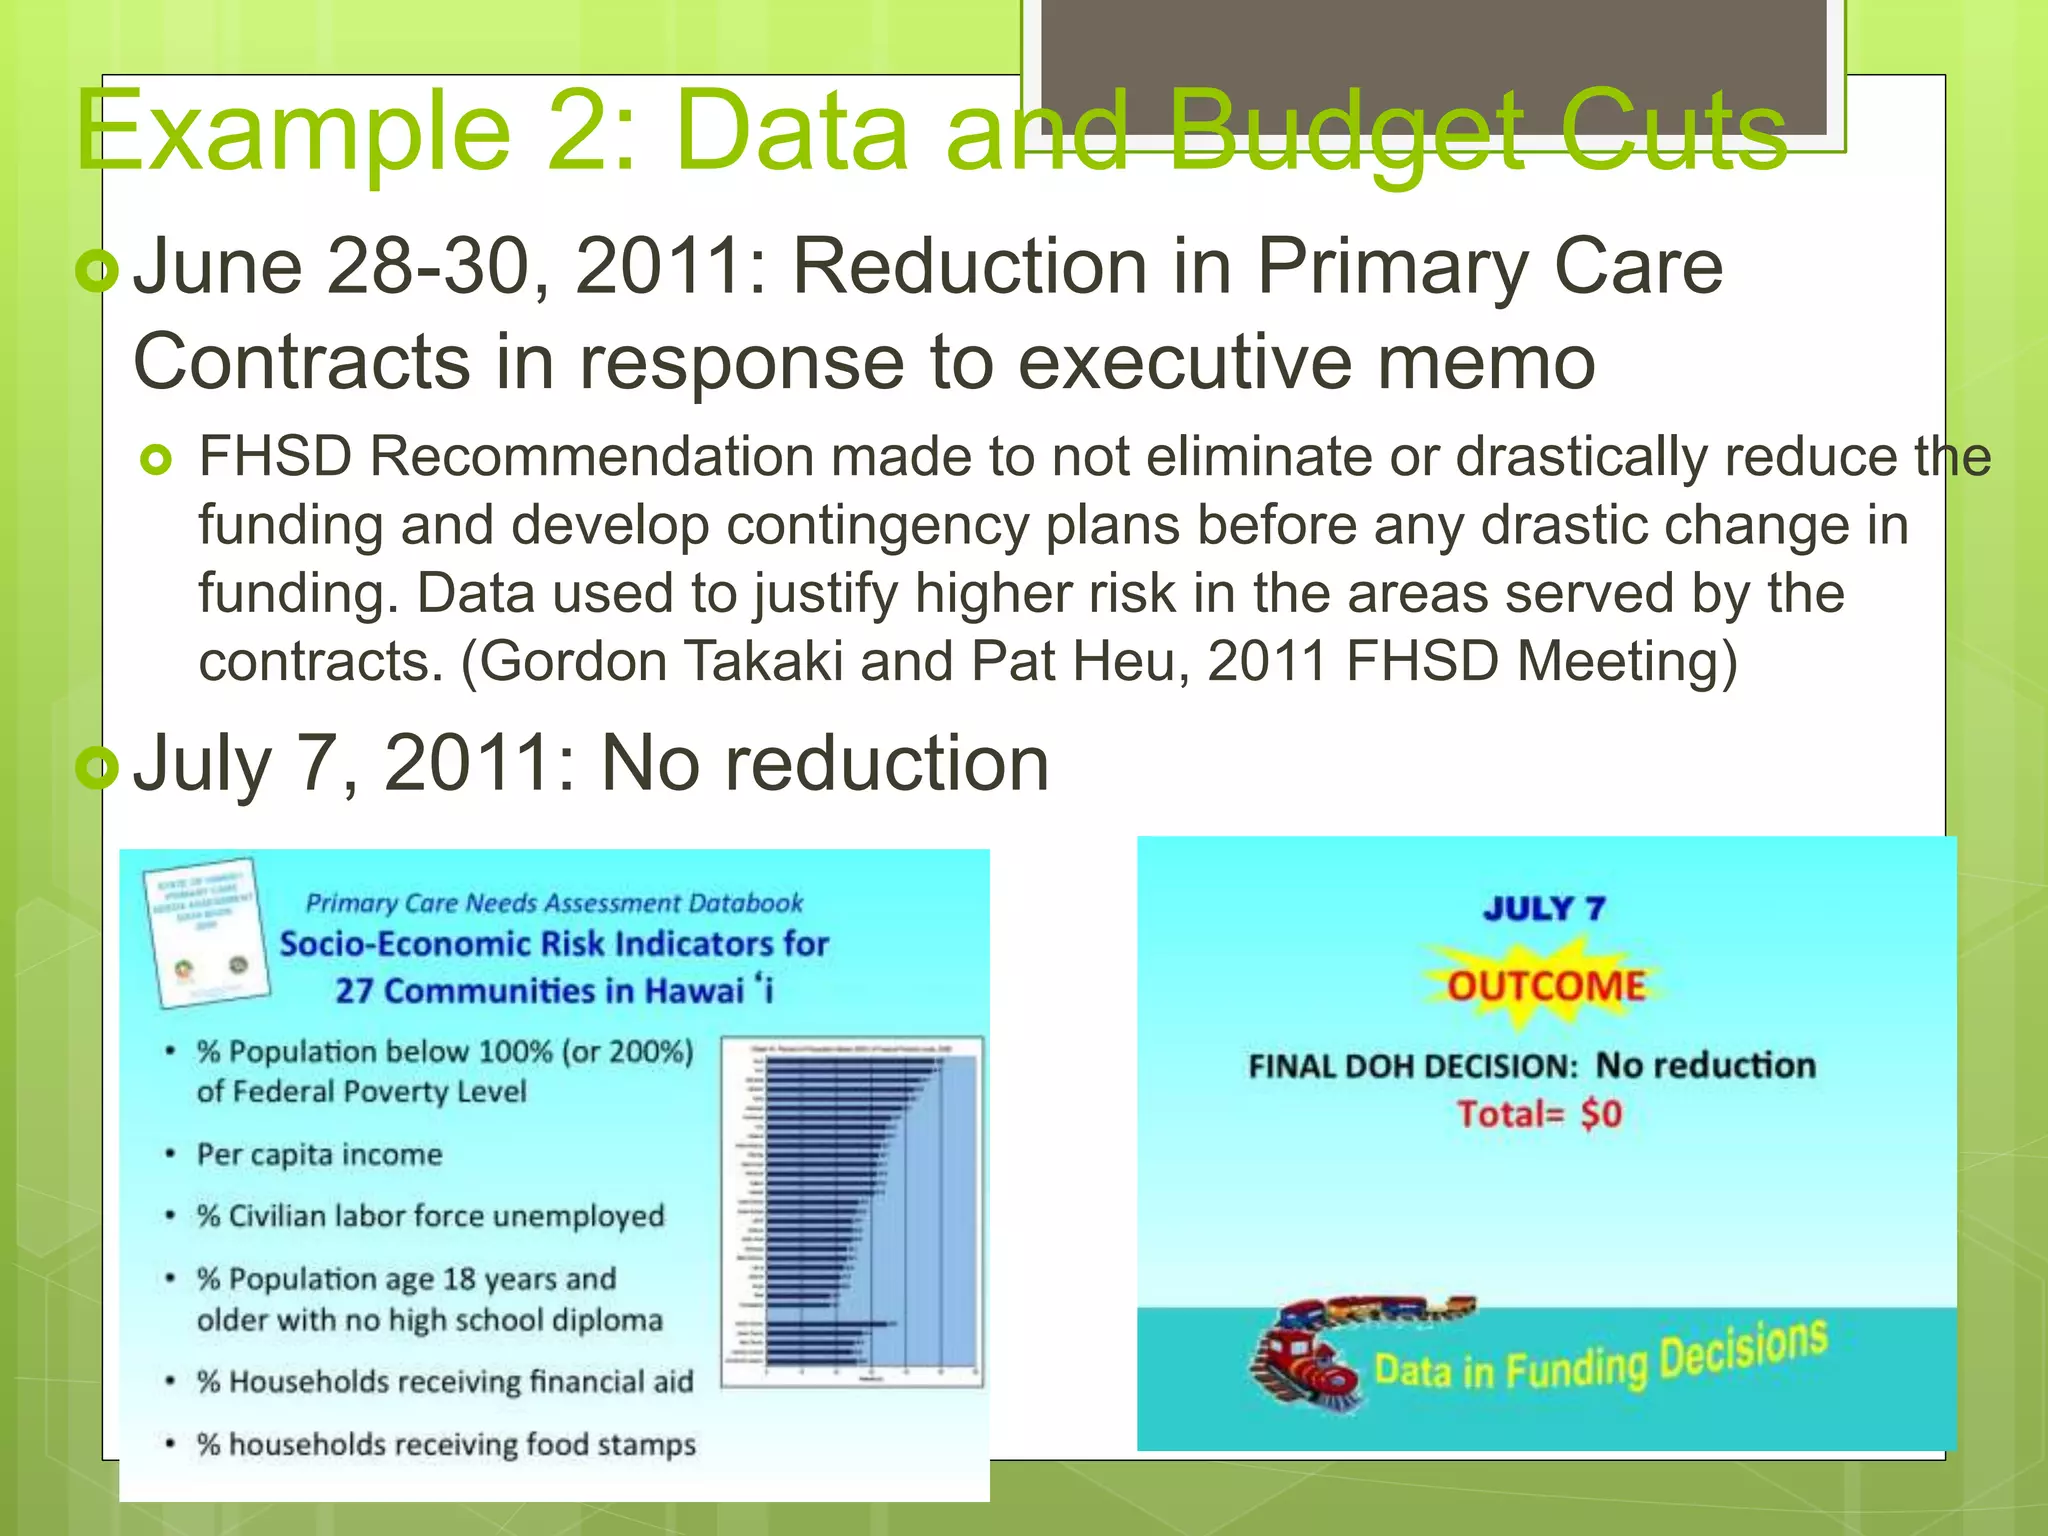
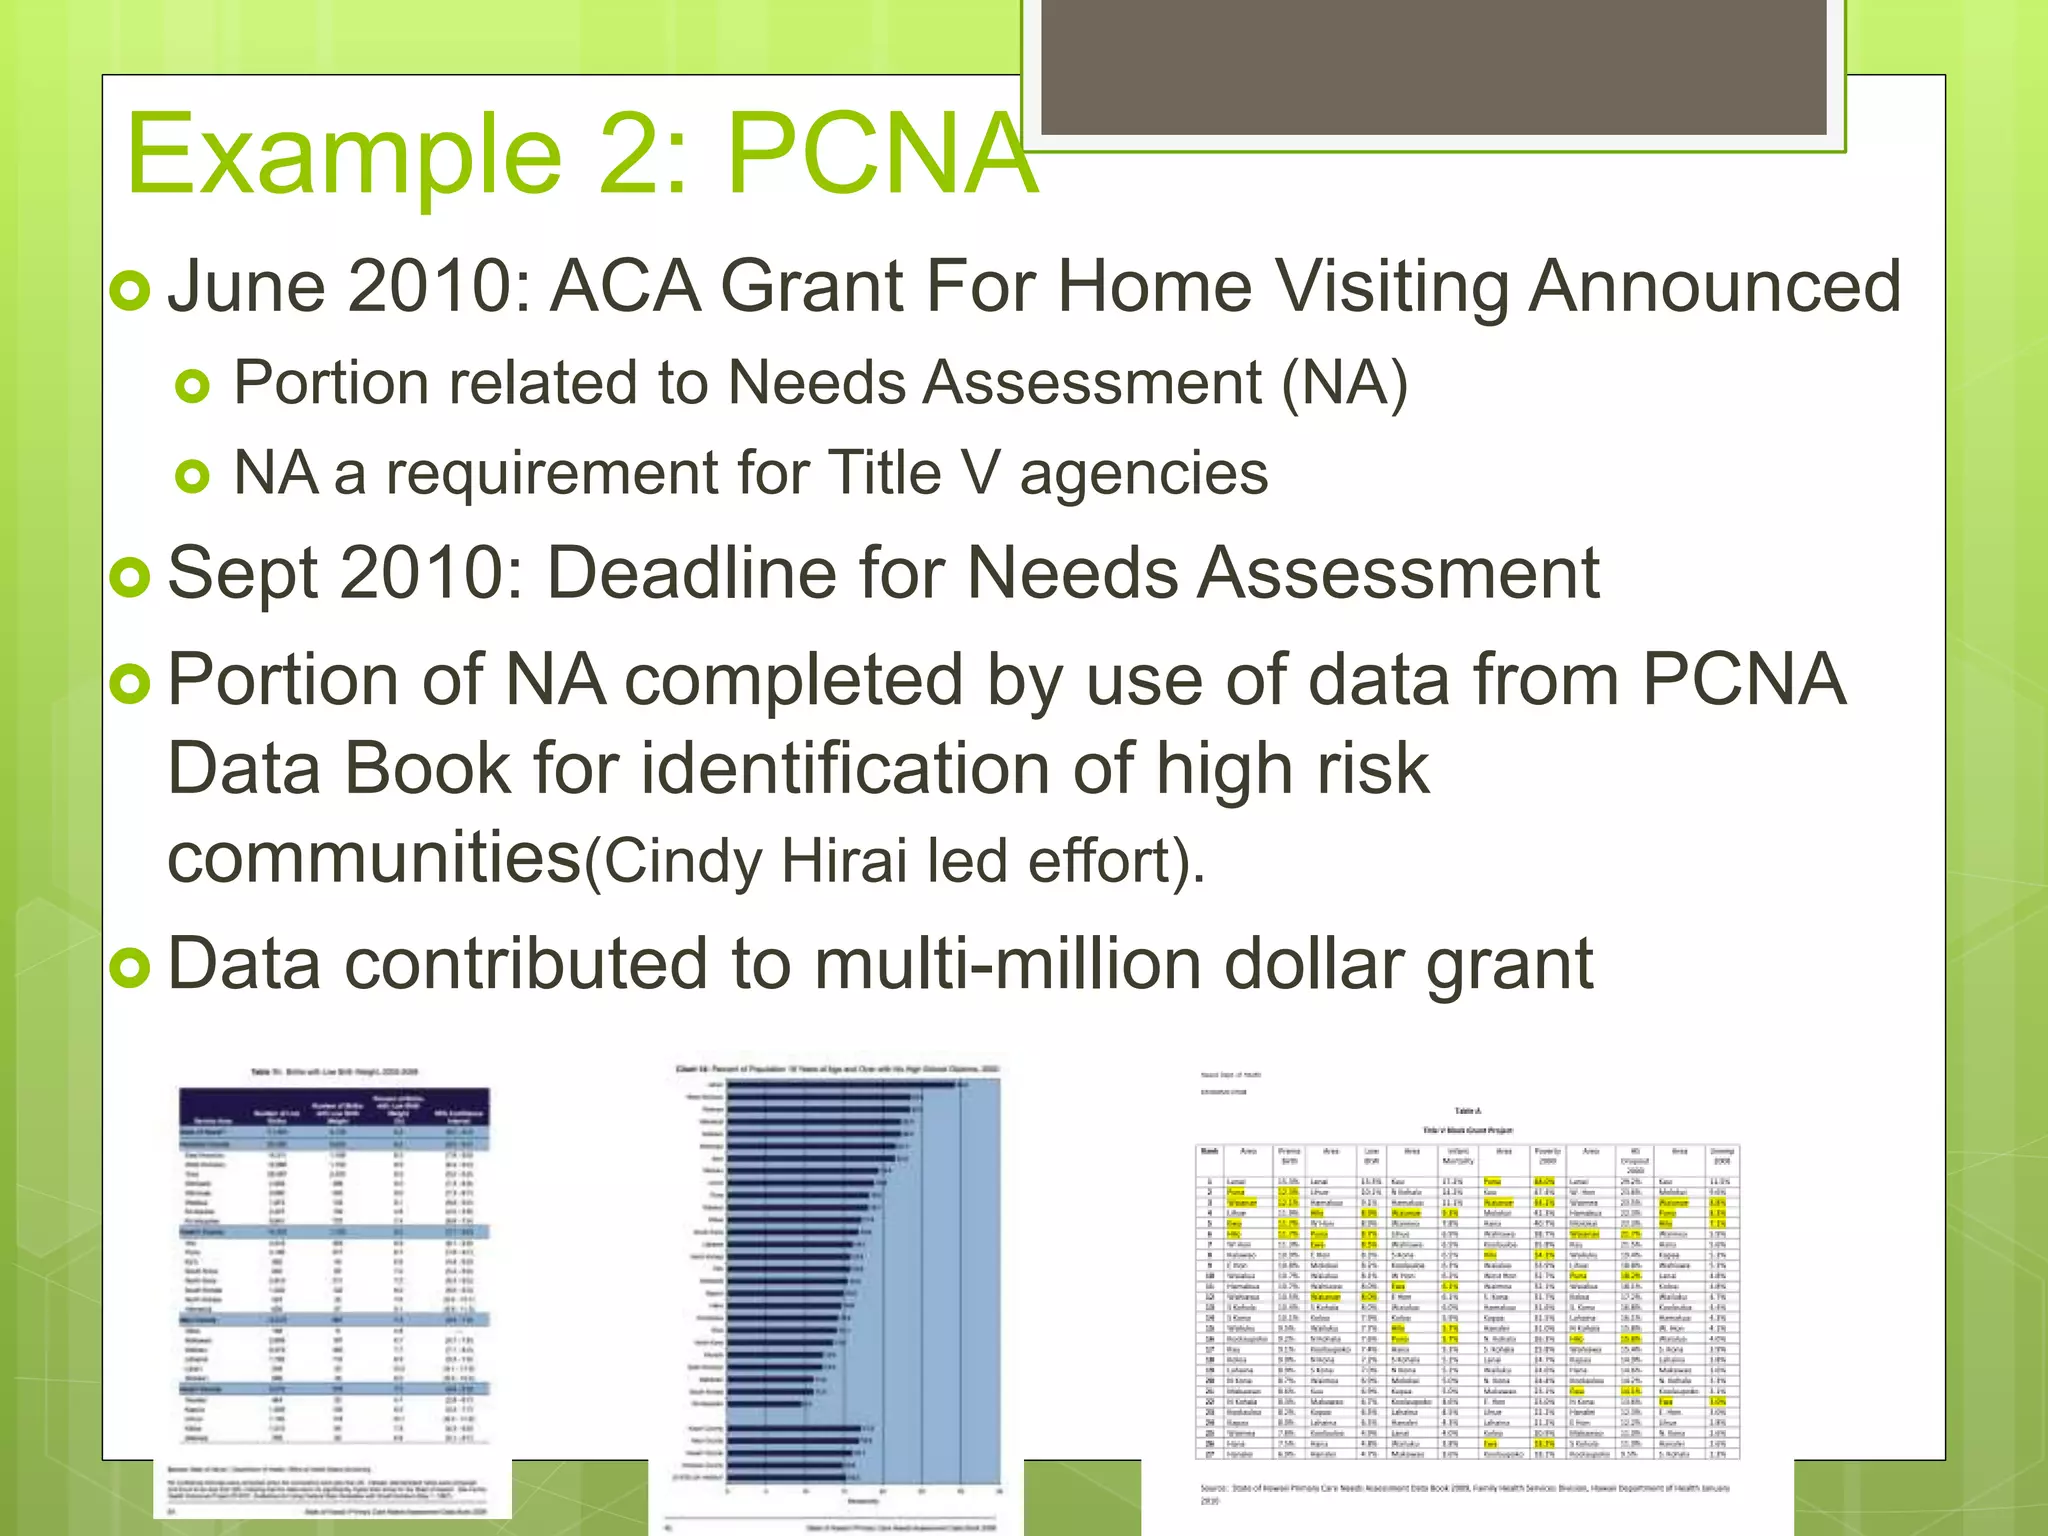
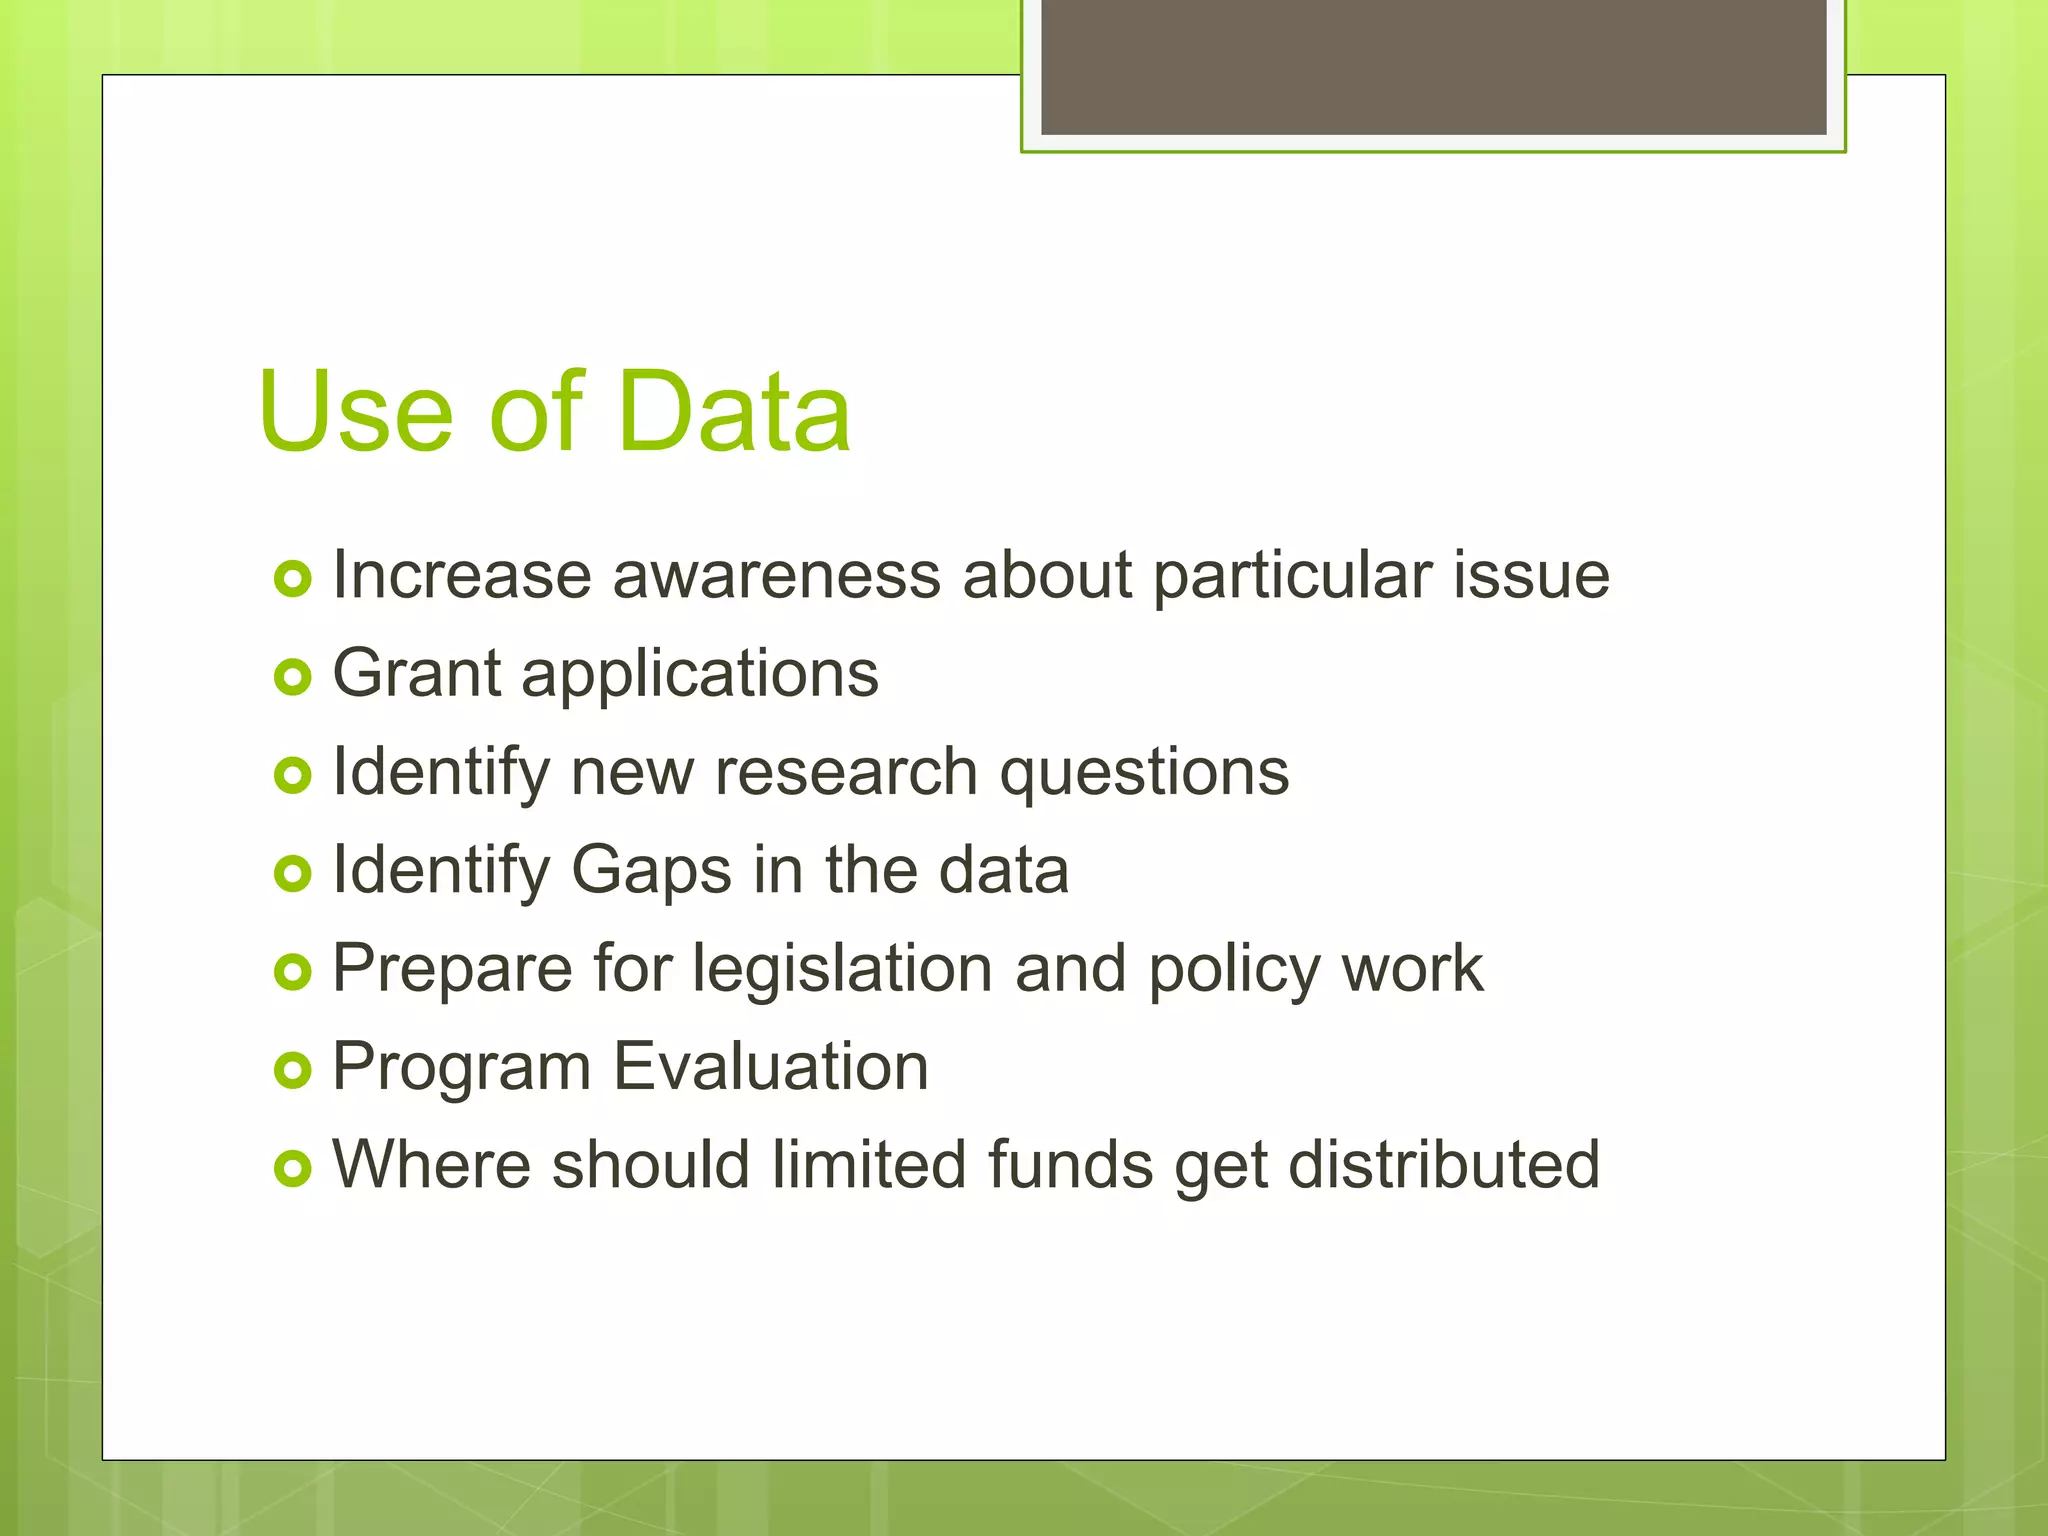
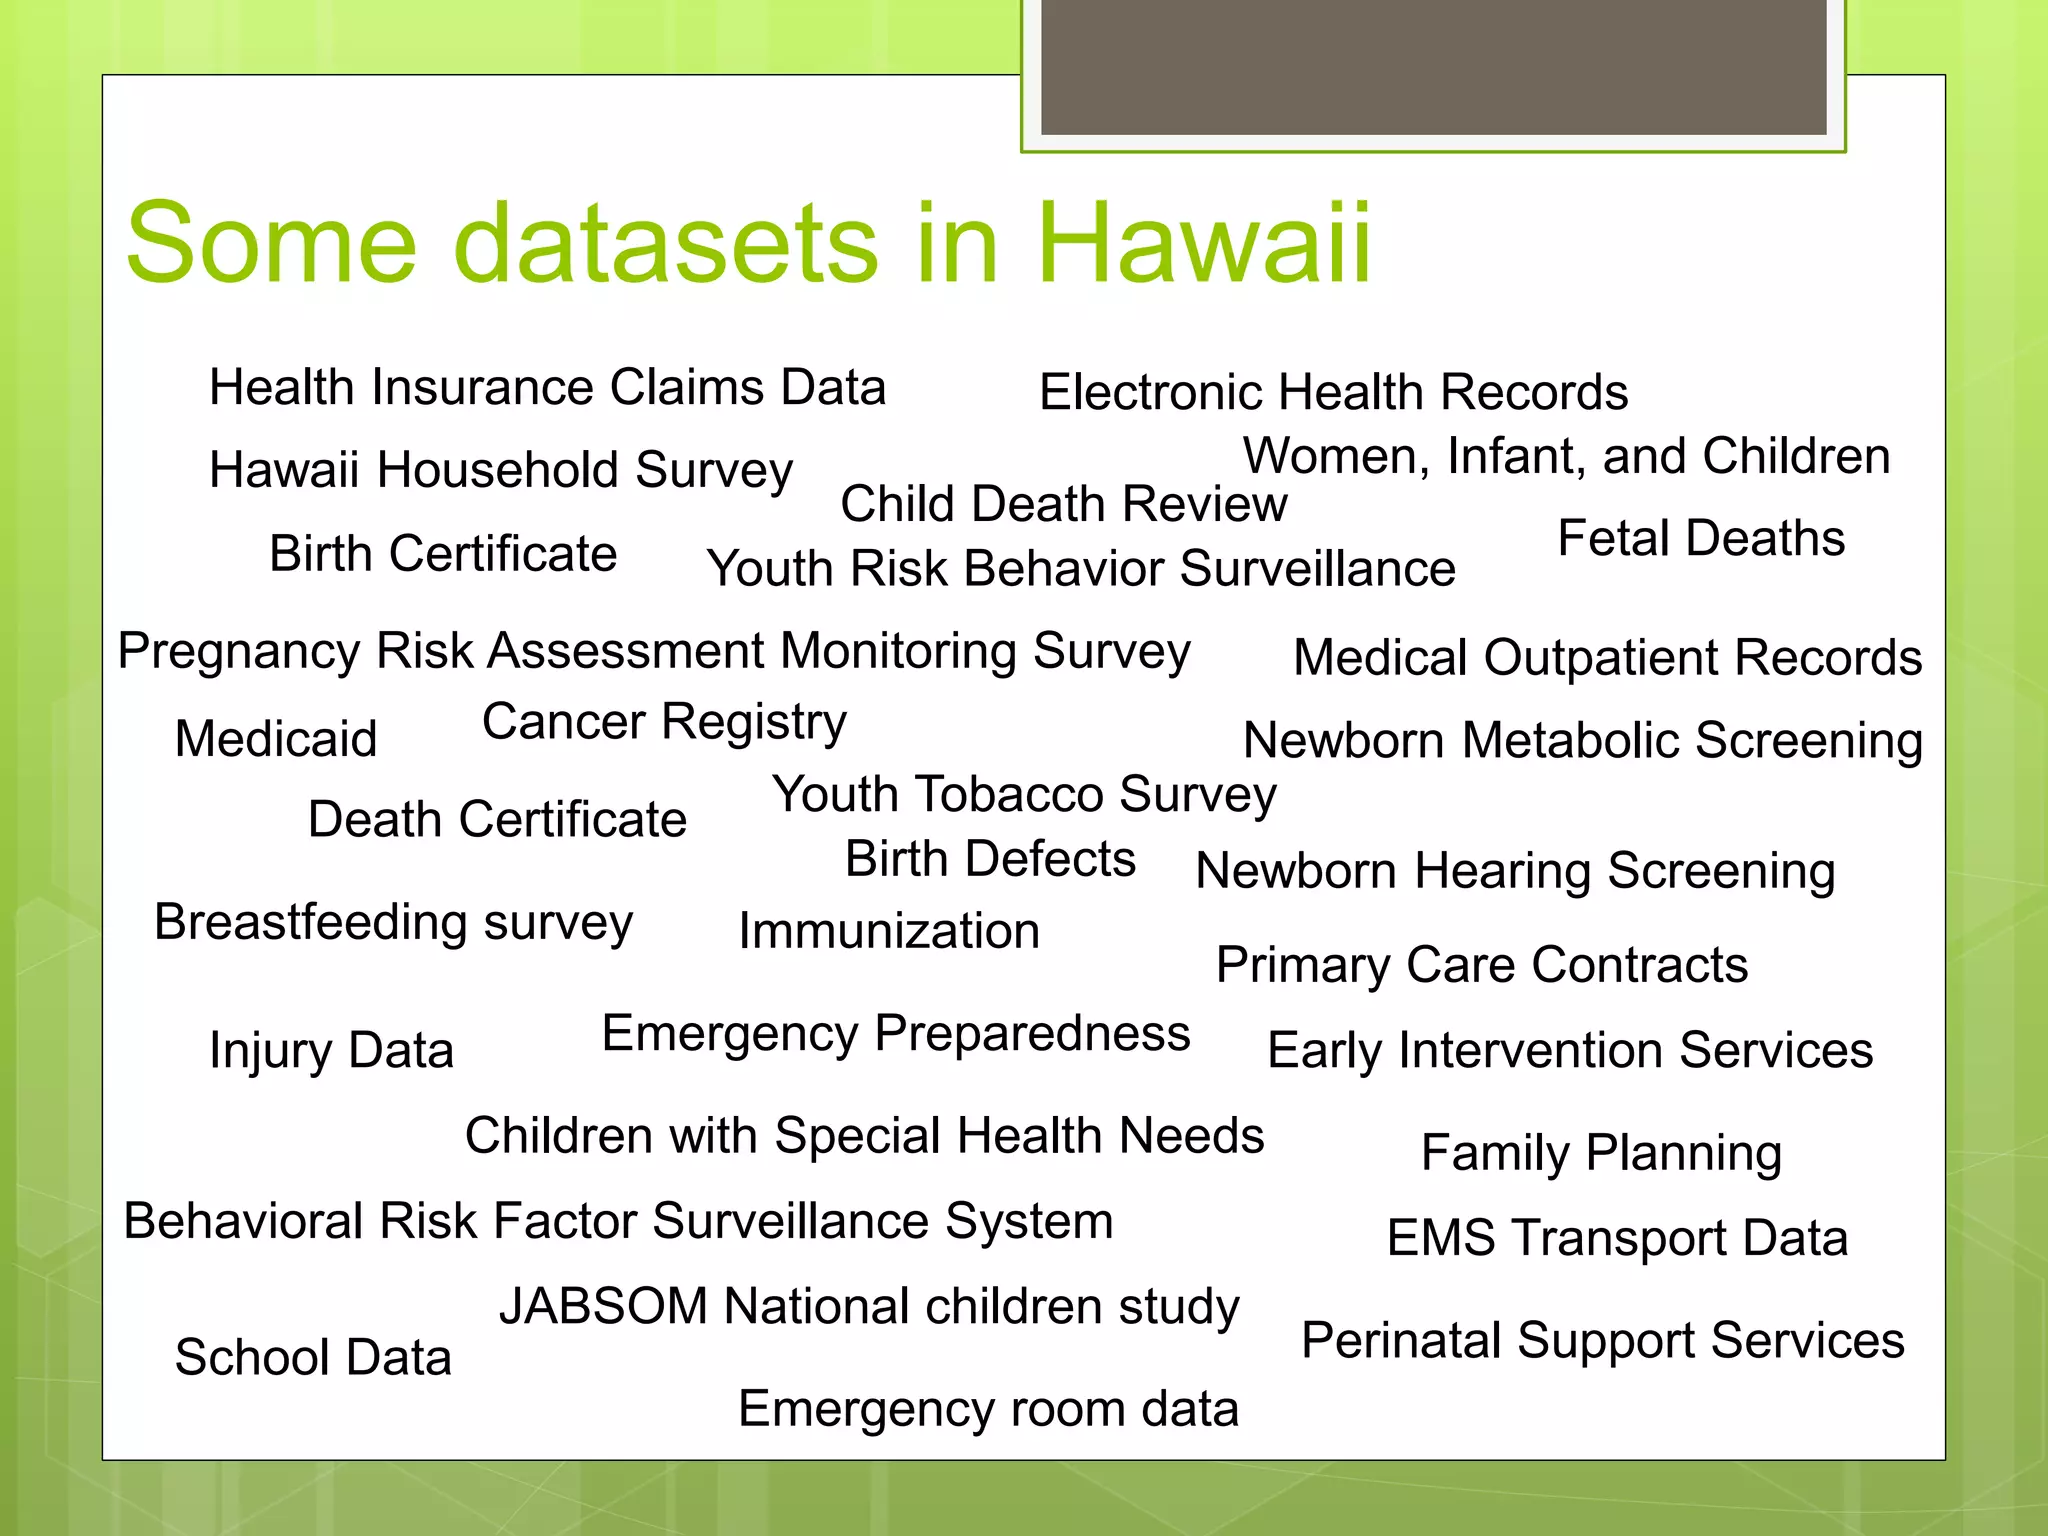
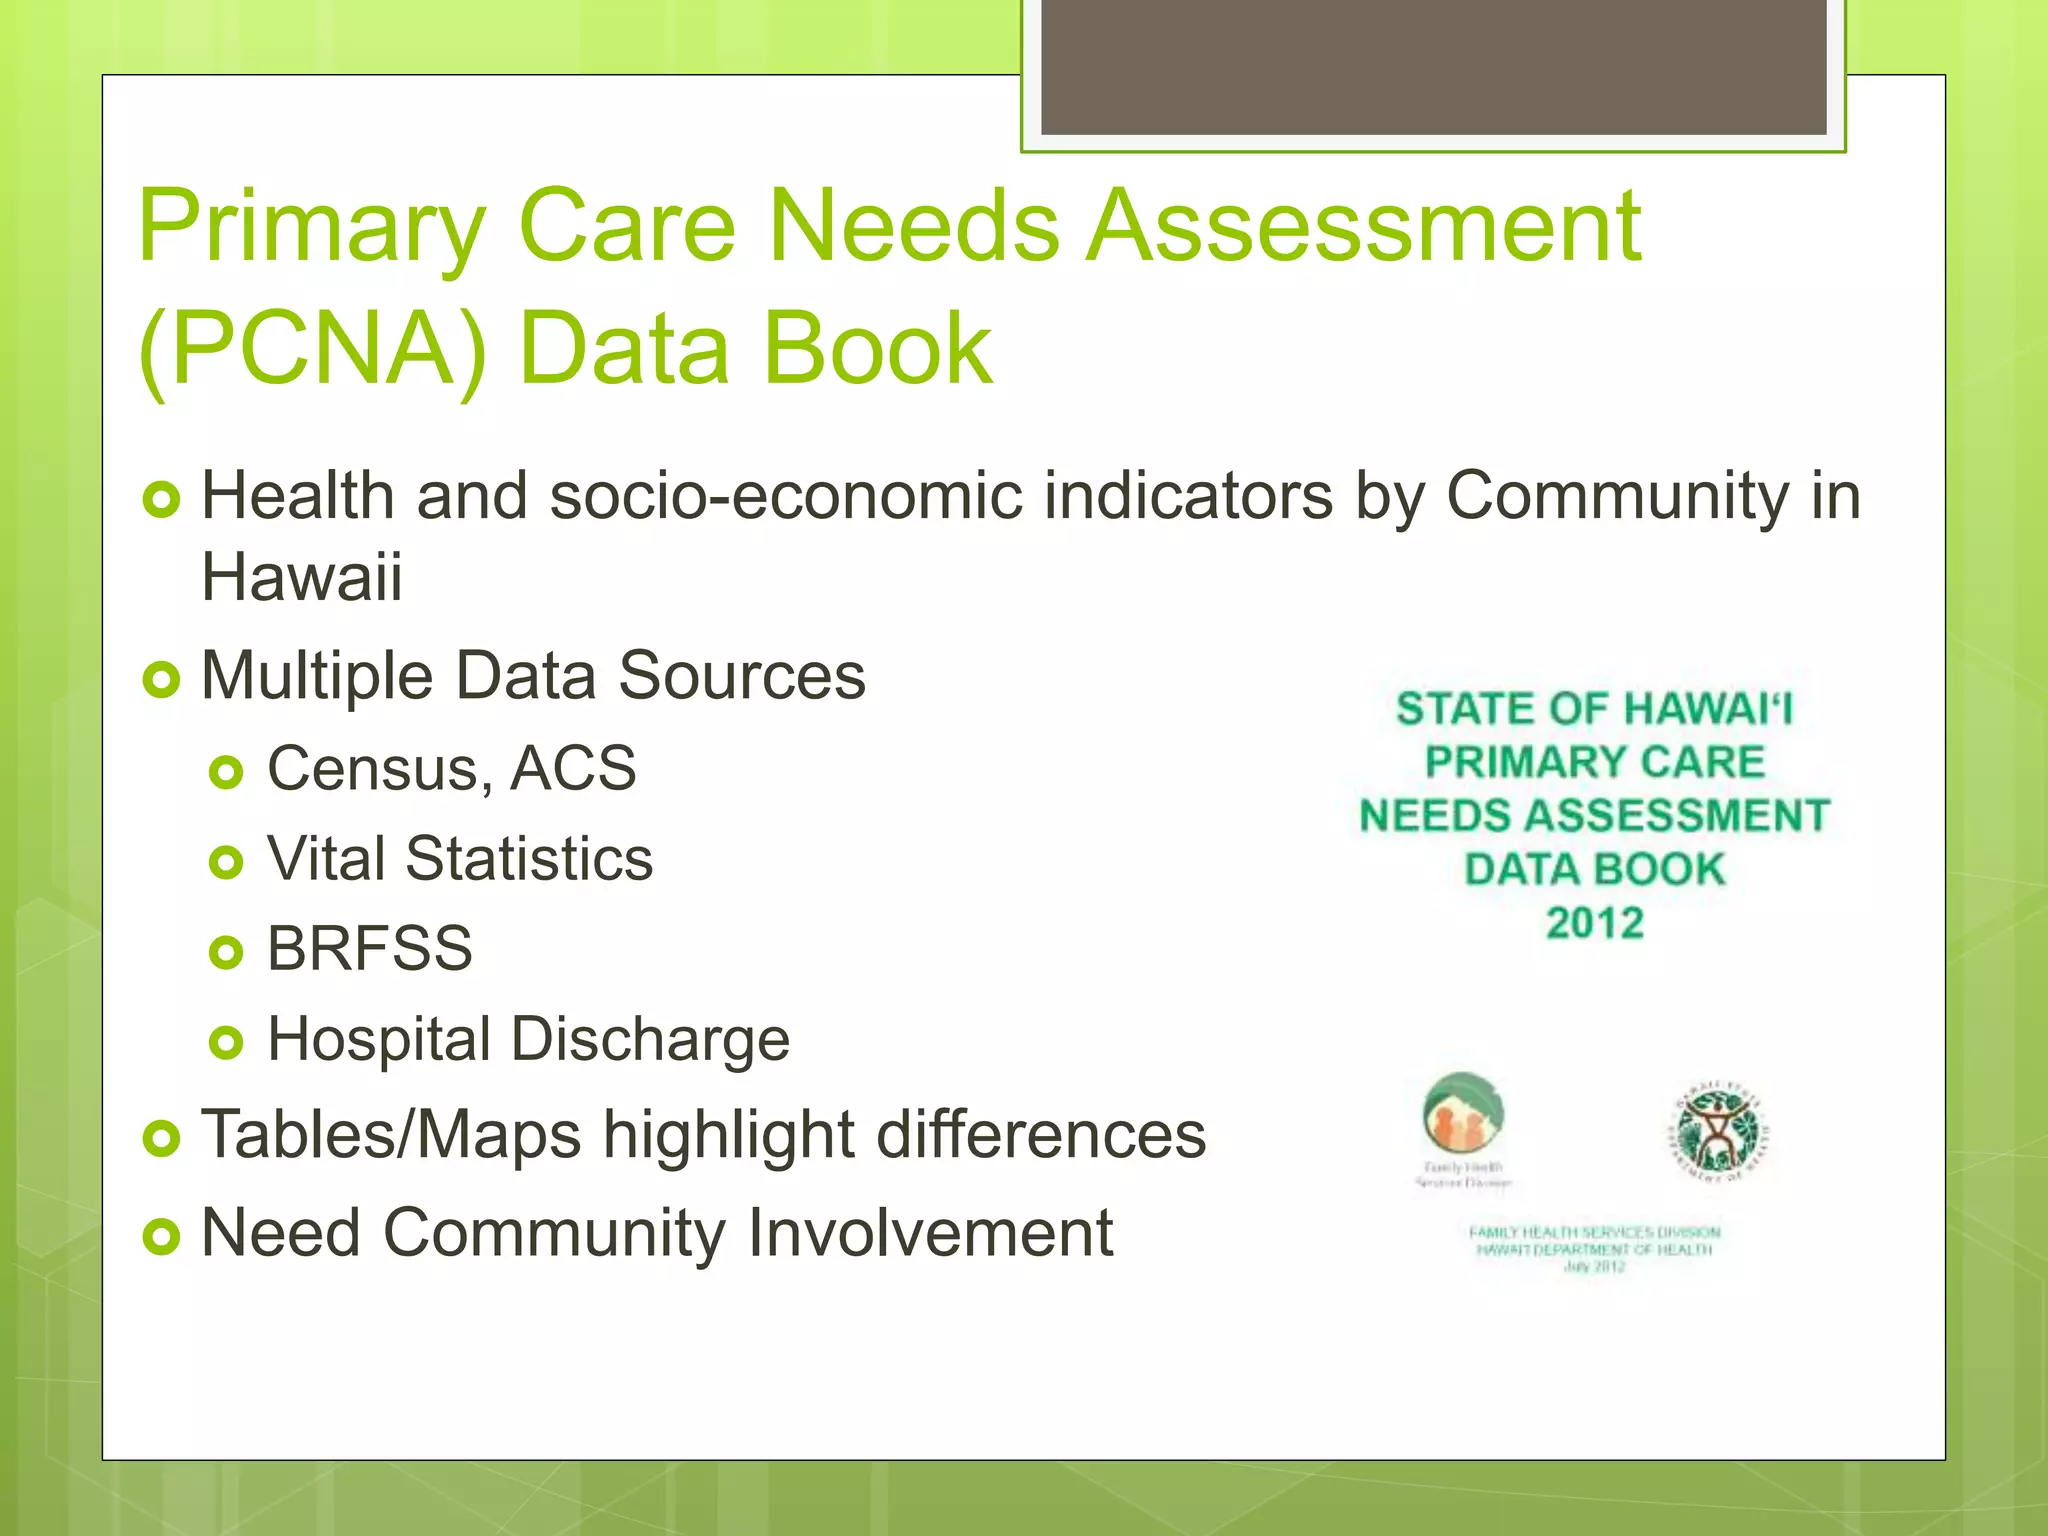
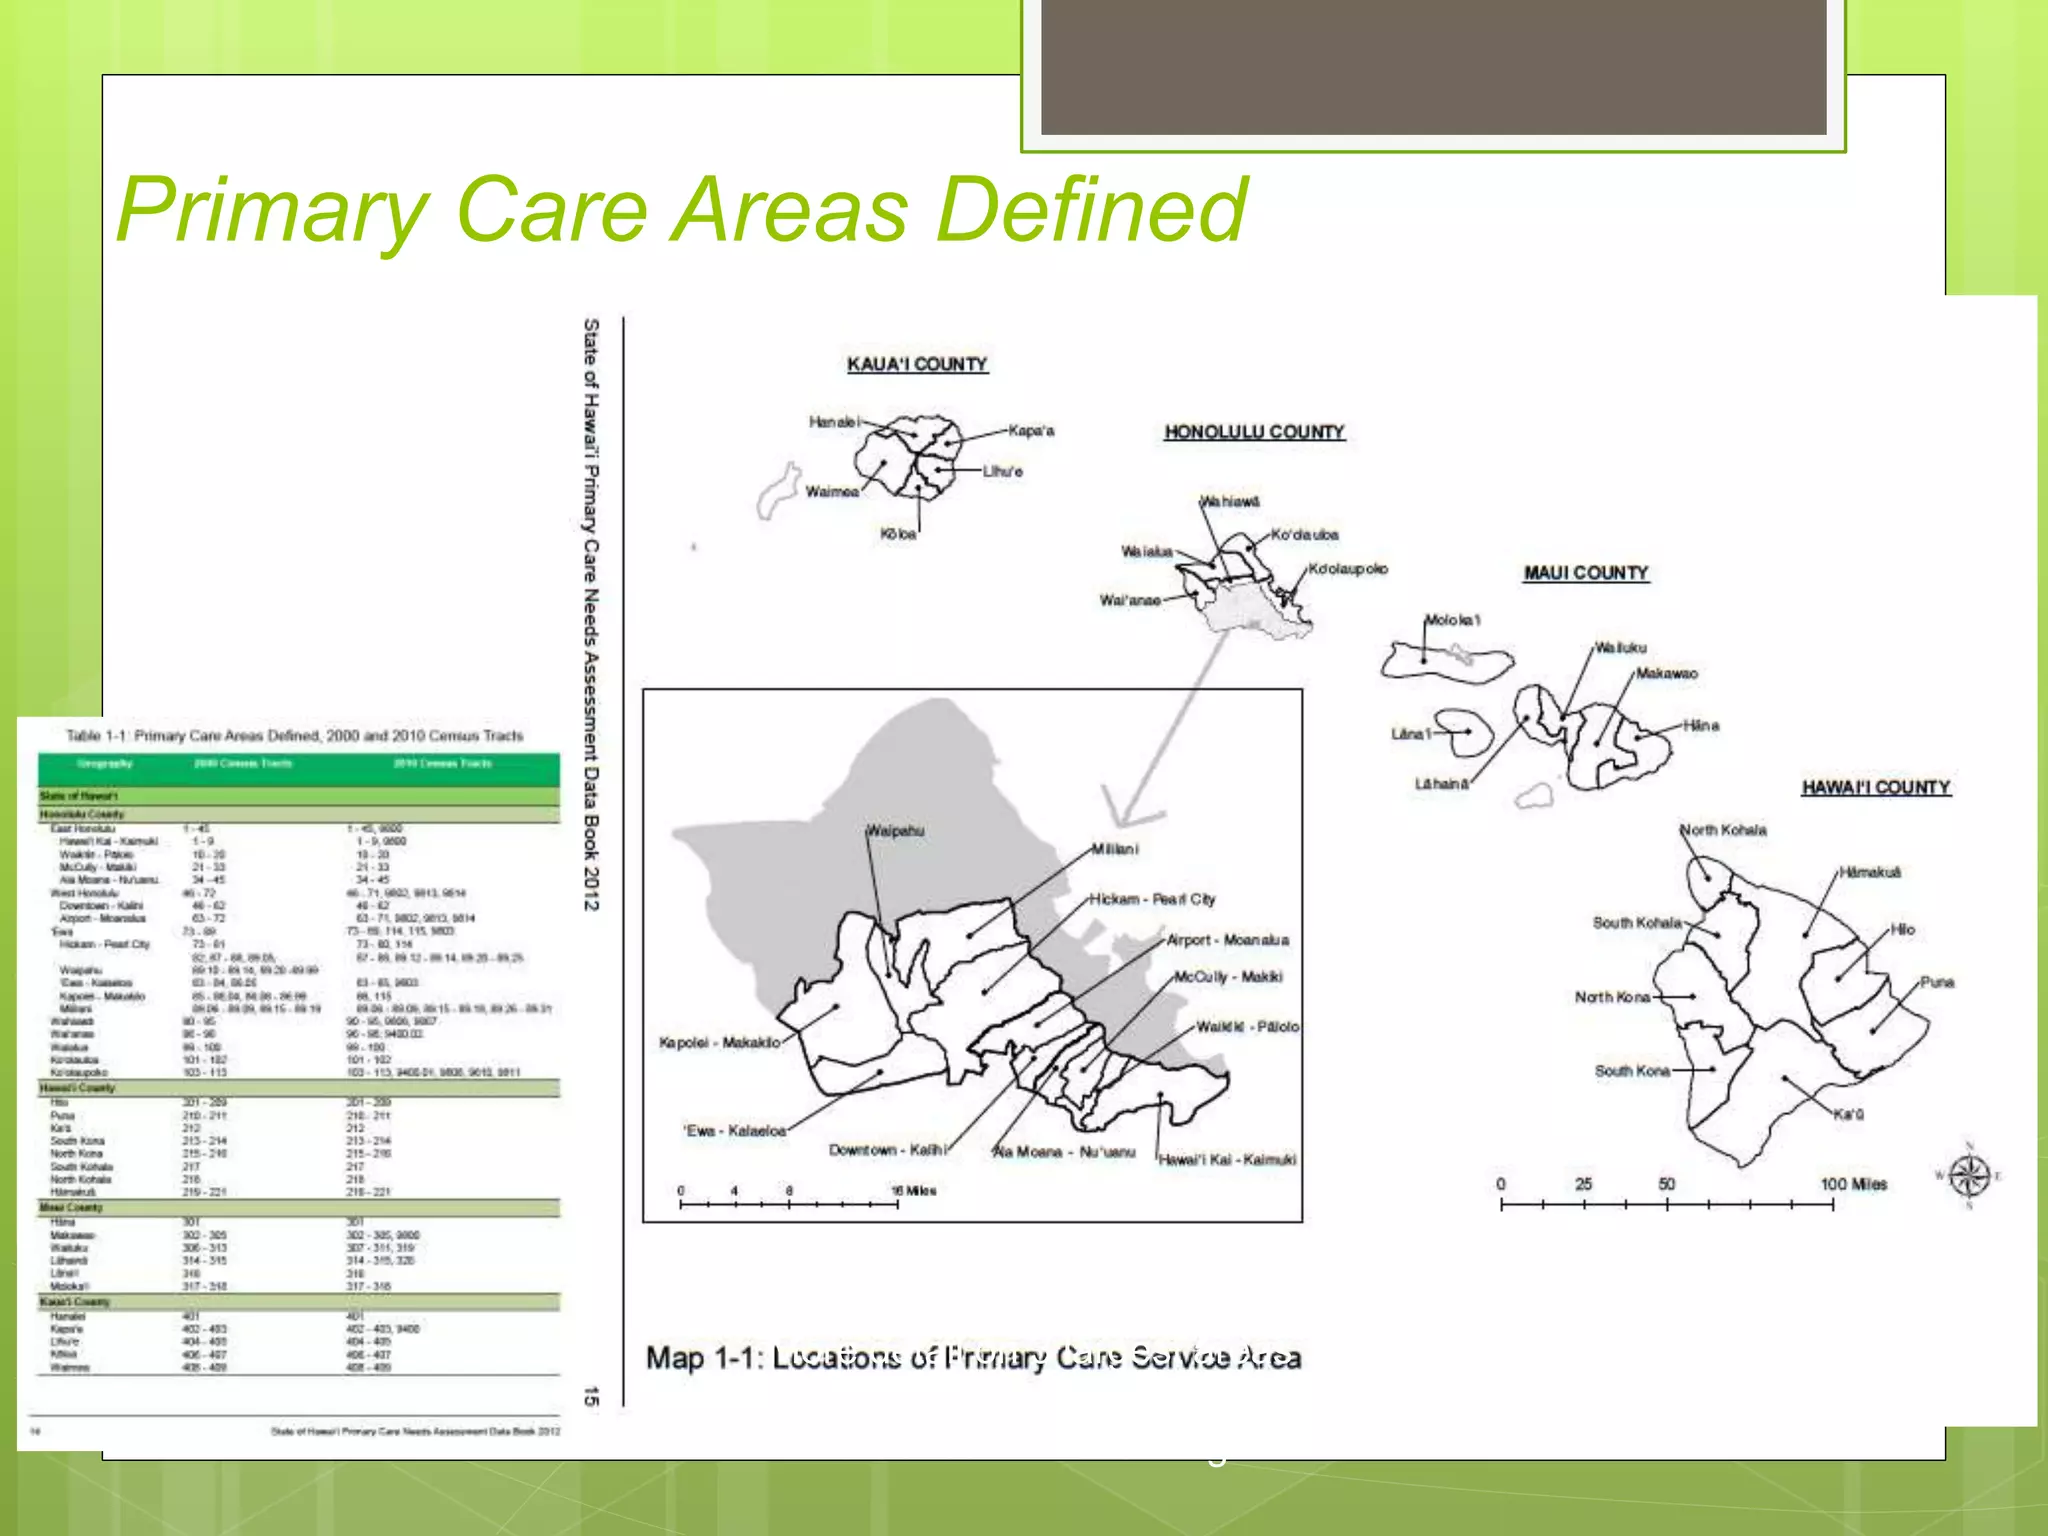
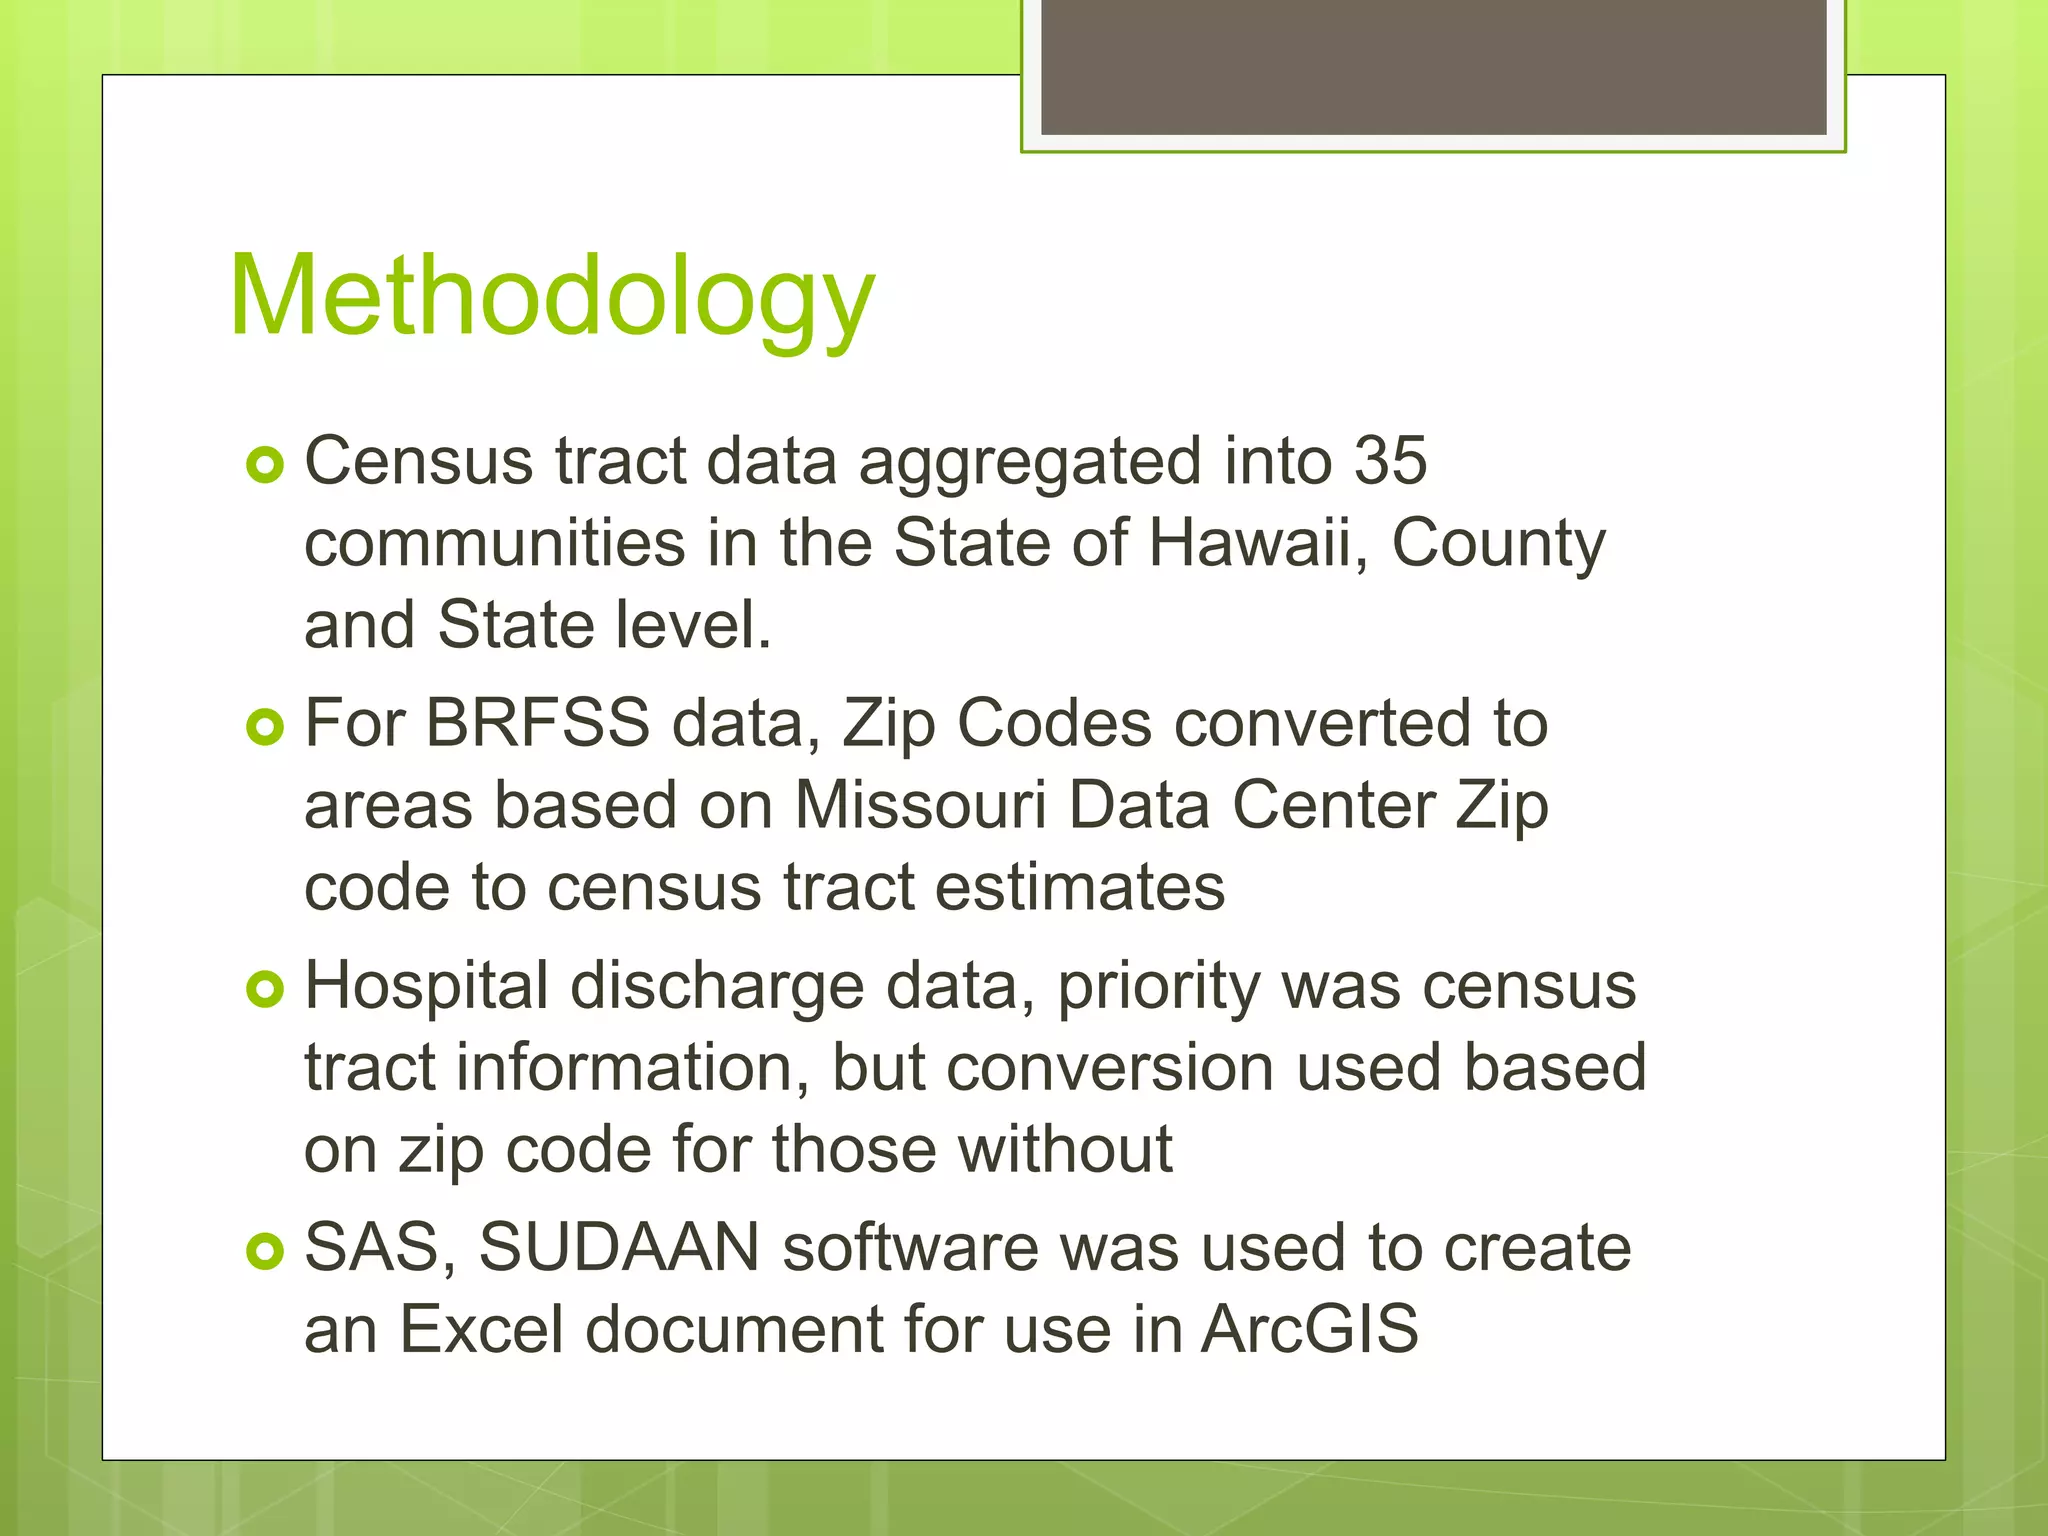
This document summarizes Donald Hayes' presentation on the use of geographic information systems (GIS) technology and community level data visualization to inform planning efforts in Hawaii. Some key points: - The Hawaii Department of Health uses a variety of health and socioeconomic datasets to identify needs, support grant applications, research, legislation and program evaluation. - Data is compiled into a Primary Care Data Book which provides indicators by community on health outcomes, risk factors and socioeconomics using data sources like the census and vital records. - The Data Book is used to assess primary care needs, highlight differences between communities, and facilitate data-driven decision making. It has supported funding and policy decisions and is utilized by various organizations.


