Download to read offline

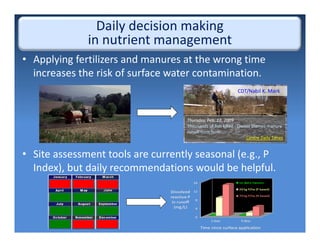
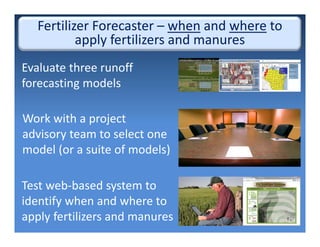
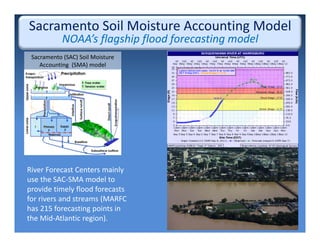
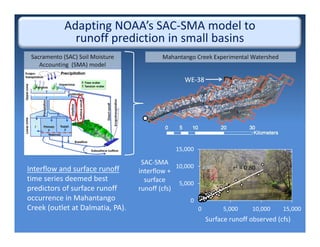
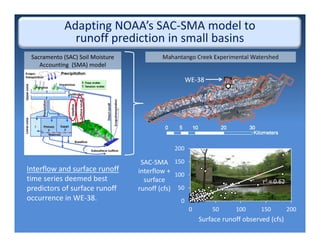
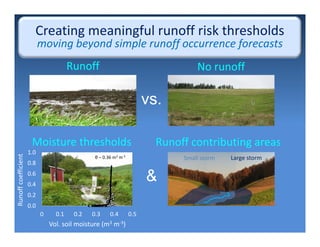
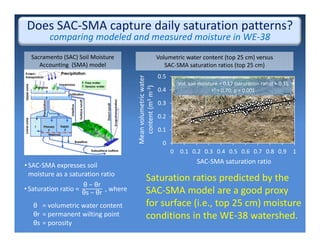
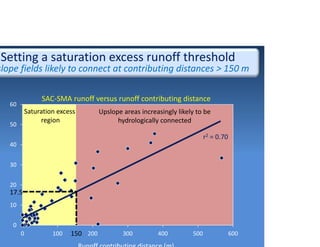
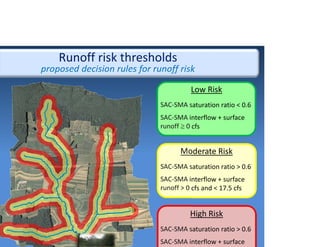
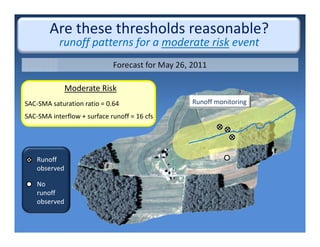
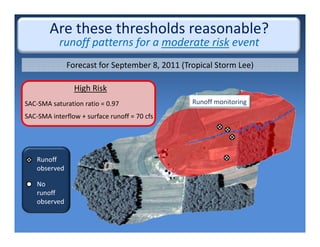
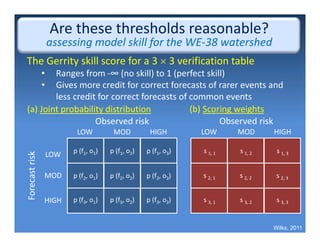
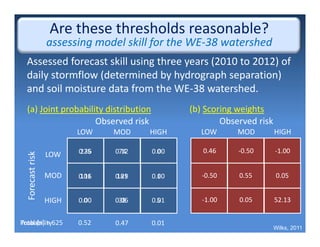
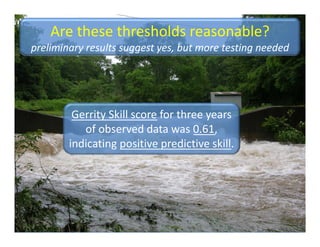
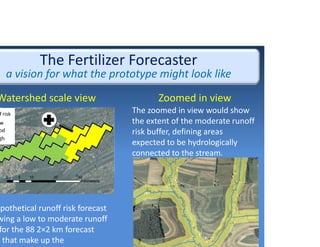
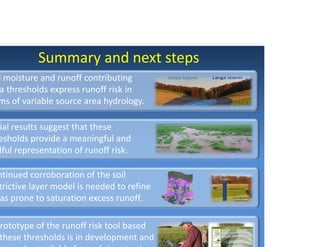

This project developed runoff forecasting models and thresholds to guide short-term nutrient management decisions. It tested the Sacramento Soil Moisture Accounting model and found it could predict runoff occurrence and soil moisture levels. Based on field data, it established thresholds for low, moderate, and high runoff risk based on soil saturation levels and forecasted runoff amounts. Initial tests found the thresholds had predictive skill. The project aims to create a web tool to provide watershed-scale and local-scale runoff risk forecasts to inform nutrient application decisions. Continued validation of the soil moisture and runoff models is needed.


