
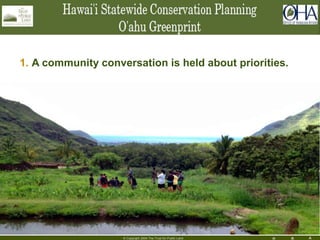
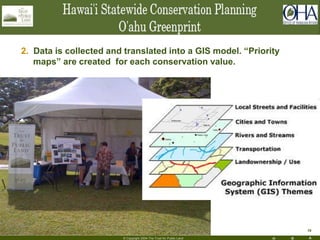
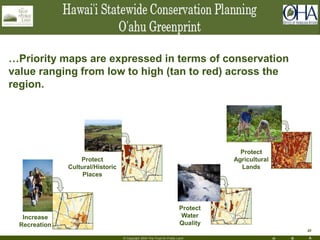
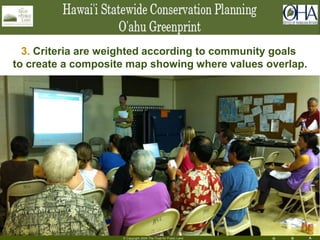
Download to read offline

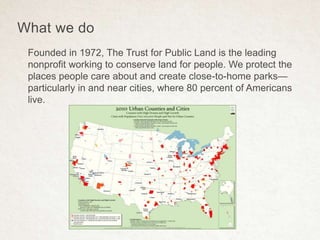
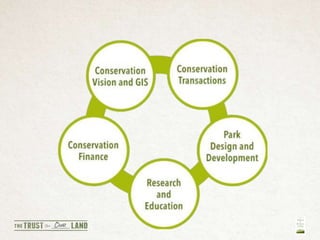
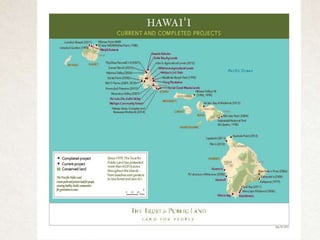
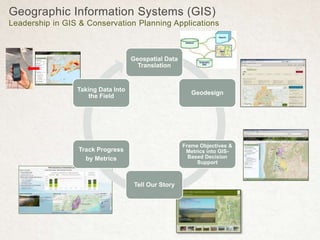
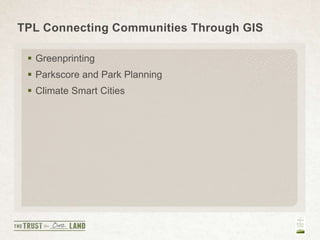
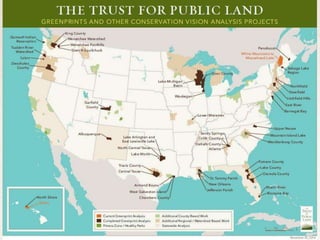
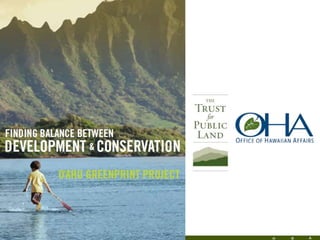
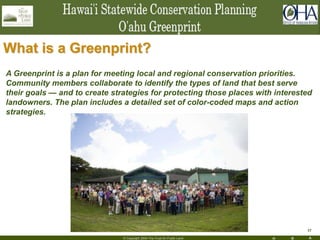
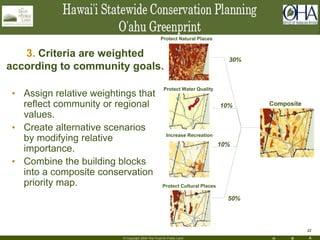
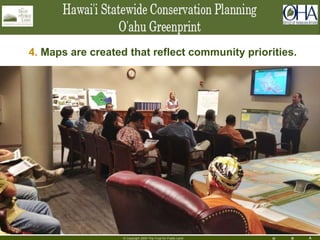
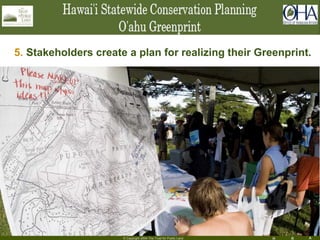
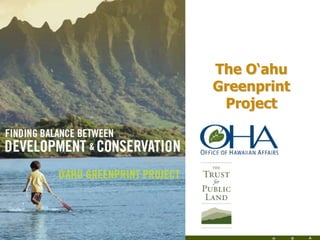
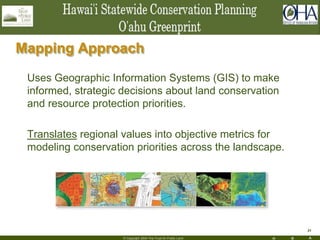

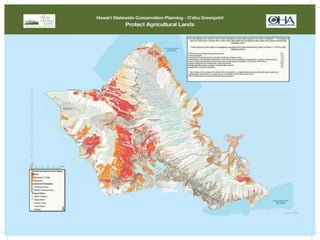

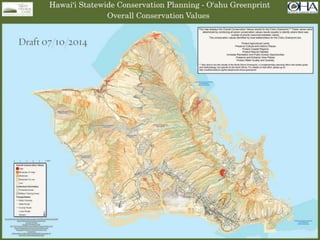
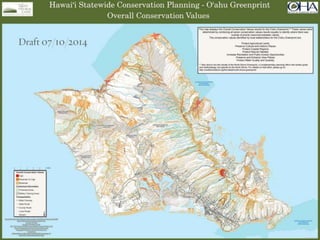
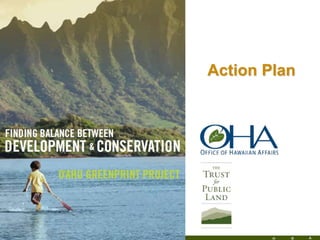
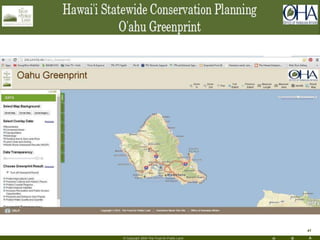
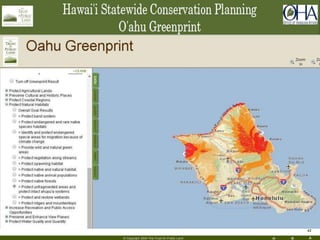
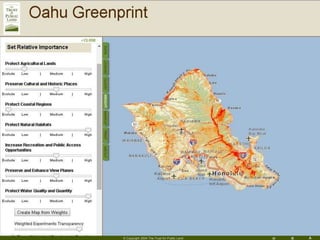
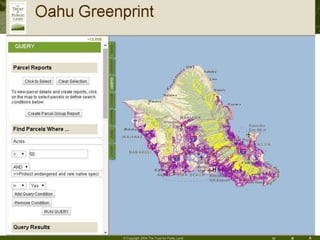
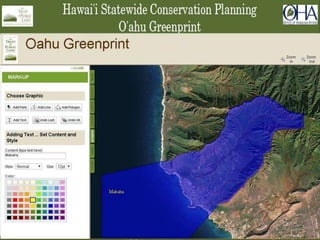
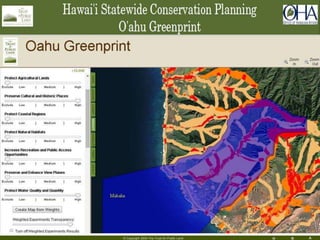
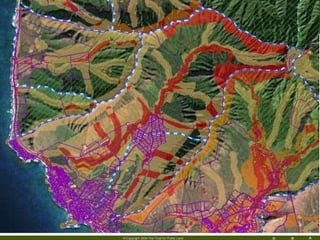
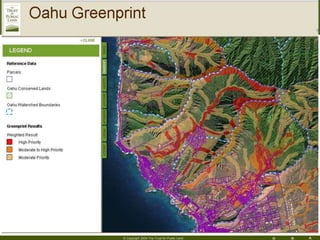
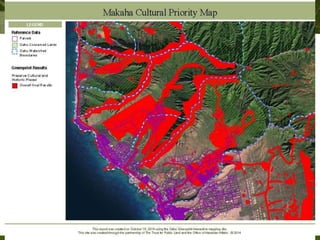
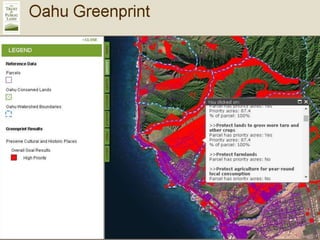
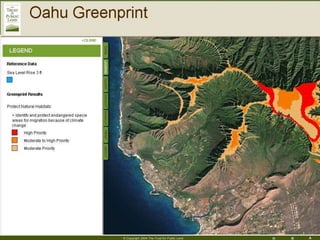
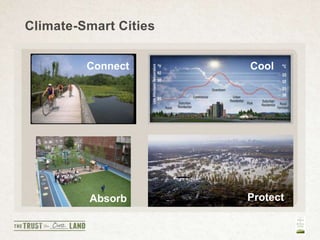
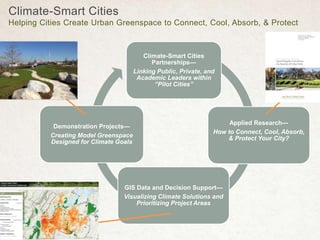
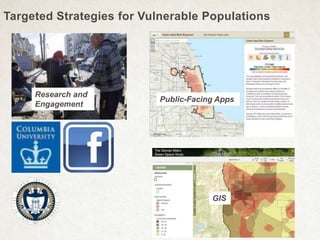
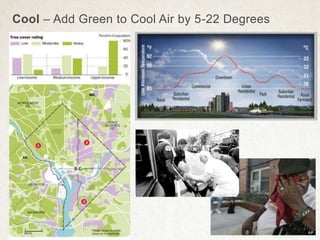
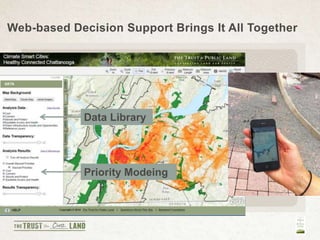
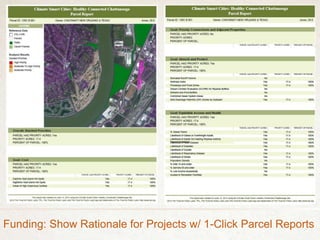
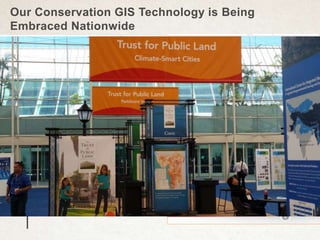


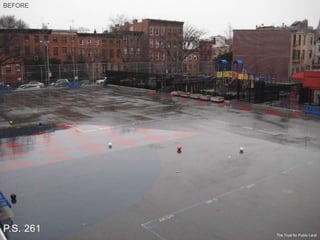

The document discusses how The Trust for Public Land uses geographic information systems (GIS) to connect communities through conservation planning. It explains that TPL works with communities to create "Greenprints", which are plans that identify local conservation priorities through public engagement and GIS modeling. Greenprints incorporate weighted criteria like recreation, habitat protection, and water quality to create composite maps of conservation value. These maps guide land prioritization and stakeholder action planning. The document provides examples of TPL's Greenprinting work in Hawaii and its Climate Smart Cities initiative, which uses GIS to help communities increase greenspace and mitigate climate impacts.


