SlideShare a Scribd company logo
Chapter 10: Heteroskedasticity
 In this chapter:
    1. Graphing to detect heteroskedasticity (UE 10.1)
    2. Testing for heteroskedasticity: the Park test (UE 10.3.2)
    3. Testing for heteroskedasticity: White's test (UE 10.3.3)
    4. Remedies for heteroskedasticity: weighted least squares (UE 10.4.1)
    5. Remedies for heteroskedasticity: heteroskedasticity corrected standard errors (UE
        10.4.2)
    6. Remedies for heteroskedasticity: redefining variables (UE 10.4.3)
    7. Exercises

    The petroleum consumption example specified in UE 10.5 will be used to demonstrate all
    aspects of heteroskedasticity covered in this guide. Data for this problem is found in
    EViews workfile named Gas10.wf1 and printed in Table 10.1 (UE, p. 371).

 Graphing to detect heteroskedasticity (UE 10.1):

    Figures 10.1, 10.2, and 10.3 in UE 10.1 demonstrate the value of a graph in detecting and
    identifying the source of heteroskedastic error. By graphing the residual from a
    regression against suspected variables, the researcher can often observe whether the
    variance of the error term changes systematically as a function of that variable.

    Follow these steps to graph the residual from a regression against each of the independent
    variables in a model:

Step 1. Open the EViews workfile named Gas10.wf1.
Step 2. Select Objects/New Object/Equation on the workfile menu bar, enter PCON C REG
    TAX in the Equation Specification: window, and. click OK.
Step 3. Select Name on the equation menu bar, enter EQ01 in the Name to identify object:
    window, and click OK.
Step 4. Make a residual series named E and save the workfile.
Step 5. Make a Simple Scatter graph of E against REG to get the graph on the left below.
Step 6. Make a Simple Scatter graph of E against TAX to get the graph on the right below.
Testing for heteroskedasticity: the Park test (UE 10.3.2):

      Complete Steps 1-3 of the section entitled Graphing to detect heteroskedasticity before
      attempting this section. Follow these steps to complete the Park test for
      heteroskedasticity:

 Step 1. Open the EViews
     workfile named Gas10.wf1.
 Step 2. Select Objects/New
     Object/Equation on the
     workfile menu bar, enter
     log(E^2) C log(REG) in the
     Equation Specification:
     window, and click OK to
     reveal the EViews output on
     the right.
 Step 3. Test the significance of
     the coefficient on log(REG).

   Testing for heteroskedasticity: White's test (UE 10.3.3 & UE, Equation 10.12):

      Complete Steps 1-3 of the section entitled Graphing to detect heteroskedasticity before
      attempting this section. Follow these steps to complete White's test for heteroskedasticity:

Step 1. Open the EViews workfile
      named Gas10.wf1.
Step 2. Select Objects/New
      Object/Equation on the
      workfile menu bar and enter
      PCON C REG TAX in the
      Equation Specification:
      window. Click OK.
Step 3. To carry out White’s
      heteroskedasticity test for
      the regression in Step 2,
      select View/Residual
      Tests/White
      Heteroskedasticity (cross
      terms) to get the output on
      the right. EViews reports
      two test statistics from the
      test regression. The Obs*R-
      squared statistic highlighted
      in yellow and boxed in red,
      is White’s test statistic. It is
      computed as the number of
observations (n) times the R2 from the test regression. White’s test statistic is
      asymptotically distributed as a χ2 with degrees of freedom equal to the number of slope
      coefficients, excluding the constant, in the test regression (five in this example).
Step 4. The critical χ2 value can be calculated in EViews by typing the following formula in
      the EViews command window: =@qchisq(.95,5).1 After typing the formula and hitting
      Enter on the keyboard,                                appears in the lower left of the EViews
      screen (the same value found in UE, Table B-8). Since the nR2 value of 33.2256393731 is
      greater than the 5% critical χ2 value of 11.0704976935, we can reject the null hypothesis
      of no heteroskedasticity. The probability printed to the right of the nR2 value in the
      EViews output for White’s heteroskedasticity test (i.e., 0.000003) represents the
      probability that you would be incorrect if you rejected the null hypothesis of no
      heteroskedasticity.2 The F-statistic is an omitted variable test for the joint significance of
      all cross products, excluding the constant. It is printed above White's test statistic for
      comparison purposes.

   Remedies for heteroskedasticity: weighted least squares (UE 10.4.1):

      Follow these steps to estimate the weighted least squares using REG as the
      proportionality factor:

Step 1. Open the EViews
      workfile named
      Gas10.wf1.
Step 2. Select Objects/New
      Object/Equation on
      the workfile menu bar,
      enter PCON/REG
      1/REG REG/REG
      TAX/REG in the
      Equation
      Specification:
      window, and click
      OK. Note the
      coefficients
      highlighted in yellow.


      1
        c=@qchisq(p,v) calculates the percentile of the χ2 distribution . The formula finds the value c such that
      the prob(χ2 with v degrees of freedom is ≤ c) = p. In this case, the prob(χ2 with 5 degrees of freedom is ≤
      11.0704976935) =95%. In other words, 95% of the area of a χ2 distribution, with v=5 degrees of freedom,
      is in the range from 0 to 11.0704976935 and 5% is in the range from 11.0704976935 to ∞ (in the tail).
      2
        The probability value is calculated with the formula =@chisq(x,v), which returns the probability that a
      chi-squared statistic with v degrees of freedom exceeds x. To verify this, type the formula
      =@chisq(33.2256393731,5) in the EViews command window and read the value of 3.39442964858e-06 on
      the lower left of the EViews screen.
Step 3. Select Objects/New
      Object/Equation on the
      workfile menu bar and
      enter PCON C REG TAX
      in the Equation
      Specification: window,
      and select the  O Options
      button (see the arrow
      pointing toward the red
      box area in the graphic
      on the right).
Step 4. Check the Weighted
      LS/TSLS box and enter 1/REG in the
      Weight: window (see the yellow
      highlighted and red boxed areas in the
      graphic on the right).
Step 5. Select OK to accept the options and
      select OK again to estimate the equation.
      Note that the weighted least squares
      coefficients found in Step 2 are the same
      as the coefficients found in Step 5 using
      the EViews weighted least squares
      option.3


     3
       EViews performs weighted least squares by first dividing the weight series by its mean, then multiplying
     all of the data for each observation by the scaled weight series. The scaling of the weight series is a
     normalization that has no effect on the parameter results, but makes the weighted residuals more
     comparable to the un-weighted residuals. The normalization does imply, however, that EViews weighted
     least squares is not appropriate in situations where the scale of the weight series is relevant, as in frequency
     weighting.
Remedies for heteroskedasticity: heteroskedasticity corrected standard errors (UE
 10.4.2):

    Follow these steps to estimate heteroskedasticity corrected standard errors regression:

Step 1. Open the EViews workfile named Gas10.wf1.
Step 2. Select Objects/New Object/Equation on the workfile menu bar and enter PCON C
    REG TAX in the Equation Specification: window, and select the      O   Options button.
Step 3. Check the Heteroskedasticity
    Consistent Covariances (White)
    box (see the yellow highlighted and
    red boxed areas in the graphic on the
    right).
Step 4. Select OK to accept the options
    and select OK again to estimate the
    equation.
Step 5. Compare the Estimation Output
    from the regression with the
    Heteroskedasticity Consistent
    Covariance on the lower left with the
    Estimation Output from the
    uncorrected OLS regression on the
    lower right (EQ01). Note that the
    coefficients are the same but the
    uncorrected std. error is smaller. This means that the Heteroskedasticity Consistent
    Covariance correction has reduced the size of the t-statistics for the coefficients, a typical
    result. However, in this case both of the slope coefficients remain significant at the 5%
    level but the TAX variable coefficient is no longer significant at the 1% level.
Remedies for heteroskedasticity: redefining variables (UE 10.4.3):

    Follow these steps to estimate UE, Equation 10.30, p. 374:

Step 1. Open the EViews workfile named Gas10.wf1.
Step 2. Select Objects/New Object/Equation on the workfile menu bar, enter PCON/POP C
    REG/POP TAX in the Equation Specification: window, and click OK.

 Exercises:

    5. Create an EViews workfile and enter the average income and average consumption
       data from the table printed in Exercise 5, p.378.
       a. Refer to Testing for heteroskedasticity: the Park test.
       b. Refer to Testing for heteroskedasticity: the Park test.
       c.
       d. Refer to Remedies for heteroskedasticity: heteroskedasticity corrected standard
           errors.

    9. Open the EViews file named Books10.wf1.
       a.
       b.
       c. Refer to Testing for heteroskedasticity: the Park test and Testing for
          heteroskedasticity: White's test.
       d. Refer to Remedies for heteroskedasticity: weighted least squares.
       e. Refer to Remedies for heteroskedasticity: heteroskedasticity corrected standard
          errors or Remedies for heteroskedasticity: redefining variables.

    15. Open the EViews file named Bid10.wf1.
        a. Refer to Estimate a multiple regression model using EViews and Serial
           Correlation (Chapter 9).
        b. Refer to Serial Correlation (Chapter 9).
        c.
        d. Refer to Testing for heteroskedasticity: the Park test and Testing for
           heteroskedasticity: White's test.
        e. Refer to Testing for heteroskedasticity: the Park test and Testing for
           heteroskedasticity: White's test.
        f.

More Related Content

What's hot

Heteroscedasticity
HeteroscedasticityHeteroscedasticity
Heteroscedasticity
Muhammad Ali
 
Structural VAR: the AB model
Structural VAR: the AB modelStructural VAR: the AB model
Structural VAR: the AB model
Anissa ATMANI
 
7 classical assumptions of ordinary least squares
7 classical assumptions of ordinary least squares7 classical assumptions of ordinary least squares
7 classical assumptions of ordinary least squares
Yugesh Dutt Panday
 
ECONOMETRICS
ECONOMETRICSECONOMETRICS
ECONOMETRICS
shiva murthy
 
Rules for identification
Rules for identificationRules for identification
Rules for identification
GarimaGupta229
 
Gregory mankiw macroeconomic 7th edition chapter (1)
Gregory mankiw macroeconomic 7th edition chapter  (1)Gregory mankiw macroeconomic 7th edition chapter  (1)
Gregory mankiw macroeconomic 7th edition chapter (1)
Kyaw Thiha
 
Functional forms in regression
Functional forms in regressionFunctional forms in regression
Functional forms in regression
B SWAMINATHAN
 
Introduction to Econometrics
Introduction to EconometricsIntroduction to Econometrics
Introduction to Econometrics
RajendranC4
 
cournot model
cournot modelcournot model
cournot model
nazirali423
 
Chapter 06 - Heteroskedasticity.pptx
Chapter 06 - Heteroskedasticity.pptxChapter 06 - Heteroskedasticity.pptx
Chapter 06 - Heteroskedasticity.pptx
Farah Amir
 
Heteroscedasticity
HeteroscedasticityHeteroscedasticity
Heteroscedasticity
Madurai Kamaraj University
 
Macro i ch_1
Macro i ch_1Macro i ch_1
Macro i ch_1
ssusera9bb49
 
Statistical Techniques in Business & Economics (McGRAV-HILL) 12 Edt. Chapter ...
Statistical Techniques in Business & Economics (McGRAV-HILL) 12 Edt. Chapter ...Statistical Techniques in Business & Economics (McGRAV-HILL) 12 Edt. Chapter ...
Statistical Techniques in Business & Economics (McGRAV-HILL) 12 Edt. Chapter ...
tarta
 
Chap19
Chap19Chap19
Fiscal Policy MC & Essay Questions - A-Level Economics
Fiscal Policy MC & Essay Questions - A-Level EconomicsFiscal Policy MC & Essay Questions - A-Level Economics
Fiscal Policy MC & Essay Questions - A-Level Economics
Qurious Education
 
Dummy variables
Dummy variablesDummy variables
Dummy variables
Irfan Hussain
 
Eco Basic 1 8
Eco Basic 1 8Eco Basic 1 8
Eco Basic 1 8
kit11229
 
Econometrics and statistics mcqs part 2
Econometrics and statistics mcqs part 2Econometrics and statistics mcqs part 2
Econometrics and statistics mcqs part 2
punjab university
 
Multicollinearity
MulticollinearityMulticollinearity
Multicollinearity
Bernard Asia
 
Identification problem in simultaneous equations model
Identification problem in simultaneous equations modelIdentification problem in simultaneous equations model
Identification problem in simultaneous equations model
GarimaGupta229
 

What's hot (20)

Heteroscedasticity
HeteroscedasticityHeteroscedasticity
Heteroscedasticity
 
Structural VAR: the AB model
Structural VAR: the AB modelStructural VAR: the AB model
Structural VAR: the AB model
 
7 classical assumptions of ordinary least squares
7 classical assumptions of ordinary least squares7 classical assumptions of ordinary least squares
7 classical assumptions of ordinary least squares
 
ECONOMETRICS
ECONOMETRICSECONOMETRICS
ECONOMETRICS
 
Rules for identification
Rules for identificationRules for identification
Rules for identification
 
Gregory mankiw macroeconomic 7th edition chapter (1)
Gregory mankiw macroeconomic 7th edition chapter  (1)Gregory mankiw macroeconomic 7th edition chapter  (1)
Gregory mankiw macroeconomic 7th edition chapter (1)
 
Functional forms in regression
Functional forms in regressionFunctional forms in regression
Functional forms in regression
 
Introduction to Econometrics
Introduction to EconometricsIntroduction to Econometrics
Introduction to Econometrics
 
cournot model
cournot modelcournot model
cournot model
 
Chapter 06 - Heteroskedasticity.pptx
Chapter 06 - Heteroskedasticity.pptxChapter 06 - Heteroskedasticity.pptx
Chapter 06 - Heteroskedasticity.pptx
 
Heteroscedasticity
HeteroscedasticityHeteroscedasticity
Heteroscedasticity
 
Macro i ch_1
Macro i ch_1Macro i ch_1
Macro i ch_1
 
Statistical Techniques in Business & Economics (McGRAV-HILL) 12 Edt. Chapter ...
Statistical Techniques in Business & Economics (McGRAV-HILL) 12 Edt. Chapter ...Statistical Techniques in Business & Economics (McGRAV-HILL) 12 Edt. Chapter ...
Statistical Techniques in Business & Economics (McGRAV-HILL) 12 Edt. Chapter ...
 
Chap19
Chap19Chap19
Chap19
 
Fiscal Policy MC & Essay Questions - A-Level Economics
Fiscal Policy MC & Essay Questions - A-Level EconomicsFiscal Policy MC & Essay Questions - A-Level Economics
Fiscal Policy MC & Essay Questions - A-Level Economics
 
Dummy variables
Dummy variablesDummy variables
Dummy variables
 
Eco Basic 1 8
Eco Basic 1 8Eco Basic 1 8
Eco Basic 1 8
 
Econometrics and statistics mcqs part 2
Econometrics and statistics mcqs part 2Econometrics and statistics mcqs part 2
Econometrics and statistics mcqs part 2
 
Multicollinearity
MulticollinearityMulticollinearity
Multicollinearity
 
Identification problem in simultaneous equations model
Identification problem in simultaneous equations modelIdentification problem in simultaneous equations model
Identification problem in simultaneous equations model
 

Viewers also liked

Heteroskedasticity
HeteroskedasticityHeteroskedasticity
Heteroskedasticity
halimuth
 
Multicolinearity
MulticolinearityMulticolinearity
Multicolinearity
Pawan Kawan
 
Multicollinearity
MulticollinearityMulticollinearity
Multicollinearity
modelos-econometricos
 
E views 6 users guide i
E views 6 users guide iE views 6 users guide i
E views 6 users guide i
Adi Irawan
 
isi
isiisi
isi
ahfdv
 
Oil Prices Modelling
Oil Prices ModellingOil Prices Modelling
Oil Prices Modelling
Hanan Naser
 
E views 7 student version
E views 7 student versionE views 7 student version
E views 7 student version
Hyun Bin Kim
 
Serial correlation
Serial correlationSerial correlation
Serial correlation
modelos-econometricos
 
Cours econométrie des séries temporelles (1)
Cours econométrie des séries temporelles (1)Cours econométrie des séries temporelles (1)
Cours econométrie des séries temporelles (1)
ABDELHAMID EL BOUHADI SIDI MOHAMED BEN ABDELLAH UNIVERSITY ENCG-FEZ
 
Chapter 2. Multivariate Analysis of Stationary Time Series
 Chapter 2. Multivariate Analysis of Stationary Time Series Chapter 2. Multivariate Analysis of Stationary Time Series
Chapter 2. Multivariate Analysis of Stationary Time Series
Chengjun Wang
 
20120140503019
2012014050301920120140503019
20120140503019
IAEME Publication
 
Problem set 4 - Statistics and Econometrics - Msc Business Analytics - Imperi...
Problem set 4 - Statistics and Econometrics - Msc Business Analytics - Imperi...Problem set 4 - Statistics and Econometrics - Msc Business Analytics - Imperi...
Problem set 4 - Statistics and Econometrics - Msc Business Analytics - Imperi...
Jonathan Zimmermann
 
Estimation de l'ecart de production et inflation dans la CEMAC
Estimation de l'ecart de production et inflation dans la CEMACEstimation de l'ecart de production et inflation dans la CEMAC
Estimation de l'ecart de production et inflation dans la CEMAC
Université de Dschang
 
Heteroscedasticity | Eonomics
Heteroscedasticity | EonomicsHeteroscedasticity | Eonomics
Heteroscedasticity | Eonomics
Transweb Global Inc
 
Use of R in Actuarial Works
Use of R in Actuarial WorksUse of R in Actuarial Works
Use of R in Actuarial Works
基晴 出井
 
gls
glsgls
Déterminants de l'inflation dans la CEMAC: le rôle de la monnaie
Déterminants de l'inflation dans la CEMAC: le rôle de la monnaieDéterminants de l'inflation dans la CEMAC: le rôle de la monnaie
Déterminants de l'inflation dans la CEMAC: le rôle de la monnaie
Université de Dschang
 
Calculating critical values of t distributions using tables of percentage points
Calculating critical values of t distributions using tables of percentage pointsCalculating critical values of t distributions using tables of percentage points
Calculating critical values of t distributions using tables of percentage points
modelos-econometricos
 
Autocorrelation
AutocorrelationAutocorrelation
Autocorrelation
Muhammad Ali
 
Econometrics theory and_applications_with_eviews
Econometrics theory and_applications_with_eviewsEconometrics theory and_applications_with_eviews
Econometrics theory and_applications_with_eviews
Deiven Jesus Palpa
 

Viewers also liked (20)

Heteroskedasticity
HeteroskedasticityHeteroskedasticity
Heteroskedasticity
 
Multicolinearity
MulticolinearityMulticolinearity
Multicolinearity
 
Multicollinearity
MulticollinearityMulticollinearity
Multicollinearity
 
E views 6 users guide i
E views 6 users guide iE views 6 users guide i
E views 6 users guide i
 
isi
isiisi
isi
 
Oil Prices Modelling
Oil Prices ModellingOil Prices Modelling
Oil Prices Modelling
 
E views 7 student version
E views 7 student versionE views 7 student version
E views 7 student version
 
Serial correlation
Serial correlationSerial correlation
Serial correlation
 
Cours econométrie des séries temporelles (1)
Cours econométrie des séries temporelles (1)Cours econométrie des séries temporelles (1)
Cours econométrie des séries temporelles (1)
 
Chapter 2. Multivariate Analysis of Stationary Time Series
 Chapter 2. Multivariate Analysis of Stationary Time Series Chapter 2. Multivariate Analysis of Stationary Time Series
Chapter 2. Multivariate Analysis of Stationary Time Series
 
20120140503019
2012014050301920120140503019
20120140503019
 
Problem set 4 - Statistics and Econometrics - Msc Business Analytics - Imperi...
Problem set 4 - Statistics and Econometrics - Msc Business Analytics - Imperi...Problem set 4 - Statistics and Econometrics - Msc Business Analytics - Imperi...
Problem set 4 - Statistics and Econometrics - Msc Business Analytics - Imperi...
 
Estimation de l'ecart de production et inflation dans la CEMAC
Estimation de l'ecart de production et inflation dans la CEMACEstimation de l'ecart de production et inflation dans la CEMAC
Estimation de l'ecart de production et inflation dans la CEMAC
 
Heteroscedasticity | Eonomics
Heteroscedasticity | EonomicsHeteroscedasticity | Eonomics
Heteroscedasticity | Eonomics
 
Use of R in Actuarial Works
Use of R in Actuarial WorksUse of R in Actuarial Works
Use of R in Actuarial Works
 
gls
glsgls
gls
 
Déterminants de l'inflation dans la CEMAC: le rôle de la monnaie
Déterminants de l'inflation dans la CEMAC: le rôle de la monnaieDéterminants de l'inflation dans la CEMAC: le rôle de la monnaie
Déterminants de l'inflation dans la CEMAC: le rôle de la monnaie
 
Calculating critical values of t distributions using tables of percentage points
Calculating critical values of t distributions using tables of percentage pointsCalculating critical values of t distributions using tables of percentage points
Calculating critical values of t distributions using tables of percentage points
 
Autocorrelation
AutocorrelationAutocorrelation
Autocorrelation
 
Econometrics theory and_applications_with_eviews
Econometrics theory and_applications_with_eviewsEconometrics theory and_applications_with_eviews
Econometrics theory and_applications_with_eviews
 

Similar to Heteroskedasticity

D-Pubb-TestingExperience_Issue_28_2014-12_Berta
D-Pubb-TestingExperience_Issue_28_2014-12_BertaD-Pubb-TestingExperience_Issue_28_2014-12_Berta
D-Pubb-TestingExperience_Issue_28_2014-12_Berta
Berta Danilo
 
Blackbox
BlackboxBlackbox
Blackbox
Oana Feidi
 
How to use statistica for rsm study
How to use statistica for rsm studyHow to use statistica for rsm study
How to use statistica for rsm study
Wan Nor Nadyaini Wan Omar
 
Spss & minitab
Spss & minitabSpss & minitab
Spss & minitab
asifusman1998
 
Fin 351Project 2Derivation of the Efficient Frontier Part .docx
Fin 351Project 2Derivation of the Efficient Frontier Part .docxFin 351Project 2Derivation of the Efficient Frontier Part .docx
Fin 351Project 2Derivation of the Efficient Frontier Part .docx
mydrynan
 
Looking for cooperation on working paper - Expenditure model
Looking for cooperation on working paper - Expenditure modelLooking for cooperation on working paper - Expenditure model
Looking for cooperation on working paper - Expenditure model
Miss. Antónia FICOVÁ, Engineer. (Not yet Dr.)
 
ANOVA, Chi-Square Tests, and RegressionComplete the followin.docx
ANOVA, Chi-Square Tests, and RegressionComplete the followin.docxANOVA, Chi-Square Tests, and RegressionComplete the followin.docx
ANOVA, Chi-Square Tests, and RegressionComplete the followin.docx
amrit47
 
Time series analysis use E-views programer
Time series analysis use E-views programerTime series analysis use E-views programer
Time series analysis use E-views programer
Al-Qadisiya University
 
Testing Fundamentals
Testing FundamentalsTesting Fundamentals
Testing Fundamentals
Kiran Kumar
 
Introduction to particle swarm optimization
Introduction to particle swarm optimizationIntroduction to particle swarm optimization
Introduction to particle swarm optimization
Mrinmoy Majumder
 
Introductory Statistics Laboratory for Excel .docx
Introductory Statistics Laboratory for Excel .docxIntroductory Statistics Laboratory for Excel .docx
Introductory Statistics Laboratory for Excel .docx
normanibarber20063
 
Multiple regression in spss
Multiple regression in spssMultiple regression in spss
Multiple regression in spss
Dr. Ravneet Kaur
 
Benefit cost ratio using ivhfs
Benefit cost ratio using ivhfsBenefit cost ratio using ivhfs
Benefit cost ratio using ivhfs
Israa' Ismail
 
IPI2win 2..pdf
IPI2win 2..pdfIPI2win 2..pdf
IPI2win 2..pdf
DrAsemAhmed
 
Multivariate time series
Multivariate time seriesMultivariate time series
Multivariate time series
Luigi Piva CQF
 
Test techniques
Test techniquesTest techniques
Test techniques
Oana Feidi
 
THE NEW HYBRID COAW METHOD FOR SOLVING MULTI-OBJECTIVE PROBLEMS
THE NEW HYBRID COAW METHOD FOR SOLVING MULTI-OBJECTIVE PROBLEMSTHE NEW HYBRID COAW METHOD FOR SOLVING MULTI-OBJECTIVE PROBLEMS
THE NEW HYBRID COAW METHOD FOR SOLVING MULTI-OBJECTIVE PROBLEMS
ijfcstjournal
 
ME401 Experimental Design Lab Report
ME401 Experimental Design Lab ReportME401 Experimental Design Lab Report
ME401 Experimental Design Lab Report
Kristopher Saladin
 
Turning Multivariable Models Into Interactive Animated Simulations
Turning Multivariable Models Into Interactive Animated SimulationsTurning Multivariable Models Into Interactive Animated Simulations
Turning Multivariable Models Into Interactive Animated Simulations
Tom Loughran
 
Decision table
Decision tableDecision table
Decision table
DMANIMALA
 

Similar to Heteroskedasticity (20)

D-Pubb-TestingExperience_Issue_28_2014-12_Berta
D-Pubb-TestingExperience_Issue_28_2014-12_BertaD-Pubb-TestingExperience_Issue_28_2014-12_Berta
D-Pubb-TestingExperience_Issue_28_2014-12_Berta
 
Blackbox
BlackboxBlackbox
Blackbox
 
How to use statistica for rsm study
How to use statistica for rsm studyHow to use statistica for rsm study
How to use statistica for rsm study
 
Spss & minitab
Spss & minitabSpss & minitab
Spss & minitab
 
Fin 351Project 2Derivation of the Efficient Frontier Part .docx
Fin 351Project 2Derivation of the Efficient Frontier Part .docxFin 351Project 2Derivation of the Efficient Frontier Part .docx
Fin 351Project 2Derivation of the Efficient Frontier Part .docx
 
Looking for cooperation on working paper - Expenditure model
Looking for cooperation on working paper - Expenditure modelLooking for cooperation on working paper - Expenditure model
Looking for cooperation on working paper - Expenditure model
 
ANOVA, Chi-Square Tests, and RegressionComplete the followin.docx
ANOVA, Chi-Square Tests, and RegressionComplete the followin.docxANOVA, Chi-Square Tests, and RegressionComplete the followin.docx
ANOVA, Chi-Square Tests, and RegressionComplete the followin.docx
 
Time series analysis use E-views programer
Time series analysis use E-views programerTime series analysis use E-views programer
Time series analysis use E-views programer
 
Testing Fundamentals
Testing FundamentalsTesting Fundamentals
Testing Fundamentals
 
Introduction to particle swarm optimization
Introduction to particle swarm optimizationIntroduction to particle swarm optimization
Introduction to particle swarm optimization
 
Introductory Statistics Laboratory for Excel .docx
Introductory Statistics Laboratory for Excel .docxIntroductory Statistics Laboratory for Excel .docx
Introductory Statistics Laboratory for Excel .docx
 
Multiple regression in spss
Multiple regression in spssMultiple regression in spss
Multiple regression in spss
 
Benefit cost ratio using ivhfs
Benefit cost ratio using ivhfsBenefit cost ratio using ivhfs
Benefit cost ratio using ivhfs
 
IPI2win 2..pdf
IPI2win 2..pdfIPI2win 2..pdf
IPI2win 2..pdf
 
Multivariate time series
Multivariate time seriesMultivariate time series
Multivariate time series
 
Test techniques
Test techniquesTest techniques
Test techniques
 
THE NEW HYBRID COAW METHOD FOR SOLVING MULTI-OBJECTIVE PROBLEMS
THE NEW HYBRID COAW METHOD FOR SOLVING MULTI-OBJECTIVE PROBLEMSTHE NEW HYBRID COAW METHOD FOR SOLVING MULTI-OBJECTIVE PROBLEMS
THE NEW HYBRID COAW METHOD FOR SOLVING MULTI-OBJECTIVE PROBLEMS
 
ME401 Experimental Design Lab Report
ME401 Experimental Design Lab ReportME401 Experimental Design Lab Report
ME401 Experimental Design Lab Report
 
Turning Multivariable Models Into Interactive Animated Simulations
Turning Multivariable Models Into Interactive Animated SimulationsTurning Multivariable Models Into Interactive Animated Simulations
Turning Multivariable Models Into Interactive Animated Simulations
 
Decision table
Decision tableDecision table
Decision table
 

More from modelos-econometricos

A guide to hypothesis testing
A guide to hypothesis testingA guide to hypothesis testing
A guide to hypothesis testing
modelos-econometricos
 
Tutorial eviews (normalidad)
Tutorial eviews (normalidad)Tutorial eviews (normalidad)
Tutorial eviews (normalidad)
modelos-econometricos
 
Eviews 2
Eviews 2Eviews 2
Eviews II
Eviews IIEviews II
Diseño de modelos econométricos
Diseño de modelos econométricosDiseño de modelos econométricos
Diseño de modelos econométricos
modelos-econometricos
 
Violación de los supuestos del mcrln (autocorrelación)
Violación de los supuestos del mcrln (autocorrelación)Violación de los supuestos del mcrln (autocorrelación)
Violación de los supuestos del mcrln (autocorrelación)
modelos-econometricos
 
Violación de los supuestos del mcrln (heteroscedasticidad)
Violación de los supuestos del mcrln (heteroscedasticidad)Violación de los supuestos del mcrln (heteroscedasticidad)
Violación de los supuestos del mcrln (heteroscedasticidad)
modelos-econometricos
 
Violación de los supuestos del mcrln (multicolinealidad)
Violación de los supuestos del mcrln (multicolinealidad)Violación de los supuestos del mcrln (multicolinealidad)
Violación de los supuestos del mcrln (multicolinealidad)
modelos-econometricos
 
Inferencia con modelos multivariados
Inferencia con modelos multivariadosInferencia con modelos multivariados
Inferencia con modelos multivariadosmodelos-econometricos
 
Estimación de modelos multivariados
Estimación de modelos multivariadosEstimación de modelos multivariados
Estimación de modelos multivariados
modelos-econometricos
 
Formas funcionales de los modelos de regresión
Formas funcionales de los modelos de regresiónFormas funcionales de los modelos de regresión
Formas funcionales de los modelos de regresión
modelos-econometricos
 
Estimación de intervalos y prueba de hipótesis con modelos bivariados
Estimación de intervalos y prueba de hipótesis con modelos bivariadosEstimación de intervalos y prueba de hipótesis con modelos bivariados
Estimación de intervalos y prueba de hipótesis con modelos bivariados
modelos-econometricos
 
Modelo clásico de regresión lineal normal (mcrln)
Modelo clásico de regresión lineal normal (mcrln)Modelo clásico de regresión lineal normal (mcrln)
Modelo clásico de regresión lineal normal (mcrln)modelos-econometricos
 
Introducción al análisis de regresión bivariado
Introducción al análisis de regresión bivariadoIntroducción al análisis de regresión bivariado
Introducción al análisis de regresión bivariado
modelos-econometricos
 
Naturaleza del análisis de regresión
Naturaleza del análisis de regresiónNaturaleza del análisis de regresión
Naturaleza del análisis de regresión
modelos-econometricos
 
Introducción a la econometría
Introducción a la econometríaIntroducción a la econometría
Introducción a la econometría
modelos-econometricos
 

More from modelos-econometricos (18)

A guide to hypothesis testing
A guide to hypothesis testingA guide to hypothesis testing
A guide to hypothesis testing
 
Estadísticas (931 a 947)
Estadísticas (931 a 947)Estadísticas (931 a 947)
Estadísticas (931 a 947)
 
Tutorial eviews (normalidad)
Tutorial eviews (normalidad)Tutorial eviews (normalidad)
Tutorial eviews (normalidad)
 
Eviews 2
Eviews 2Eviews 2
Eviews 2
 
Eviews II
Eviews IIEviews II
Eviews II
 
Diseño de modelos econométricos
Diseño de modelos econométricosDiseño de modelos econométricos
Diseño de modelos econométricos
 
Violación de los supuestos del mcrln (autocorrelación)
Violación de los supuestos del mcrln (autocorrelación)Violación de los supuestos del mcrln (autocorrelación)
Violación de los supuestos del mcrln (autocorrelación)
 
Violación de los supuestos del mcrln (heteroscedasticidad)
Violación de los supuestos del mcrln (heteroscedasticidad)Violación de los supuestos del mcrln (heteroscedasticidad)
Violación de los supuestos del mcrln (heteroscedasticidad)
 
Violación de los supuestos del mcrln (multicolinealidad)
Violación de los supuestos del mcrln (multicolinealidad)Violación de los supuestos del mcrln (multicolinealidad)
Violación de los supuestos del mcrln (multicolinealidad)
 
Inferencia con modelos multivariados
Inferencia con modelos multivariadosInferencia con modelos multivariados
Inferencia con modelos multivariados
 
Estimación de modelos multivariados
Estimación de modelos multivariadosEstimación de modelos multivariados
Estimación de modelos multivariados
 
Formas funcionales de los modelos de regresión
Formas funcionales de los modelos de regresiónFormas funcionales de los modelos de regresión
Formas funcionales de los modelos de regresión
 
Estimación de intervalos y prueba de hipótesis con modelos bivariados
Estimación de intervalos y prueba de hipótesis con modelos bivariadosEstimación de intervalos y prueba de hipótesis con modelos bivariados
Estimación de intervalos y prueba de hipótesis con modelos bivariados
 
Modelo clásico de regresión lineal normal (mcrln)
Modelo clásico de regresión lineal normal (mcrln)Modelo clásico de regresión lineal normal (mcrln)
Modelo clásico de regresión lineal normal (mcrln)
 
Estimación de modelos bivariados
Estimación de modelos bivariadosEstimación de modelos bivariados
Estimación de modelos bivariados
 
Introducción al análisis de regresión bivariado
Introducción al análisis de regresión bivariadoIntroducción al análisis de regresión bivariado
Introducción al análisis de regresión bivariado
 
Naturaleza del análisis de regresión
Naturaleza del análisis de regresiónNaturaleza del análisis de regresión
Naturaleza del análisis de regresión
 
Introducción a la econometría
Introducción a la econometríaIntroducción a la econometría
Introducción a la econometría
 

Recently uploaded

Goodbye Windows 11: Make Way for Nitrux Linux 3.5.0!
Goodbye Windows 11: Make Way for Nitrux Linux 3.5.0!Goodbye Windows 11: Make Way for Nitrux Linux 3.5.0!
Goodbye Windows 11: Make Way for Nitrux Linux 3.5.0!
SOFTTECHHUB
 
A tale of scale & speed: How the US Navy is enabling software delivery from l...
A tale of scale & speed: How the US Navy is enabling software delivery from l...A tale of scale & speed: How the US Navy is enabling software delivery from l...
A tale of scale & speed: How the US Navy is enabling software delivery from l...
sonjaschweigert1
 
Artificial Intelligence for XMLDevelopment
Artificial Intelligence for XMLDevelopmentArtificial Intelligence for XMLDevelopment
Artificial Intelligence for XMLDevelopment
Octavian Nadolu
 
PCI PIN Basics Webinar from the Controlcase Team
PCI PIN Basics Webinar from the Controlcase TeamPCI PIN Basics Webinar from the Controlcase Team
PCI PIN Basics Webinar from the Controlcase Team
ControlCase
 
How to use Firebase Data Connect For Flutter
How to use Firebase Data Connect For FlutterHow to use Firebase Data Connect For Flutter
How to use Firebase Data Connect For Flutter
Daiki Mogmet Ito
 
National Security Agency - NSA mobile device best practices
National Security Agency - NSA mobile device best practicesNational Security Agency - NSA mobile device best practices
National Security Agency - NSA mobile device best practices
Quotidiano Piemontese
 
Essentials of Automations: The Art of Triggers and Actions in FME
Essentials of Automations: The Art of Triggers and Actions in FMEEssentials of Automations: The Art of Triggers and Actions in FME
Essentials of Automations: The Art of Triggers and Actions in FME
Safe Software
 
Data structures and Algorithms in Python.pdf
Data structures and Algorithms in Python.pdfData structures and Algorithms in Python.pdf
Data structures and Algorithms in Python.pdf
TIPNGVN2
 
How to Get CNIC Information System with Paksim Ga.pptx
How to Get CNIC Information System with Paksim Ga.pptxHow to Get CNIC Information System with Paksim Ga.pptx
How to Get CNIC Information System with Paksim Ga.pptx
danishmna97
 
Unlock the Future of Search with MongoDB Atlas_ Vector Search Unleashed.pdf
Unlock the Future of Search with MongoDB Atlas_ Vector Search Unleashed.pdfUnlock the Future of Search with MongoDB Atlas_ Vector Search Unleashed.pdf
Unlock the Future of Search with MongoDB Atlas_ Vector Search Unleashed.pdf
Malak Abu Hammad
 
みなさんこんにちはこれ何文字まで入るの?40文字以下不可とか本当に意味わからないけどこれ限界文字数書いてないからマジでやばい文字数いけるんじゃないの?えこ...
みなさんこんにちはこれ何文字まで入るの?40文字以下不可とか本当に意味わからないけどこれ限界文字数書いてないからマジでやばい文字数いけるんじゃないの?えこ...みなさんこんにちはこれ何文字まで入るの?40文字以下不可とか本当に意味わからないけどこれ限界文字数書いてないからマジでやばい文字数いけるんじゃないの?えこ...
みなさんこんにちはこれ何文字まで入るの?40文字以下不可とか本当に意味わからないけどこれ限界文字数書いてないからマジでやばい文字数いけるんじゃないの?えこ...
名前 です男
 
“I’m still / I’m still / Chaining from the Block”
“I’m still / I’m still / Chaining from the Block”“I’m still / I’m still / Chaining from the Block”
“I’m still / I’m still / Chaining from the Block”
Claudio Di Ciccio
 
Microsoft - Power Platform_G.Aspiotis.pdf
Microsoft - Power Platform_G.Aspiotis.pdfMicrosoft - Power Platform_G.Aspiotis.pdf
Microsoft - Power Platform_G.Aspiotis.pdf
Uni Systems S.M.S.A.
 
20 Comprehensive Checklist of Designing and Developing a Website
20 Comprehensive Checklist of Designing and Developing a Website20 Comprehensive Checklist of Designing and Developing a Website
20 Comprehensive Checklist of Designing and Developing a Website
Pixlogix Infotech
 
Monitoring Java Application Security with JDK Tools and JFR Events
Monitoring Java Application Security with JDK Tools and JFR EventsMonitoring Java Application Security with JDK Tools and JFR Events
Monitoring Java Application Security with JDK Tools and JFR Events
Ana-Maria Mihalceanu
 
Cosa hanno in comune un mattoncino Lego e la backdoor XZ?
Cosa hanno in comune un mattoncino Lego e la backdoor XZ?Cosa hanno in comune un mattoncino Lego e la backdoor XZ?
Cosa hanno in comune un mattoncino Lego e la backdoor XZ?
Speck&Tech
 
UiPath Test Automation using UiPath Test Suite series, part 6
UiPath Test Automation using UiPath Test Suite series, part 6UiPath Test Automation using UiPath Test Suite series, part 6
UiPath Test Automation using UiPath Test Suite series, part 6
DianaGray10
 
Enchancing adoption of Open Source Libraries. A case study on Albumentations.AI
Enchancing adoption of Open Source Libraries. A case study on Albumentations.AIEnchancing adoption of Open Source Libraries. A case study on Albumentations.AI
Enchancing adoption of Open Source Libraries. A case study on Albumentations.AI
Vladimir Iglovikov, Ph.D.
 
Uni Systems Copilot event_05062024_C.Vlachos.pdf
Uni Systems Copilot event_05062024_C.Vlachos.pdfUni Systems Copilot event_05062024_C.Vlachos.pdf
Uni Systems Copilot event_05062024_C.Vlachos.pdf
Uni Systems S.M.S.A.
 
20240607 QFM018 Elixir Reading List May 2024
20240607 QFM018 Elixir Reading List May 202420240607 QFM018 Elixir Reading List May 2024
20240607 QFM018 Elixir Reading List May 2024
Matthew Sinclair
 

Recently uploaded (20)

Goodbye Windows 11: Make Way for Nitrux Linux 3.5.0!
Goodbye Windows 11: Make Way for Nitrux Linux 3.5.0!Goodbye Windows 11: Make Way for Nitrux Linux 3.5.0!
Goodbye Windows 11: Make Way for Nitrux Linux 3.5.0!
 
A tale of scale & speed: How the US Navy is enabling software delivery from l...
A tale of scale & speed: How the US Navy is enabling software delivery from l...A tale of scale & speed: How the US Navy is enabling software delivery from l...
A tale of scale & speed: How the US Navy is enabling software delivery from l...
 
Artificial Intelligence for XMLDevelopment
Artificial Intelligence for XMLDevelopmentArtificial Intelligence for XMLDevelopment
Artificial Intelligence for XMLDevelopment
 
PCI PIN Basics Webinar from the Controlcase Team
PCI PIN Basics Webinar from the Controlcase TeamPCI PIN Basics Webinar from the Controlcase Team
PCI PIN Basics Webinar from the Controlcase Team
 
How to use Firebase Data Connect For Flutter
How to use Firebase Data Connect For FlutterHow to use Firebase Data Connect For Flutter
How to use Firebase Data Connect For Flutter
 
National Security Agency - NSA mobile device best practices
National Security Agency - NSA mobile device best practicesNational Security Agency - NSA mobile device best practices
National Security Agency - NSA mobile device best practices
 
Essentials of Automations: The Art of Triggers and Actions in FME
Essentials of Automations: The Art of Triggers and Actions in FMEEssentials of Automations: The Art of Triggers and Actions in FME
Essentials of Automations: The Art of Triggers and Actions in FME
 
Data structures and Algorithms in Python.pdf
Data structures and Algorithms in Python.pdfData structures and Algorithms in Python.pdf
Data structures and Algorithms in Python.pdf
 
How to Get CNIC Information System with Paksim Ga.pptx
How to Get CNIC Information System with Paksim Ga.pptxHow to Get CNIC Information System with Paksim Ga.pptx
How to Get CNIC Information System with Paksim Ga.pptx
 
Unlock the Future of Search with MongoDB Atlas_ Vector Search Unleashed.pdf
Unlock the Future of Search with MongoDB Atlas_ Vector Search Unleashed.pdfUnlock the Future of Search with MongoDB Atlas_ Vector Search Unleashed.pdf
Unlock the Future of Search with MongoDB Atlas_ Vector Search Unleashed.pdf
 
みなさんこんにちはこれ何文字まで入るの?40文字以下不可とか本当に意味わからないけどこれ限界文字数書いてないからマジでやばい文字数いけるんじゃないの?えこ...
みなさんこんにちはこれ何文字まで入るの?40文字以下不可とか本当に意味わからないけどこれ限界文字数書いてないからマジでやばい文字数いけるんじゃないの?えこ...みなさんこんにちはこれ何文字まで入るの?40文字以下不可とか本当に意味わからないけどこれ限界文字数書いてないからマジでやばい文字数いけるんじゃないの?えこ...
みなさんこんにちはこれ何文字まで入るの?40文字以下不可とか本当に意味わからないけどこれ限界文字数書いてないからマジでやばい文字数いけるんじゃないの?えこ...
 
“I’m still / I’m still / Chaining from the Block”
“I’m still / I’m still / Chaining from the Block”“I’m still / I’m still / Chaining from the Block”
“I’m still / I’m still / Chaining from the Block”
 
Microsoft - Power Platform_G.Aspiotis.pdf
Microsoft - Power Platform_G.Aspiotis.pdfMicrosoft - Power Platform_G.Aspiotis.pdf
Microsoft - Power Platform_G.Aspiotis.pdf
 
20 Comprehensive Checklist of Designing and Developing a Website
20 Comprehensive Checklist of Designing and Developing a Website20 Comprehensive Checklist of Designing and Developing a Website
20 Comprehensive Checklist of Designing and Developing a Website
 
Monitoring Java Application Security with JDK Tools and JFR Events
Monitoring Java Application Security with JDK Tools and JFR EventsMonitoring Java Application Security with JDK Tools and JFR Events
Monitoring Java Application Security with JDK Tools and JFR Events
 
Cosa hanno in comune un mattoncino Lego e la backdoor XZ?
Cosa hanno in comune un mattoncino Lego e la backdoor XZ?Cosa hanno in comune un mattoncino Lego e la backdoor XZ?
Cosa hanno in comune un mattoncino Lego e la backdoor XZ?
 
UiPath Test Automation using UiPath Test Suite series, part 6
UiPath Test Automation using UiPath Test Suite series, part 6UiPath Test Automation using UiPath Test Suite series, part 6
UiPath Test Automation using UiPath Test Suite series, part 6
 
Enchancing adoption of Open Source Libraries. A case study on Albumentations.AI
Enchancing adoption of Open Source Libraries. A case study on Albumentations.AIEnchancing adoption of Open Source Libraries. A case study on Albumentations.AI
Enchancing adoption of Open Source Libraries. A case study on Albumentations.AI
 
Uni Systems Copilot event_05062024_C.Vlachos.pdf
Uni Systems Copilot event_05062024_C.Vlachos.pdfUni Systems Copilot event_05062024_C.Vlachos.pdf
Uni Systems Copilot event_05062024_C.Vlachos.pdf
 
20240607 QFM018 Elixir Reading List May 2024
20240607 QFM018 Elixir Reading List May 202420240607 QFM018 Elixir Reading List May 2024
20240607 QFM018 Elixir Reading List May 2024
 

Heteroskedasticity

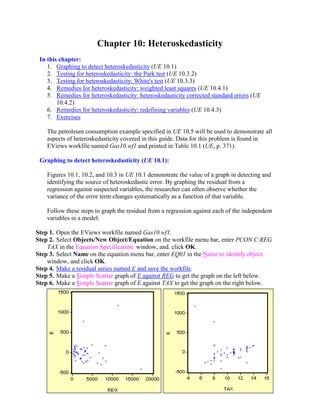
  • 1. Chapter 10: Heteroskedasticity In this chapter: 1. Graphing to detect heteroskedasticity (UE 10.1) 2. Testing for heteroskedasticity: the Park test (UE 10.3.2) 3. Testing for heteroskedasticity: White's test (UE 10.3.3) 4. Remedies for heteroskedasticity: weighted least squares (UE 10.4.1) 5. Remedies for heteroskedasticity: heteroskedasticity corrected standard errors (UE 10.4.2) 6. Remedies for heteroskedasticity: redefining variables (UE 10.4.3) 7. Exercises The petroleum consumption example specified in UE 10.5 will be used to demonstrate all aspects of heteroskedasticity covered in this guide. Data for this problem is found in EViews workfile named Gas10.wf1 and printed in Table 10.1 (UE, p. 371). Graphing to detect heteroskedasticity (UE 10.1): Figures 10.1, 10.2, and 10.3 in UE 10.1 demonstrate the value of a graph in detecting and identifying the source of heteroskedastic error. By graphing the residual from a regression against suspected variables, the researcher can often observe whether the variance of the error term changes systematically as a function of that variable. Follow these steps to graph the residual from a regression against each of the independent variables in a model: Step 1. Open the EViews workfile named Gas10.wf1. Step 2. Select Objects/New Object/Equation on the workfile menu bar, enter PCON C REG TAX in the Equation Specification: window, and. click OK. Step 3. Select Name on the equation menu bar, enter EQ01 in the Name to identify object: window, and click OK. Step 4. Make a residual series named E and save the workfile. Step 5. Make a Simple Scatter graph of E against REG to get the graph on the left below. Step 6. Make a Simple Scatter graph of E against TAX to get the graph on the right below.
  • 2. Testing for heteroskedasticity: the Park test (UE 10.3.2): Complete Steps 1-3 of the section entitled Graphing to detect heteroskedasticity before attempting this section. Follow these steps to complete the Park test for heteroskedasticity: Step 1. Open the EViews workfile named Gas10.wf1. Step 2. Select Objects/New Object/Equation on the workfile menu bar, enter log(E^2) C log(REG) in the Equation Specification: window, and click OK to reveal the EViews output on the right. Step 3. Test the significance of the coefficient on log(REG). Testing for heteroskedasticity: White's test (UE 10.3.3 & UE, Equation 10.12): Complete Steps 1-3 of the section entitled Graphing to detect heteroskedasticity before attempting this section. Follow these steps to complete White's test for heteroskedasticity: Step 1. Open the EViews workfile named Gas10.wf1. Step 2. Select Objects/New Object/Equation on the workfile menu bar and enter PCON C REG TAX in the Equation Specification: window. Click OK. Step 3. To carry out White’s heteroskedasticity test for the regression in Step 2, select View/Residual Tests/White Heteroskedasticity (cross terms) to get the output on the right. EViews reports two test statistics from the test regression. The Obs*R- squared statistic highlighted in yellow and boxed in red, is White’s test statistic. It is computed as the number of
  • 3. observations (n) times the R2 from the test regression. White’s test statistic is asymptotically distributed as a χ2 with degrees of freedom equal to the number of slope coefficients, excluding the constant, in the test regression (five in this example). Step 4. The critical χ2 value can be calculated in EViews by typing the following formula in the EViews command window: =@qchisq(.95,5).1 After typing the formula and hitting Enter on the keyboard, appears in the lower left of the EViews screen (the same value found in UE, Table B-8). Since the nR2 value of 33.2256393731 is greater than the 5% critical χ2 value of 11.0704976935, we can reject the null hypothesis of no heteroskedasticity. The probability printed to the right of the nR2 value in the EViews output for White’s heteroskedasticity test (i.e., 0.000003) represents the probability that you would be incorrect if you rejected the null hypothesis of no heteroskedasticity.2 The F-statistic is an omitted variable test for the joint significance of all cross products, excluding the constant. It is printed above White's test statistic for comparison purposes. Remedies for heteroskedasticity: weighted least squares (UE 10.4.1): Follow these steps to estimate the weighted least squares using REG as the proportionality factor: Step 1. Open the EViews workfile named Gas10.wf1. Step 2. Select Objects/New Object/Equation on the workfile menu bar, enter PCON/REG 1/REG REG/REG TAX/REG in the Equation Specification: window, and click OK. Note the coefficients highlighted in yellow. 1 c=@qchisq(p,v) calculates the percentile of the χ2 distribution . The formula finds the value c such that the prob(χ2 with v degrees of freedom is ≤ c) = p. In this case, the prob(χ2 with 5 degrees of freedom is ≤ 11.0704976935) =95%. In other words, 95% of the area of a χ2 distribution, with v=5 degrees of freedom, is in the range from 0 to 11.0704976935 and 5% is in the range from 11.0704976935 to ∞ (in the tail). 2 The probability value is calculated with the formula =@chisq(x,v), which returns the probability that a chi-squared statistic with v degrees of freedom exceeds x. To verify this, type the formula =@chisq(33.2256393731,5) in the EViews command window and read the value of 3.39442964858e-06 on the lower left of the EViews screen.
  • 4. Step 3. Select Objects/New Object/Equation on the workfile menu bar and enter PCON C REG TAX in the Equation Specification: window, and select the O Options button (see the arrow pointing toward the red box area in the graphic on the right). Step 4. Check the Weighted LS/TSLS box and enter 1/REG in the Weight: window (see the yellow highlighted and red boxed areas in the graphic on the right). Step 5. Select OK to accept the options and select OK again to estimate the equation. Note that the weighted least squares coefficients found in Step 2 are the same as the coefficients found in Step 5 using the EViews weighted least squares option.3 3 EViews performs weighted least squares by first dividing the weight series by its mean, then multiplying all of the data for each observation by the scaled weight series. The scaling of the weight series is a normalization that has no effect on the parameter results, but makes the weighted residuals more comparable to the un-weighted residuals. The normalization does imply, however, that EViews weighted least squares is not appropriate in situations where the scale of the weight series is relevant, as in frequency weighting.
  • 5. Remedies for heteroskedasticity: heteroskedasticity corrected standard errors (UE 10.4.2): Follow these steps to estimate heteroskedasticity corrected standard errors regression: Step 1. Open the EViews workfile named Gas10.wf1. Step 2. Select Objects/New Object/Equation on the workfile menu bar and enter PCON C REG TAX in the Equation Specification: window, and select the O Options button. Step 3. Check the Heteroskedasticity Consistent Covariances (White) box (see the yellow highlighted and red boxed areas in the graphic on the right). Step 4. Select OK to accept the options and select OK again to estimate the equation. Step 5. Compare the Estimation Output from the regression with the Heteroskedasticity Consistent Covariance on the lower left with the Estimation Output from the uncorrected OLS regression on the lower right (EQ01). Note that the coefficients are the same but the uncorrected std. error is smaller. This means that the Heteroskedasticity Consistent Covariance correction has reduced the size of the t-statistics for the coefficients, a typical result. However, in this case both of the slope coefficients remain significant at the 5% level but the TAX variable coefficient is no longer significant at the 1% level.
  • 6. Remedies for heteroskedasticity: redefining variables (UE 10.4.3): Follow these steps to estimate UE, Equation 10.30, p. 374: Step 1. Open the EViews workfile named Gas10.wf1. Step 2. Select Objects/New Object/Equation on the workfile menu bar, enter PCON/POP C REG/POP TAX in the Equation Specification: window, and click OK. Exercises: 5. Create an EViews workfile and enter the average income and average consumption data from the table printed in Exercise 5, p.378. a. Refer to Testing for heteroskedasticity: the Park test. b. Refer to Testing for heteroskedasticity: the Park test. c. d. Refer to Remedies for heteroskedasticity: heteroskedasticity corrected standard errors. 9. Open the EViews file named Books10.wf1. a. b. c. Refer to Testing for heteroskedasticity: the Park test and Testing for heteroskedasticity: White's test. d. Refer to Remedies for heteroskedasticity: weighted least squares. e. Refer to Remedies for heteroskedasticity: heteroskedasticity corrected standard errors or Remedies for heteroskedasticity: redefining variables. 15. Open the EViews file named Bid10.wf1. a. Refer to Estimate a multiple regression model using EViews and Serial Correlation (Chapter 9). b. Refer to Serial Correlation (Chapter 9). c. d. Refer to Testing for heteroskedasticity: the Park test and Testing for heteroskedasticity: White's test. e. Refer to Testing for heteroskedasticity: the Park test and Testing for heteroskedasticity: White's test. f.