SlideShare a Scribd company logo
Author: Antonia Ficova
Possible title: ESTIMATING THE IMPACT OF PUBLIC FINANCE FOR THE
COUNTRIES OF EUROZONE: EXPENDITURE MODEL
Introduction, - research metodology, research onjectives, goal
Main Body, about: previous research,
Key words – expenditure in context of gross debt, inflation, growth rate – Eurozone
countries
Methodology: by using Eviews – MLS, Scatter Graphs, Heteroskedasticity: The Park
Test, White test
Source of Data: Eurostat (2002-2013)
------------------------------------
4 Expenditure Model
At this section we use method of least squares (MLS) by using economic software Eviews for
examination observed variables (216) since 2002 to 2013 at 95 percent of probability, that
include: General government gross debt (% of GDP); HICP - inflation rate; Investment (% of
GDP), Real GDP growth rate - volume of observed countries of Eurozone. Countries include:
Austria, Belgium, Cyprus, Estonia, Finland, France, Germany, Greece, Ireland, Italy, Latvia,
Luxembourg, Malta, Netherlands, Portugal, Slovakia, Slovenia, Spain. We examine impact of
variables that were mentioned above on investments (% of GDP).
According to the results from Expenditure Model bellow, N=216, k=4; shows that
coefficient of determination increased in comparisom with previous model; R2=0.488
indicates that 48,89% changes of total general government expenditure in countries of
Eurozone is being explained by changes in variables that were mentioned above, on the other
hand 51.11% could be caused by variables that are not included in this model. Prob (F-
statistic) is 0.000 < 0.01; that means model is high statistically significant (++). For N = 216,
k = 4, and significant level = 5%, the significant Durbin-Waston statistic dL is 1.745 and dU
is 1.803; 4-0.642=3.358, moreover a value toward 4 indicates negative autocorrelation.
Table 6 Expenditure
Dependent Variable: EXPENDITURE
Method: Least Squares
Sample: 1 216
Included observations:216
Variable Coefficient Std. Error t-Statistic Prob.
GROSS DEBT 0.070 0.011 6.000 0.000
INFLATION RATE -0.529 0.166 -3.179 0.001
INVESTMENT OF GDP -0.617 0.348 -1.769 0.078
REAL GDP GROWTH RATE -0.462 0.089 -5.148 0.000
C 45.318 1.639 27.635 0.000
R-squared 0.488 Mean dependent var 45.632
Adjusted R-squared 0.479 S.D. dependent var 6.137
S.E. of regression 4.428 Akaike info criterion 5.837
Sum squared resid 4138.796 Schwarz criterion 5.915
Log likelihood -625.402 F-statistic 50.474
Durbin-Watson stat 0.642 Prob(F-statistic) 0.000
Source: Author´s estimation by using Eviews
In this model, as is shown in Table above, we get estimation equation as follows:
Expenditure = β0 + β1*debt - β2*inflation rate - β3*investment - β4*growth rate
Than we get following formula:
Expenditure = 45.318 + 0.070*debt - 0.529*inflation rate - 0.617*investment - 0.462*growth
rate
Relations between variables are illustrated by scatter graphs as follows. Moreover, a
positive correlation is between debt and expenditure, on the other hand is negative correlation
between growth rate and expenditure.
Figure 5-8 Simple Scatter Graph of observed variables in Expenditure Model
Source: Author´s estimation by using Eviews.
* Note: The data is displayed as a collection of points, each having the value of one variable determining the
position on the horizontal axis and the value of the other variable determining the position on the vertical axis. If
the pattern of dots slopes from lower left to upper right, it suggests a positive correlation between the variables
being studied, e. g. debt to expenditure. If the pattern of dots slopes from upper left to lower right, it suggests a
negative correlation, e.g. growth rate to expenditure.
4.1 Testing for heteroskedasticity
4.1.1 The Park Test
At this point, we use Park test for estimating linear regression parameters in the presence of
heteroscedastic error terms. As were mentioned in previous model, first we take formula from
regression analysis (OLS):
Yi = β0 + β1X1i + β2X2i + εi; (6)
Expenditure = β0 + β1*debt - β2*inflation rate - β3*investment - β4*growth rate+ εi.
Second, we collect the residuals ei and get following table the auxiliary regression as follows:
LOG(RESID02^2) = -22.450 - 0.256*LOG(inflation rate) + 0.924* LOG(debt) - 3.194
*LOG(expenditure)+ 6.947*LOG(employment)
Than we formulate hypothesis as follows:
H0: There is homoscedasticity; var(εi)=(σ)2
H1: There is heteroscedasticity; var(εi)=(σi)2
Table 7 Park Test
Dependent Variable: LOG(RESID03^2)
Method: Least Squares
Sample (adjusted): 1 214
Included observations:157 after adjustments
Variable Coefficient Std. Error t-Statistic Prob.
C 3.381 1.495 2.261 0.025
LOG(debt) -0.238 0.284 -0.837 0.403
LOG(inflation rate) -0.603 0.320 -1.883 0.061
LOG(investment) -0.450 0.504 -0.894 0.372
LOG(growth rate) 0.107 0.226 0.474 0.635
R-squared 0.032 Mean dependent var 1.586
Adjusted R-squared 0.006 S.D. dependent var 2.243
S.E. of regression 2.235 Akaike info criterion 4.478
Sum squared resid 759.939 Schwarz criterion 4.575
Log likelihood -346.567 F-statistic 1.262
Durbin-Watson stat 0.855 Prob(F-statistic) 0.287
Source: Author´s estimation by using Eviews.
According to the results from Table above Park test show that t-Statistics (Park-t) is not larger
than 2 of the regressors Xi (the thumb than critical t), therefore we accept H0. The model
confirmed Homoscedasticity.
4.1.2 White test of Expenditure Model
We use this test for estimation of heteroscedasticity of the model. We formulate hypothesis as
follows:
H0: There is homoscedasticity; var(εi)=(σ)2
H1: There is heteroscedasticity; var(εi)=(σi)2
The Lagrange multiplier (LM) test statistic is the product of the R2 value and sample size:
LM = n . R2 (7)
In our case LM= 216*0.118= 25.583
Moreover, the squared residuals from the original model serve as a proxy for the variance of
the error term at each observation. We use formula from regression analysis (OLS) and take
White Heteroscedasticity (cross terms) as follows:
Table 8 White Heteroskedasticity Test
F-statistic 1.928 Probability 0.025
Obs*R-squared 25.583 Probability 0.029
Test Equation:
Dependent Variable: RESID^2
Method: Least Squares
Date: 10/25/14 Time: 18:14
Sample: 1 216
Included observations:216
Variable Coefficient Std. Error t-Statistic Prob.
C -17.771 42.586 -0.417 0.676
GROSS DEBT 0.367 0.604 0.606 0.544
GROSS DEBT^2 -0.002 0.002 -0.876 0.381
GROSS DEBT*INFLATION_RATE -0.104 0.054 -1.908 0.057
GROSS DEBT*INVESTMENT 0.036 0.112 0.329 0.742
GROSS DEBT*GROWTH RATE -0.015 0.023 -0.644 0.520
INFLATION RATE 5.496 7.407 0.741 0.459
INFLATION RATE^2 0.031 0.256 0.124 0.900
INFLATION RATE*INVESTMENT -0.814 1.470 -0.553 0.580
INFLATION RATE*GROWTH RATE -0.339 0.258 -1.312 0.190
INVESTMENT 22.491 17.616 1.276 0.203
INVESTMENT^2 -4.152 2.203 -1.884 0.060
INVESTMENT*GROWTH RATE 0.458 0.781 0.586 0.557
GROWTH RATE -0.771 3.460 -0.222 0.823
GROWTH RATE^2 0.116 0.083 1.396 0.164
R-squared 0.118442 Mean dependent var 19.161
Adjusted R-squared 0.057040 S.D. dependent var 28.284
S.E. of regression 27.46636 Akaike info criterion 9.530
Sum squared resid 151634.6 Schwarz criterion 9.765
Log likelihood -1014.317 F-statistic 1.928
Durbin-Watson stat 1.201186 Prob(F-statistic) 0.025
Source: Author´s estimation by using Eviews.
The test statistic is nR2, where n is the sample size and R2 is the proportion of variation
explained in Table above. Test regression (k is the number of slope coefficients; k=14 in this
model). Critical values of the Chi-square; χ2 distribution is calculated as follows:
=@qchisq(0.90,14). We get value of Scalar=29.141 that appears in the lower left of the
EViews screen. Since the nR2 value of 25.58342 is lower than the 10% critical χ2 value of
29.1412, we can accept the null hypothesis, there is homoscedasticity. The probability printed
to the right of the nR2 value in the EViews output for White’s heteroskedasticity test (i.e.,
0.029226<0.05) represents the probability that we would be incorrect if we accepted
alternative hypothesis of heteroskedasticity. Nevertheless, the advantages of presenting
summary descriptive statistics for all variables in a data set in Model of Expenditure are
presented in following Table 9.
Table 9 Descriptive Statistics: Expenditure Model
EXPENDITURE GROSS DEBT
INFLATION
RATE INVESTMENT
GROWTH
RATE
Mean 45.63241 61.15602 2.623148 2.969444 1.637500
Median 45.60000 62.10000 2.400000 3.100000 1.800000
Maximum 65.50000 175.1000 15.30000 5.700000 11.00000
Minimum 33.20000 3.700000 -1.700000 1.000000 -17.70000
Std. Dev. 6.137590 34.44325 1.912656 1.066484 3.847576
Skewness 0.020125 0.453730 2.150160 0.092863 -0.946854
Kurtosis 2.732047 3.178257 13.48162 2.310914 6.627432
Jarque-Bera 0.660769 7.697331 1155.215 4.584002 150.6996
Probability 0.718647 0.021308 0.000000 0.101064 0.000000
Sum 9856.600 13209.70 566.6000 641.4000 353.7000
Sum Sq. Dev. 8099.053 255062.5 786.5243 244.5383 3182.826
Observations 216 216 216 216 216
Source: Author´s estimation by using Eviews

More Related Content

What's hot

When is undersampling effective in unbalanced classification tasks?
When is undersampling effective in unbalanced classification tasks?When is undersampling effective in unbalanced classification tasks?
When is undersampling effective in unbalanced classification tasks?
Andrea Dal Pozzolo
 
Chapter7
Chapter7Chapter7
Calibrating Probability with Undersampling for Unbalanced Classification
Calibrating Probability with Undersampling for Unbalanced ClassificationCalibrating Probability with Undersampling for Unbalanced Classification
Calibrating Probability with Undersampling for Unbalanced Classification
Andrea Dal Pozzolo
 
Probability
ProbabilityProbability
Probability
Sreenivasa Harish
 
Presentation on The Dog That Did Not Bark: A Defense of Return Predictability
Presentation on The Dog That Did Not Bark: A Defense of Return PredictabilityPresentation on The Dog That Did Not Bark: A Defense of Return Predictability
Presentation on The Dog That Did Not Bark: A Defense of Return Predictability
Michael-Paul James
 
A. Spanos Probability/Statistics Lecture Notes 5: Post-data severity evaluation
A. Spanos Probability/Statistics Lecture Notes 5: Post-data severity evaluationA. Spanos Probability/Statistics Lecture Notes 5: Post-data severity evaluation
A. Spanos Probability/Statistics Lecture Notes 5: Post-data severity evaluation
jemille6
 
6334 Day 3 slides: Spanos-lecture-2
6334 Day 3 slides: Spanos-lecture-26334 Day 3 slides: Spanos-lecture-2
6334 Day 3 slides: Spanos-lecture-2
jemille6
 
Chapter11
Chapter11Chapter11
Chapter11
Richard Ferreria
 
Chapter5
Chapter5Chapter5
Diagnostic methods for Building the regression model
Diagnostic methods for Building the regression modelDiagnostic methods for Building the regression model
Diagnostic methods for Building the regression model
Mehdi Shayegani
 
A few solvers for portfolio selection
A few solvers for portfolio selectionA few solvers for portfolio selection
A few solvers for portfolio selection
Bogusz Jelinski
 
Logistic Modeling with Applications to Marketing and Credit Risk in the Autom...
Logistic Modeling with Applications to Marketing and Credit Risk in the Autom...Logistic Modeling with Applications to Marketing and Credit Risk in the Autom...
Logistic Modeling with Applications to Marketing and Credit Risk in the Autom...
Magnify Analytic Solutions
 
Chapter13
Chapter13Chapter13
Chapter13
Richard Ferreria
 
Chapter15
Chapter15Chapter15
Chapter15
Richard Ferreria
 
Formulation of model likelihood functions
Formulation of model likelihood functionsFormulation of model likelihood functions
Formulation of model likelihood functions
Andreas Scheidegger
 
sample reliability- Ahmad MUHAMMD ATIYA
 sample reliability-  Ahmad MUHAMMD ATIYA sample reliability-  Ahmad MUHAMMD ATIYA
sample reliability- Ahmad MUHAMMD ATIYA
Ahmad Atiya
 
Chapter14
Chapter14Chapter14
Chapter14
Richard Ferreria
 
Chapter4
Chapter4Chapter4
b
bb
Chap05 discrete probability distributions
Chap05 discrete probability distributionsChap05 discrete probability distributions
Chap05 discrete probability distributions
Uni Azza Aunillah
 

What's hot (20)

When is undersampling effective in unbalanced classification tasks?
When is undersampling effective in unbalanced classification tasks?When is undersampling effective in unbalanced classification tasks?
When is undersampling effective in unbalanced classification tasks?
 
Chapter7
Chapter7Chapter7
Chapter7
 
Calibrating Probability with Undersampling for Unbalanced Classification
Calibrating Probability with Undersampling for Unbalanced ClassificationCalibrating Probability with Undersampling for Unbalanced Classification
Calibrating Probability with Undersampling for Unbalanced Classification
 
Probability
ProbabilityProbability
Probability
 
Presentation on The Dog That Did Not Bark: A Defense of Return Predictability
Presentation on The Dog That Did Not Bark: A Defense of Return PredictabilityPresentation on The Dog That Did Not Bark: A Defense of Return Predictability
Presentation on The Dog That Did Not Bark: A Defense of Return Predictability
 
A. Spanos Probability/Statistics Lecture Notes 5: Post-data severity evaluation
A. Spanos Probability/Statistics Lecture Notes 5: Post-data severity evaluationA. Spanos Probability/Statistics Lecture Notes 5: Post-data severity evaluation
A. Spanos Probability/Statistics Lecture Notes 5: Post-data severity evaluation
 
6334 Day 3 slides: Spanos-lecture-2
6334 Day 3 slides: Spanos-lecture-26334 Day 3 slides: Spanos-lecture-2
6334 Day 3 slides: Spanos-lecture-2
 
Chapter11
Chapter11Chapter11
Chapter11
 
Chapter5
Chapter5Chapter5
Chapter5
 
Diagnostic methods for Building the regression model
Diagnostic methods for Building the regression modelDiagnostic methods for Building the regression model
Diagnostic methods for Building the regression model
 
A few solvers for portfolio selection
A few solvers for portfolio selectionA few solvers for portfolio selection
A few solvers for portfolio selection
 
Logistic Modeling with Applications to Marketing and Credit Risk in the Autom...
Logistic Modeling with Applications to Marketing and Credit Risk in the Autom...Logistic Modeling with Applications to Marketing and Credit Risk in the Autom...
Logistic Modeling with Applications to Marketing and Credit Risk in the Autom...
 
Chapter13
Chapter13Chapter13
Chapter13
 
Chapter15
Chapter15Chapter15
Chapter15
 
Formulation of model likelihood functions
Formulation of model likelihood functionsFormulation of model likelihood functions
Formulation of model likelihood functions
 
sample reliability- Ahmad MUHAMMD ATIYA
 sample reliability-  Ahmad MUHAMMD ATIYA sample reliability-  Ahmad MUHAMMD ATIYA
sample reliability- Ahmad MUHAMMD ATIYA
 
Chapter14
Chapter14Chapter14
Chapter14
 
Chapter4
Chapter4Chapter4
Chapter4
 
b
bb
b
 
Chap05 discrete probability distributions
Chap05 discrete probability distributionsChap05 discrete probability distributions
Chap05 discrete probability distributions
 

Viewers also liked

Statement of adjustments
Statement of adjustmentsStatement of adjustments
Statement of adjustments
Altapacific
 
Working paper problem
Working paper problemWorking paper problem
Working paper problem
namninh
 
Ch06 modern auditing boynton
Ch06 modern auditing boyntonCh06 modern auditing boynton
Ch06 modern auditing boynton
Ardita Wulandari
 
Topic 6 audit documentation
Topic 6 audit documentationTopic 6 audit documentation
Topic 6 audit documentation
sakura rena
 
trade receivable and trade payable
trade receivable and trade payabletrade receivable and trade payable
trade receivable and trade payable
student
 
Audit Report
Audit ReportAudit Report
Audit Report
student
 
Definition of audit programme
Definition of audit programmeDefinition of audit programme
Definition of audit programme
student
 
Audit working papers
Audit working papersAudit working papers
Audit working papers
student
 
Audit Documentation Presentation
Audit Documentation PresentationAudit Documentation Presentation
Audit Documentation Presentation
Karim70
 

Viewers also liked (9)

Statement of adjustments
Statement of adjustmentsStatement of adjustments
Statement of adjustments
 
Working paper problem
Working paper problemWorking paper problem
Working paper problem
 
Ch06 modern auditing boynton
Ch06 modern auditing boyntonCh06 modern auditing boynton
Ch06 modern auditing boynton
 
Topic 6 audit documentation
Topic 6 audit documentationTopic 6 audit documentation
Topic 6 audit documentation
 
trade receivable and trade payable
trade receivable and trade payabletrade receivable and trade payable
trade receivable and trade payable
 
Audit Report
Audit ReportAudit Report
Audit Report
 
Definition of audit programme
Definition of audit programmeDefinition of audit programme
Definition of audit programme
 
Audit working papers
Audit working papersAudit working papers
Audit working papers
 
Audit Documentation Presentation
Audit Documentation PresentationAudit Documentation Presentation
Audit Documentation Presentation
 

Similar to Looking for cooperation on working paper - Expenditure model

Multiple Regression.ppt
Multiple Regression.pptMultiple Regression.ppt
Multiple Regression.ppt
TanyaWadhwani4
 
Binary Logistic Regression
Binary Logistic RegressionBinary Logistic Regression
Binary Logistic Regression
Seth Anandaram Jaipuria College
 
Get Multiple Regression Assignment Help
Get Multiple Regression Assignment Help Get Multiple Regression Assignment Help
Get Multiple Regression Assignment Help
HelpWithAssignment.com
 
Fpe 90min-all
Fpe 90min-allFpe 90min-all
Fpe 90min-all
wenchyan
 
Ali, Redescending M-estimator
Ali, Redescending M-estimator Ali, Redescending M-estimator
Ali, Redescending M-estimator
Muhammad Ali
 
Data Analysison Regression
Data Analysison RegressionData Analysison Regression
Data Analysison Regression
jamuga gitulho
 
whitehead-logistic-regression.ppt
whitehead-logistic-regression.pptwhitehead-logistic-regression.ppt
whitehead-logistic-regression.ppt
19DSMA012HarshSingh
 
SAMPLING MEAN DEFINITION The term sampling mean .docx
SAMPLING MEAN DEFINITION The term sampling mean .docxSAMPLING MEAN DEFINITION The term sampling mean .docx
SAMPLING MEAN DEFINITION The term sampling mean .docx
anhlodge
 
Lec1.regression
Lec1.regressionLec1.regression
Lec1.regression
Aftab Alam
 
Regression for class teaching
Regression for class teachingRegression for class teaching
Regression for class teaching
Pakistan Gum Industries Pvt. Ltd
 
Regression
Regression  Regression
Hypothesis Testing
Hypothesis TestingHypothesis Testing
Hypothesis Testing
Ryan Herzog
 
Ders 2 ols .ppt
Ders 2 ols .pptDers 2 ols .ppt
Ders 2 ols .ppt
Ergin Akalpler
 
Chapter 06 - Heteroskedasticity.pptx
Chapter 06 - Heteroskedasticity.pptxChapter 06 - Heteroskedasticity.pptx
Chapter 06 - Heteroskedasticity.pptx
Farah Amir
 
Regression
RegressionRegression
161783709 chapter-04-answers
161783709 chapter-04-answers161783709 chapter-04-answers
161783709 chapter-04-answers
BookStoreLib
 
161783709 chapter-04-answers
161783709 chapter-04-answers161783709 chapter-04-answers
161783709 chapter-04-answers
Firas Husseini
 
Seattle.Slides.7
Seattle.Slides.7Seattle.Slides.7
Seattle.Slides.7
Andrey Skripnikov
 
Corrleation and regression
Corrleation and regressionCorrleation and regression
Corrleation and regression
Pakistan Gum Industries Pvt. Ltd
 
Simple lin regress_inference
Simple lin regress_inferenceSimple lin regress_inference
Simple lin regress_inference
Kemal İnciroğlu
 

Similar to Looking for cooperation on working paper - Expenditure model (20)

Multiple Regression.ppt
Multiple Regression.pptMultiple Regression.ppt
Multiple Regression.ppt
 
Binary Logistic Regression
Binary Logistic RegressionBinary Logistic Regression
Binary Logistic Regression
 
Get Multiple Regression Assignment Help
Get Multiple Regression Assignment Help Get Multiple Regression Assignment Help
Get Multiple Regression Assignment Help
 
Fpe 90min-all
Fpe 90min-allFpe 90min-all
Fpe 90min-all
 
Ali, Redescending M-estimator
Ali, Redescending M-estimator Ali, Redescending M-estimator
Ali, Redescending M-estimator
 
Data Analysison Regression
Data Analysison RegressionData Analysison Regression
Data Analysison Regression
 
whitehead-logistic-regression.ppt
whitehead-logistic-regression.pptwhitehead-logistic-regression.ppt
whitehead-logistic-regression.ppt
 
SAMPLING MEAN DEFINITION The term sampling mean .docx
SAMPLING MEAN DEFINITION The term sampling mean .docxSAMPLING MEAN DEFINITION The term sampling mean .docx
SAMPLING MEAN DEFINITION The term sampling mean .docx
 
Lec1.regression
Lec1.regressionLec1.regression
Lec1.regression
 
Regression for class teaching
Regression for class teachingRegression for class teaching
Regression for class teaching
 
Regression
Regression  Regression
Regression
 
Hypothesis Testing
Hypothesis TestingHypothesis Testing
Hypothesis Testing
 
Ders 2 ols .ppt
Ders 2 ols .pptDers 2 ols .ppt
Ders 2 ols .ppt
 
Chapter 06 - Heteroskedasticity.pptx
Chapter 06 - Heteroskedasticity.pptxChapter 06 - Heteroskedasticity.pptx
Chapter 06 - Heteroskedasticity.pptx
 
Regression
RegressionRegression
Regression
 
161783709 chapter-04-answers
161783709 chapter-04-answers161783709 chapter-04-answers
161783709 chapter-04-answers
 
161783709 chapter-04-answers
161783709 chapter-04-answers161783709 chapter-04-answers
161783709 chapter-04-answers
 
Seattle.Slides.7
Seattle.Slides.7Seattle.Slides.7
Seattle.Slides.7
 
Corrleation and regression
Corrleation and regressionCorrleation and regression
Corrleation and regression
 
Simple lin regress_inference
Simple lin regress_inferenceSimple lin regress_inference
Simple lin regress_inference
 

More from Miss. Antónia FICOVÁ, Engineer. (Not yet Dr.)

Yandex.disk1
Yandex.disk1Yandex.disk1
Yandex.disk 3
Yandex.disk 3Yandex.disk 3
My profile1
My profile1My profile1
Image ban.ru my albums1
Image ban.ru   my albums1Image ban.ru   my albums1
Hubi c ovh-antonia_ficova
Hubi c   ovh-antonia_ficovaHubi c   ovh-antonia_ficova
History my drive - your swiss online storage4
History   my drive - your swiss online storage4History   my drive - your swiss online storage4
History my drive - your swiss online storage4
Miss. Antónia FICOVÁ, Engineer. (Not yet Dr.)
 
Yasar 1
Yasar 1Yasar 1
Acreditation
AcreditationAcreditation
View recorded transactions
View recorded transactionsView recorded transactions
View recorded transactions ii
View recorded transactions iiView recorded transactions ii
Personal data check
Personal data checkPersonal data check
Personal administration
Personal administrationPersonal administration

More from Miss. Antónia FICOVÁ, Engineer. (Not yet Dr.) (20)

Yandex.disk1
Yandex.disk1Yandex.disk1
Yandex.disk1
 
Yandex.disk 3
Yandex.disk 3Yandex.disk 3
Yandex.disk 3
 
My profile1
My profile1My profile1
My profile1
 
Image ban.ru news3
Image ban.ru   news3Image ban.ru   news3
Image ban.ru news3
 
Image ban.ru my albums1
Image ban.ru   my albums1Image ban.ru   my albums1
Image ban.ru my albums1
 
Hubi c ovh-antonia_ficova
Hubi c   ovh-antonia_ficovaHubi c   ovh-antonia_ficova
Hubi c ovh-antonia_ficova
 
History my drive - your swiss online storage4
History   my drive - your swiss online storage4History   my drive - your swiss online storage4
History my drive - your swiss online storage4
 
history internet banking_part_2
history internet banking_part_2history internet banking_part_2
history internet banking_part_2
 
Macikova
MacikovaMacikova
Macikova
 
Yasar 1
Yasar 1Yasar 1
Yasar 1
 
Sipko vii
Sipko viiSipko vii
Sipko vii
 
Phd 1
Phd 1Phd 1
Phd 1
 
Acreditation
AcreditationAcreditation
Acreditation
 
Academic senat ii
Academic senat iiAcademic senat ii
Academic senat ii
 
Zoznam zamestnancov uis
Zoznam zamestnancov uisZoznam zamestnancov uis
Zoznam zamestnancov uis
 
View recorded transactions
View recorded transactionsView recorded transactions
View recorded transactions
 
View recorded transactions ii
View recorded transactions iiView recorded transactions ii
View recorded transactions ii
 
Personal data check
Personal data checkPersonal data check
Personal data check
 
Personal administration
Personal administrationPersonal administration
Personal administration
 
Telephone directory ii.
Telephone directory ii.Telephone directory ii.
Telephone directory ii.
 

Recently uploaded

在线办理(GU毕业证书)美国贡萨加大学毕业证学历证书一模一样
在线办理(GU毕业证书)美国贡萨加大学毕业证学历证书一模一样在线办理(GU毕业证书)美国贡萨加大学毕业证学历证书一模一样
在线办理(GU毕业证书)美国贡萨加大学毕业证学历证书一模一样
5spllj1l
 
Instant Issue Debit Cards - High School Spirit
Instant Issue Debit Cards - High School SpiritInstant Issue Debit Cards - High School Spirit
Instant Issue Debit Cards - High School Spirit
egoetzinger
 
Who Is Abhay Bhutada, MD of Poonawalla Fincorp
Who Is Abhay Bhutada, MD of Poonawalla FincorpWho Is Abhay Bhutada, MD of Poonawalla Fincorp
Who Is Abhay Bhutada, MD of Poonawalla Fincorp
beulahfernandes8
 
An Overview of the Prosocial dHEDGE Vault works
An Overview of the Prosocial dHEDGE Vault worksAn Overview of the Prosocial dHEDGE Vault works
An Overview of the Prosocial dHEDGE Vault works
Colin R. Turner
 
falcon-invoice-discounting-a-strategic-approach-to-optimize-investments
falcon-invoice-discounting-a-strategic-approach-to-optimize-investmentsfalcon-invoice-discounting-a-strategic-approach-to-optimize-investments
falcon-invoice-discounting-a-strategic-approach-to-optimize-investments
Falcon Invoice Discounting
 
Independent Study - College of Wooster Research (2023-2024)
Independent Study - College of Wooster Research (2023-2024)Independent Study - College of Wooster Research (2023-2024)
Independent Study - College of Wooster Research (2023-2024)
AntoniaOwensDetwiler
 
How Non-Banking Financial Companies Empower Startups With Venture Debt Financing
How Non-Banking Financial Companies Empower Startups With Venture Debt FinancingHow Non-Banking Financial Companies Empower Startups With Venture Debt Financing
How Non-Banking Financial Companies Empower Startups With Venture Debt Financing
Vighnesh Shashtri
 
STREETONOMICS: Exploring the Uncharted Territories of Informal Markets throug...
STREETONOMICS: Exploring the Uncharted Territories of Informal Markets throug...STREETONOMICS: Exploring the Uncharted Territories of Informal Markets throug...
STREETONOMICS: Exploring the Uncharted Territories of Informal Markets throug...
sameer shah
 
The Impact of GST Payments on Loan Approvals
The Impact of GST Payments on Loan ApprovalsThe Impact of GST Payments on Loan Approvals
The Impact of GST Payments on Loan Approvals
Vighnesh Shashtri
 
Applying the Global Internal Audit Standards_AIS.pdf
Applying the Global Internal Audit Standards_AIS.pdfApplying the Global Internal Audit Standards_AIS.pdf
Applying the Global Internal Audit Standards_AIS.pdf
alexiusbrian1
 
SWAIAP Fraud Risk Mitigation Prof Oyedokun.pptx
SWAIAP Fraud Risk Mitigation   Prof Oyedokun.pptxSWAIAP Fraud Risk Mitigation   Prof Oyedokun.pptx
SWAIAP Fraud Risk Mitigation Prof Oyedokun.pptx
Godwin Emmanuel Oyedokun MBA MSc PhD FCA FCTI FCNA CFE FFAR
 
Detailed power point presentation on compound interest and how it is calculated
Detailed power point presentation on compound interest  and how it is calculatedDetailed power point presentation on compound interest  and how it is calculated
Detailed power point presentation on compound interest and how it is calculated
KishanChaudhary23
 
What's a worker’s market? Job quality and labour market tightness
What's a worker’s market? Job quality and labour market tightnessWhat's a worker’s market? Job quality and labour market tightness
What's a worker’s market? Job quality and labour market tightness
Labour Market Information Council | Conseil de l’information sur le marché du travail
 
falcon-invoice-discounting-a-premier-investment-platform-for-superior-returns...
falcon-invoice-discounting-a-premier-investment-platform-for-superior-returns...falcon-invoice-discounting-a-premier-investment-platform-for-superior-returns...
falcon-invoice-discounting-a-premier-investment-platform-for-superior-returns...
Falcon Invoice Discounting
 
BONKMILLON Unleashes Its Bonkers Potential on Solana.pdf
BONKMILLON Unleashes Its Bonkers Potential on Solana.pdfBONKMILLON Unleashes Its Bonkers Potential on Solana.pdf
BONKMILLON Unleashes Its Bonkers Potential on Solana.pdf
coingabbar
 
1:1制作加拿大麦吉尔大学毕业证硕士学历证书原版一模一样
1:1制作加拿大麦吉尔大学毕业证硕士学历证书原版一模一样1:1制作加拿大麦吉尔大学毕业证硕士学历证书原版一模一样
1:1制作加拿大麦吉尔大学毕业证硕士学历证书原版一模一样
qntjwn68
 
Seminar: Gender Board Diversity through Ownership Networks
Seminar: Gender Board Diversity through Ownership NetworksSeminar: Gender Board Diversity through Ownership Networks
Seminar: Gender Board Diversity through Ownership Networks
GRAPE
 
一比一原版(GWU,GW毕业证)加利福尼亚大学|尔湾分校毕业证如何办理
一比一原版(GWU,GW毕业证)加利福尼亚大学|尔湾分校毕业证如何办理一比一原版(GWU,GW毕业证)加利福尼亚大学|尔湾分校毕业证如何办理
一比一原版(GWU,GW毕业证)加利福尼亚大学|尔湾分校毕业证如何办理
obyzuk
 
一比一原版美国新罕布什尔大学(unh)毕业证学历认证真实可查
一比一原版美国新罕布什尔大学(unh)毕业证学历认证真实可查一比一原版美国新罕布什尔大学(unh)毕业证学历认证真实可查
一比一原版美国新罕布什尔大学(unh)毕业证学历认证真实可查
taqyea
 
Money20/20 and EU Networking Event of 20/24!
Money20/20 and EU Networking Event of 20/24!Money20/20 and EU Networking Event of 20/24!
Money20/20 and EU Networking Event of 20/24!
FinTech Belgium
 

Recently uploaded (20)

在线办理(GU毕业证书)美国贡萨加大学毕业证学历证书一模一样
在线办理(GU毕业证书)美国贡萨加大学毕业证学历证书一模一样在线办理(GU毕业证书)美国贡萨加大学毕业证学历证书一模一样
在线办理(GU毕业证书)美国贡萨加大学毕业证学历证书一模一样
 
Instant Issue Debit Cards - High School Spirit
Instant Issue Debit Cards - High School SpiritInstant Issue Debit Cards - High School Spirit
Instant Issue Debit Cards - High School Spirit
 
Who Is Abhay Bhutada, MD of Poonawalla Fincorp
Who Is Abhay Bhutada, MD of Poonawalla FincorpWho Is Abhay Bhutada, MD of Poonawalla Fincorp
Who Is Abhay Bhutada, MD of Poonawalla Fincorp
 
An Overview of the Prosocial dHEDGE Vault works
An Overview of the Prosocial dHEDGE Vault worksAn Overview of the Prosocial dHEDGE Vault works
An Overview of the Prosocial dHEDGE Vault works
 
falcon-invoice-discounting-a-strategic-approach-to-optimize-investments
falcon-invoice-discounting-a-strategic-approach-to-optimize-investmentsfalcon-invoice-discounting-a-strategic-approach-to-optimize-investments
falcon-invoice-discounting-a-strategic-approach-to-optimize-investments
 
Independent Study - College of Wooster Research (2023-2024)
Independent Study - College of Wooster Research (2023-2024)Independent Study - College of Wooster Research (2023-2024)
Independent Study - College of Wooster Research (2023-2024)
 
How Non-Banking Financial Companies Empower Startups With Venture Debt Financing
How Non-Banking Financial Companies Empower Startups With Venture Debt FinancingHow Non-Banking Financial Companies Empower Startups With Venture Debt Financing
How Non-Banking Financial Companies Empower Startups With Venture Debt Financing
 
STREETONOMICS: Exploring the Uncharted Territories of Informal Markets throug...
STREETONOMICS: Exploring the Uncharted Territories of Informal Markets throug...STREETONOMICS: Exploring the Uncharted Territories of Informal Markets throug...
STREETONOMICS: Exploring the Uncharted Territories of Informal Markets throug...
 
The Impact of GST Payments on Loan Approvals
The Impact of GST Payments on Loan ApprovalsThe Impact of GST Payments on Loan Approvals
The Impact of GST Payments on Loan Approvals
 
Applying the Global Internal Audit Standards_AIS.pdf
Applying the Global Internal Audit Standards_AIS.pdfApplying the Global Internal Audit Standards_AIS.pdf
Applying the Global Internal Audit Standards_AIS.pdf
 
SWAIAP Fraud Risk Mitigation Prof Oyedokun.pptx
SWAIAP Fraud Risk Mitigation   Prof Oyedokun.pptxSWAIAP Fraud Risk Mitigation   Prof Oyedokun.pptx
SWAIAP Fraud Risk Mitigation Prof Oyedokun.pptx
 
Detailed power point presentation on compound interest and how it is calculated
Detailed power point presentation on compound interest  and how it is calculatedDetailed power point presentation on compound interest  and how it is calculated
Detailed power point presentation on compound interest and how it is calculated
 
What's a worker’s market? Job quality and labour market tightness
What's a worker’s market? Job quality and labour market tightnessWhat's a worker’s market? Job quality and labour market tightness
What's a worker’s market? Job quality and labour market tightness
 
falcon-invoice-discounting-a-premier-investment-platform-for-superior-returns...
falcon-invoice-discounting-a-premier-investment-platform-for-superior-returns...falcon-invoice-discounting-a-premier-investment-platform-for-superior-returns...
falcon-invoice-discounting-a-premier-investment-platform-for-superior-returns...
 
BONKMILLON Unleashes Its Bonkers Potential on Solana.pdf
BONKMILLON Unleashes Its Bonkers Potential on Solana.pdfBONKMILLON Unleashes Its Bonkers Potential on Solana.pdf
BONKMILLON Unleashes Its Bonkers Potential on Solana.pdf
 
1:1制作加拿大麦吉尔大学毕业证硕士学历证书原版一模一样
1:1制作加拿大麦吉尔大学毕业证硕士学历证书原版一模一样1:1制作加拿大麦吉尔大学毕业证硕士学历证书原版一模一样
1:1制作加拿大麦吉尔大学毕业证硕士学历证书原版一模一样
 
Seminar: Gender Board Diversity through Ownership Networks
Seminar: Gender Board Diversity through Ownership NetworksSeminar: Gender Board Diversity through Ownership Networks
Seminar: Gender Board Diversity through Ownership Networks
 
一比一原版(GWU,GW毕业证)加利福尼亚大学|尔湾分校毕业证如何办理
一比一原版(GWU,GW毕业证)加利福尼亚大学|尔湾分校毕业证如何办理一比一原版(GWU,GW毕业证)加利福尼亚大学|尔湾分校毕业证如何办理
一比一原版(GWU,GW毕业证)加利福尼亚大学|尔湾分校毕业证如何办理
 
一比一原版美国新罕布什尔大学(unh)毕业证学历认证真实可查
一比一原版美国新罕布什尔大学(unh)毕业证学历认证真实可查一比一原版美国新罕布什尔大学(unh)毕业证学历认证真实可查
一比一原版美国新罕布什尔大学(unh)毕业证学历认证真实可查
 
Money20/20 and EU Networking Event of 20/24!
Money20/20 and EU Networking Event of 20/24!Money20/20 and EU Networking Event of 20/24!
Money20/20 and EU Networking Event of 20/24!
 

Looking for cooperation on working paper - Expenditure model

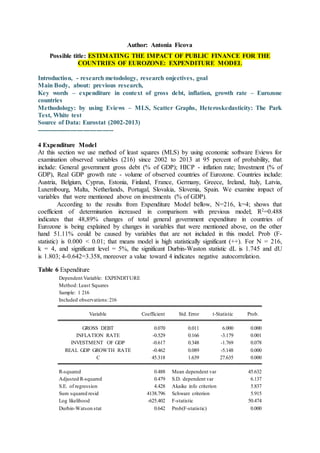
  • 1. Author: Antonia Ficova Possible title: ESTIMATING THE IMPACT OF PUBLIC FINANCE FOR THE COUNTRIES OF EUROZONE: EXPENDITURE MODEL Introduction, - research metodology, research onjectives, goal Main Body, about: previous research, Key words – expenditure in context of gross debt, inflation, growth rate – Eurozone countries Methodology: by using Eviews – MLS, Scatter Graphs, Heteroskedasticity: The Park Test, White test Source of Data: Eurostat (2002-2013) ------------------------------------ 4 Expenditure Model At this section we use method of least squares (MLS) by using economic software Eviews for examination observed variables (216) since 2002 to 2013 at 95 percent of probability, that include: General government gross debt (% of GDP); HICP - inflation rate; Investment (% of GDP), Real GDP growth rate - volume of observed countries of Eurozone. Countries include: Austria, Belgium, Cyprus, Estonia, Finland, France, Germany, Greece, Ireland, Italy, Latvia, Luxembourg, Malta, Netherlands, Portugal, Slovakia, Slovenia, Spain. We examine impact of variables that were mentioned above on investments (% of GDP). According to the results from Expenditure Model bellow, N=216, k=4; shows that coefficient of determination increased in comparisom with previous model; R2=0.488 indicates that 48,89% changes of total general government expenditure in countries of Eurozone is being explained by changes in variables that were mentioned above, on the other hand 51.11% could be caused by variables that are not included in this model. Prob (F- statistic) is 0.000 < 0.01; that means model is high statistically significant (++). For N = 216, k = 4, and significant level = 5%, the significant Durbin-Waston statistic dL is 1.745 and dU is 1.803; 4-0.642=3.358, moreover a value toward 4 indicates negative autocorrelation. Table 6 Expenditure Dependent Variable: EXPENDITURE Method: Least Squares Sample: 1 216 Included observations:216 Variable Coefficient Std. Error t-Statistic Prob. GROSS DEBT 0.070 0.011 6.000 0.000 INFLATION RATE -0.529 0.166 -3.179 0.001 INVESTMENT OF GDP -0.617 0.348 -1.769 0.078 REAL GDP GROWTH RATE -0.462 0.089 -5.148 0.000 C 45.318 1.639 27.635 0.000 R-squared 0.488 Mean dependent var 45.632 Adjusted R-squared 0.479 S.D. dependent var 6.137 S.E. of regression 4.428 Akaike info criterion 5.837 Sum squared resid 4138.796 Schwarz criterion 5.915 Log likelihood -625.402 F-statistic 50.474 Durbin-Watson stat 0.642 Prob(F-statistic) 0.000
  • 2. Source: Author´s estimation by using Eviews In this model, as is shown in Table above, we get estimation equation as follows: Expenditure = β0 + β1*debt - β2*inflation rate - β3*investment - β4*growth rate Than we get following formula: Expenditure = 45.318 + 0.070*debt - 0.529*inflation rate - 0.617*investment - 0.462*growth rate Relations between variables are illustrated by scatter graphs as follows. Moreover, a positive correlation is between debt and expenditure, on the other hand is negative correlation between growth rate and expenditure. Figure 5-8 Simple Scatter Graph of observed variables in Expenditure Model Source: Author´s estimation by using Eviews. * Note: The data is displayed as a collection of points, each having the value of one variable determining the position on the horizontal axis and the value of the other variable determining the position on the vertical axis. If the pattern of dots slopes from lower left to upper right, it suggests a positive correlation between the variables being studied, e. g. debt to expenditure. If the pattern of dots slopes from upper left to lower right, it suggests a negative correlation, e.g. growth rate to expenditure.
  • 3. 4.1 Testing for heteroskedasticity 4.1.1 The Park Test At this point, we use Park test for estimating linear regression parameters in the presence of heteroscedastic error terms. As were mentioned in previous model, first we take formula from regression analysis (OLS): Yi = β0 + β1X1i + β2X2i + εi; (6) Expenditure = β0 + β1*debt - β2*inflation rate - β3*investment - β4*growth rate+ εi. Second, we collect the residuals ei and get following table the auxiliary regression as follows: LOG(RESID02^2) = -22.450 - 0.256*LOG(inflation rate) + 0.924* LOG(debt) - 3.194 *LOG(expenditure)+ 6.947*LOG(employment) Than we formulate hypothesis as follows: H0: There is homoscedasticity; var(εi)=(σ)2 H1: There is heteroscedasticity; var(εi)=(σi)2 Table 7 Park Test Dependent Variable: LOG(RESID03^2) Method: Least Squares Sample (adjusted): 1 214 Included observations:157 after adjustments Variable Coefficient Std. Error t-Statistic Prob. C 3.381 1.495 2.261 0.025 LOG(debt) -0.238 0.284 -0.837 0.403 LOG(inflation rate) -0.603 0.320 -1.883 0.061 LOG(investment) -0.450 0.504 -0.894 0.372 LOG(growth rate) 0.107 0.226 0.474 0.635 R-squared 0.032 Mean dependent var 1.586 Adjusted R-squared 0.006 S.D. dependent var 2.243 S.E. of regression 2.235 Akaike info criterion 4.478 Sum squared resid 759.939 Schwarz criterion 4.575 Log likelihood -346.567 F-statistic 1.262 Durbin-Watson stat 0.855 Prob(F-statistic) 0.287 Source: Author´s estimation by using Eviews. According to the results from Table above Park test show that t-Statistics (Park-t) is not larger than 2 of the regressors Xi (the thumb than critical t), therefore we accept H0. The model confirmed Homoscedasticity. 4.1.2 White test of Expenditure Model We use this test for estimation of heteroscedasticity of the model. We formulate hypothesis as follows: H0: There is homoscedasticity; var(εi)=(σ)2 H1: There is heteroscedasticity; var(εi)=(σi)2 The Lagrange multiplier (LM) test statistic is the product of the R2 value and sample size:
  • 4. LM = n . R2 (7) In our case LM= 216*0.118= 25.583 Moreover, the squared residuals from the original model serve as a proxy for the variance of the error term at each observation. We use formula from regression analysis (OLS) and take White Heteroscedasticity (cross terms) as follows: Table 8 White Heteroskedasticity Test F-statistic 1.928 Probability 0.025 Obs*R-squared 25.583 Probability 0.029 Test Equation: Dependent Variable: RESID^2 Method: Least Squares Date: 10/25/14 Time: 18:14 Sample: 1 216 Included observations:216 Variable Coefficient Std. Error t-Statistic Prob. C -17.771 42.586 -0.417 0.676 GROSS DEBT 0.367 0.604 0.606 0.544 GROSS DEBT^2 -0.002 0.002 -0.876 0.381 GROSS DEBT*INFLATION_RATE -0.104 0.054 -1.908 0.057 GROSS DEBT*INVESTMENT 0.036 0.112 0.329 0.742 GROSS DEBT*GROWTH RATE -0.015 0.023 -0.644 0.520 INFLATION RATE 5.496 7.407 0.741 0.459 INFLATION RATE^2 0.031 0.256 0.124 0.900 INFLATION RATE*INVESTMENT -0.814 1.470 -0.553 0.580 INFLATION RATE*GROWTH RATE -0.339 0.258 -1.312 0.190 INVESTMENT 22.491 17.616 1.276 0.203 INVESTMENT^2 -4.152 2.203 -1.884 0.060 INVESTMENT*GROWTH RATE 0.458 0.781 0.586 0.557 GROWTH RATE -0.771 3.460 -0.222 0.823 GROWTH RATE^2 0.116 0.083 1.396 0.164 R-squared 0.118442 Mean dependent var 19.161 Adjusted R-squared 0.057040 S.D. dependent var 28.284 S.E. of regression 27.46636 Akaike info criterion 9.530 Sum squared resid 151634.6 Schwarz criterion 9.765 Log likelihood -1014.317 F-statistic 1.928 Durbin-Watson stat 1.201186 Prob(F-statistic) 0.025 Source: Author´s estimation by using Eviews. The test statistic is nR2, where n is the sample size and R2 is the proportion of variation explained in Table above. Test regression (k is the number of slope coefficients; k=14 in this
  • 5. model). Critical values of the Chi-square; χ2 distribution is calculated as follows: =@qchisq(0.90,14). We get value of Scalar=29.141 that appears in the lower left of the EViews screen. Since the nR2 value of 25.58342 is lower than the 10% critical χ2 value of 29.1412, we can accept the null hypothesis, there is homoscedasticity. The probability printed to the right of the nR2 value in the EViews output for White’s heteroskedasticity test (i.e., 0.029226<0.05) represents the probability that we would be incorrect if we accepted alternative hypothesis of heteroskedasticity. Nevertheless, the advantages of presenting summary descriptive statistics for all variables in a data set in Model of Expenditure are presented in following Table 9. Table 9 Descriptive Statistics: Expenditure Model EXPENDITURE GROSS DEBT INFLATION RATE INVESTMENT GROWTH RATE Mean 45.63241 61.15602 2.623148 2.969444 1.637500 Median 45.60000 62.10000 2.400000 3.100000 1.800000 Maximum 65.50000 175.1000 15.30000 5.700000 11.00000 Minimum 33.20000 3.700000 -1.700000 1.000000 -17.70000 Std. Dev. 6.137590 34.44325 1.912656 1.066484 3.847576 Skewness 0.020125 0.453730 2.150160 0.092863 -0.946854 Kurtosis 2.732047 3.178257 13.48162 2.310914 6.627432 Jarque-Bera 0.660769 7.697331 1155.215 4.584002 150.6996 Probability 0.718647 0.021308 0.000000 0.101064 0.000000 Sum 9856.600 13209.70 566.6000 641.4000 353.7000 Sum Sq. Dev. 8099.053 255062.5 786.5243 244.5383 3182.826 Observations 216 216 216 216 216 Source: Author´s estimation by using Eviews