Download as PPSX, PPTX
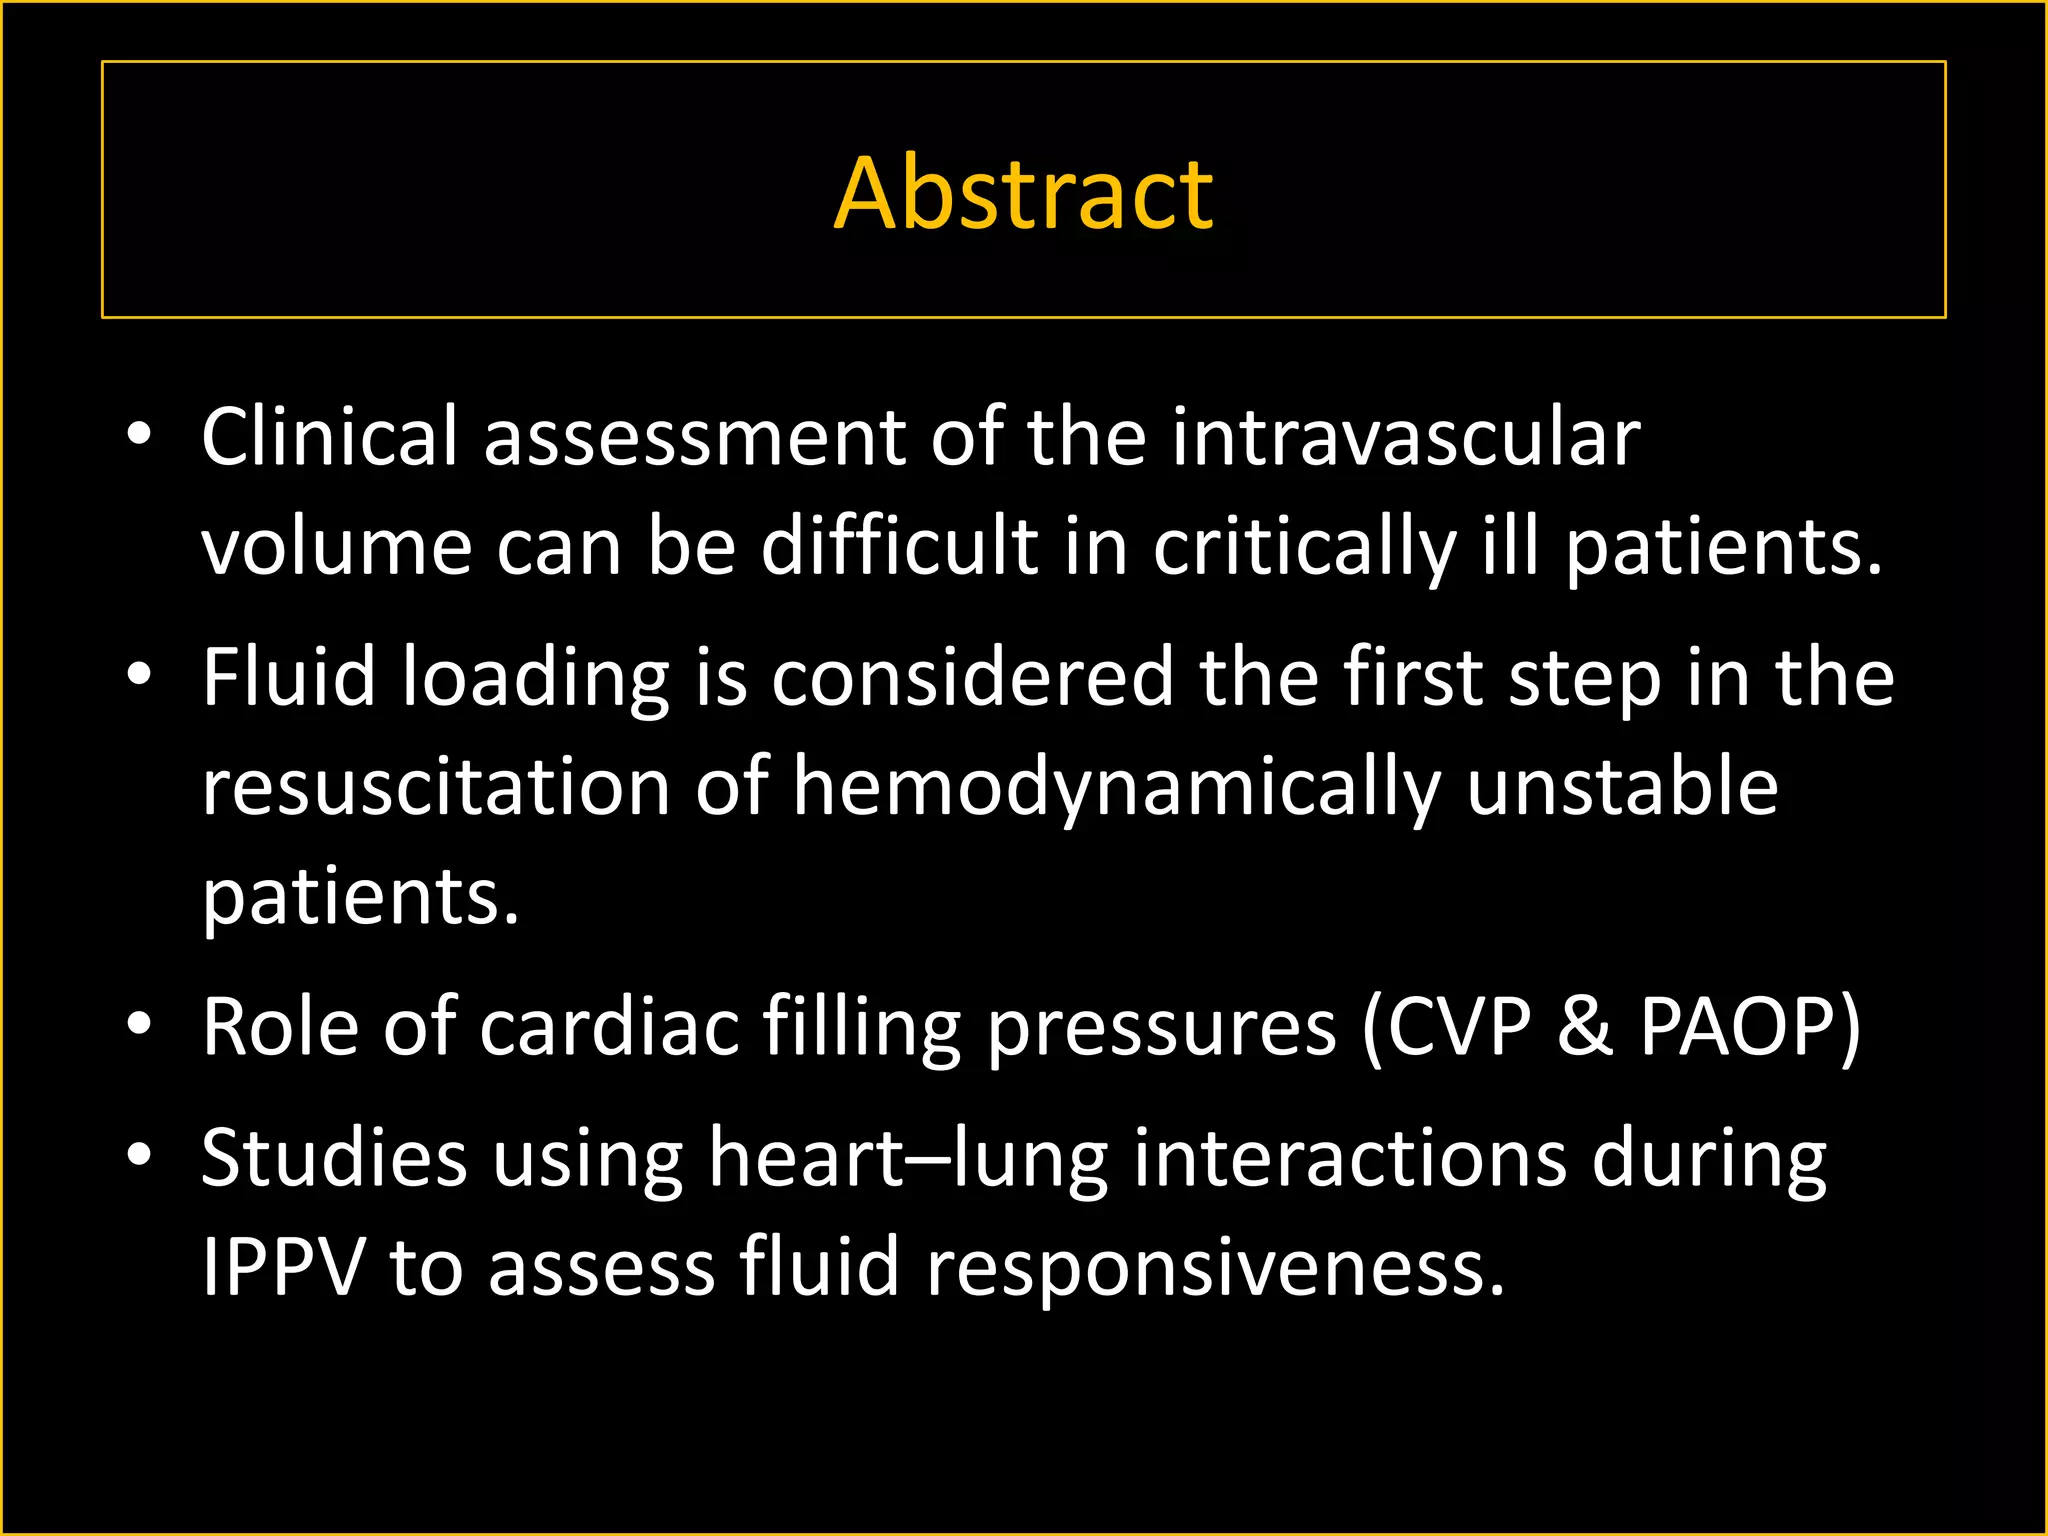
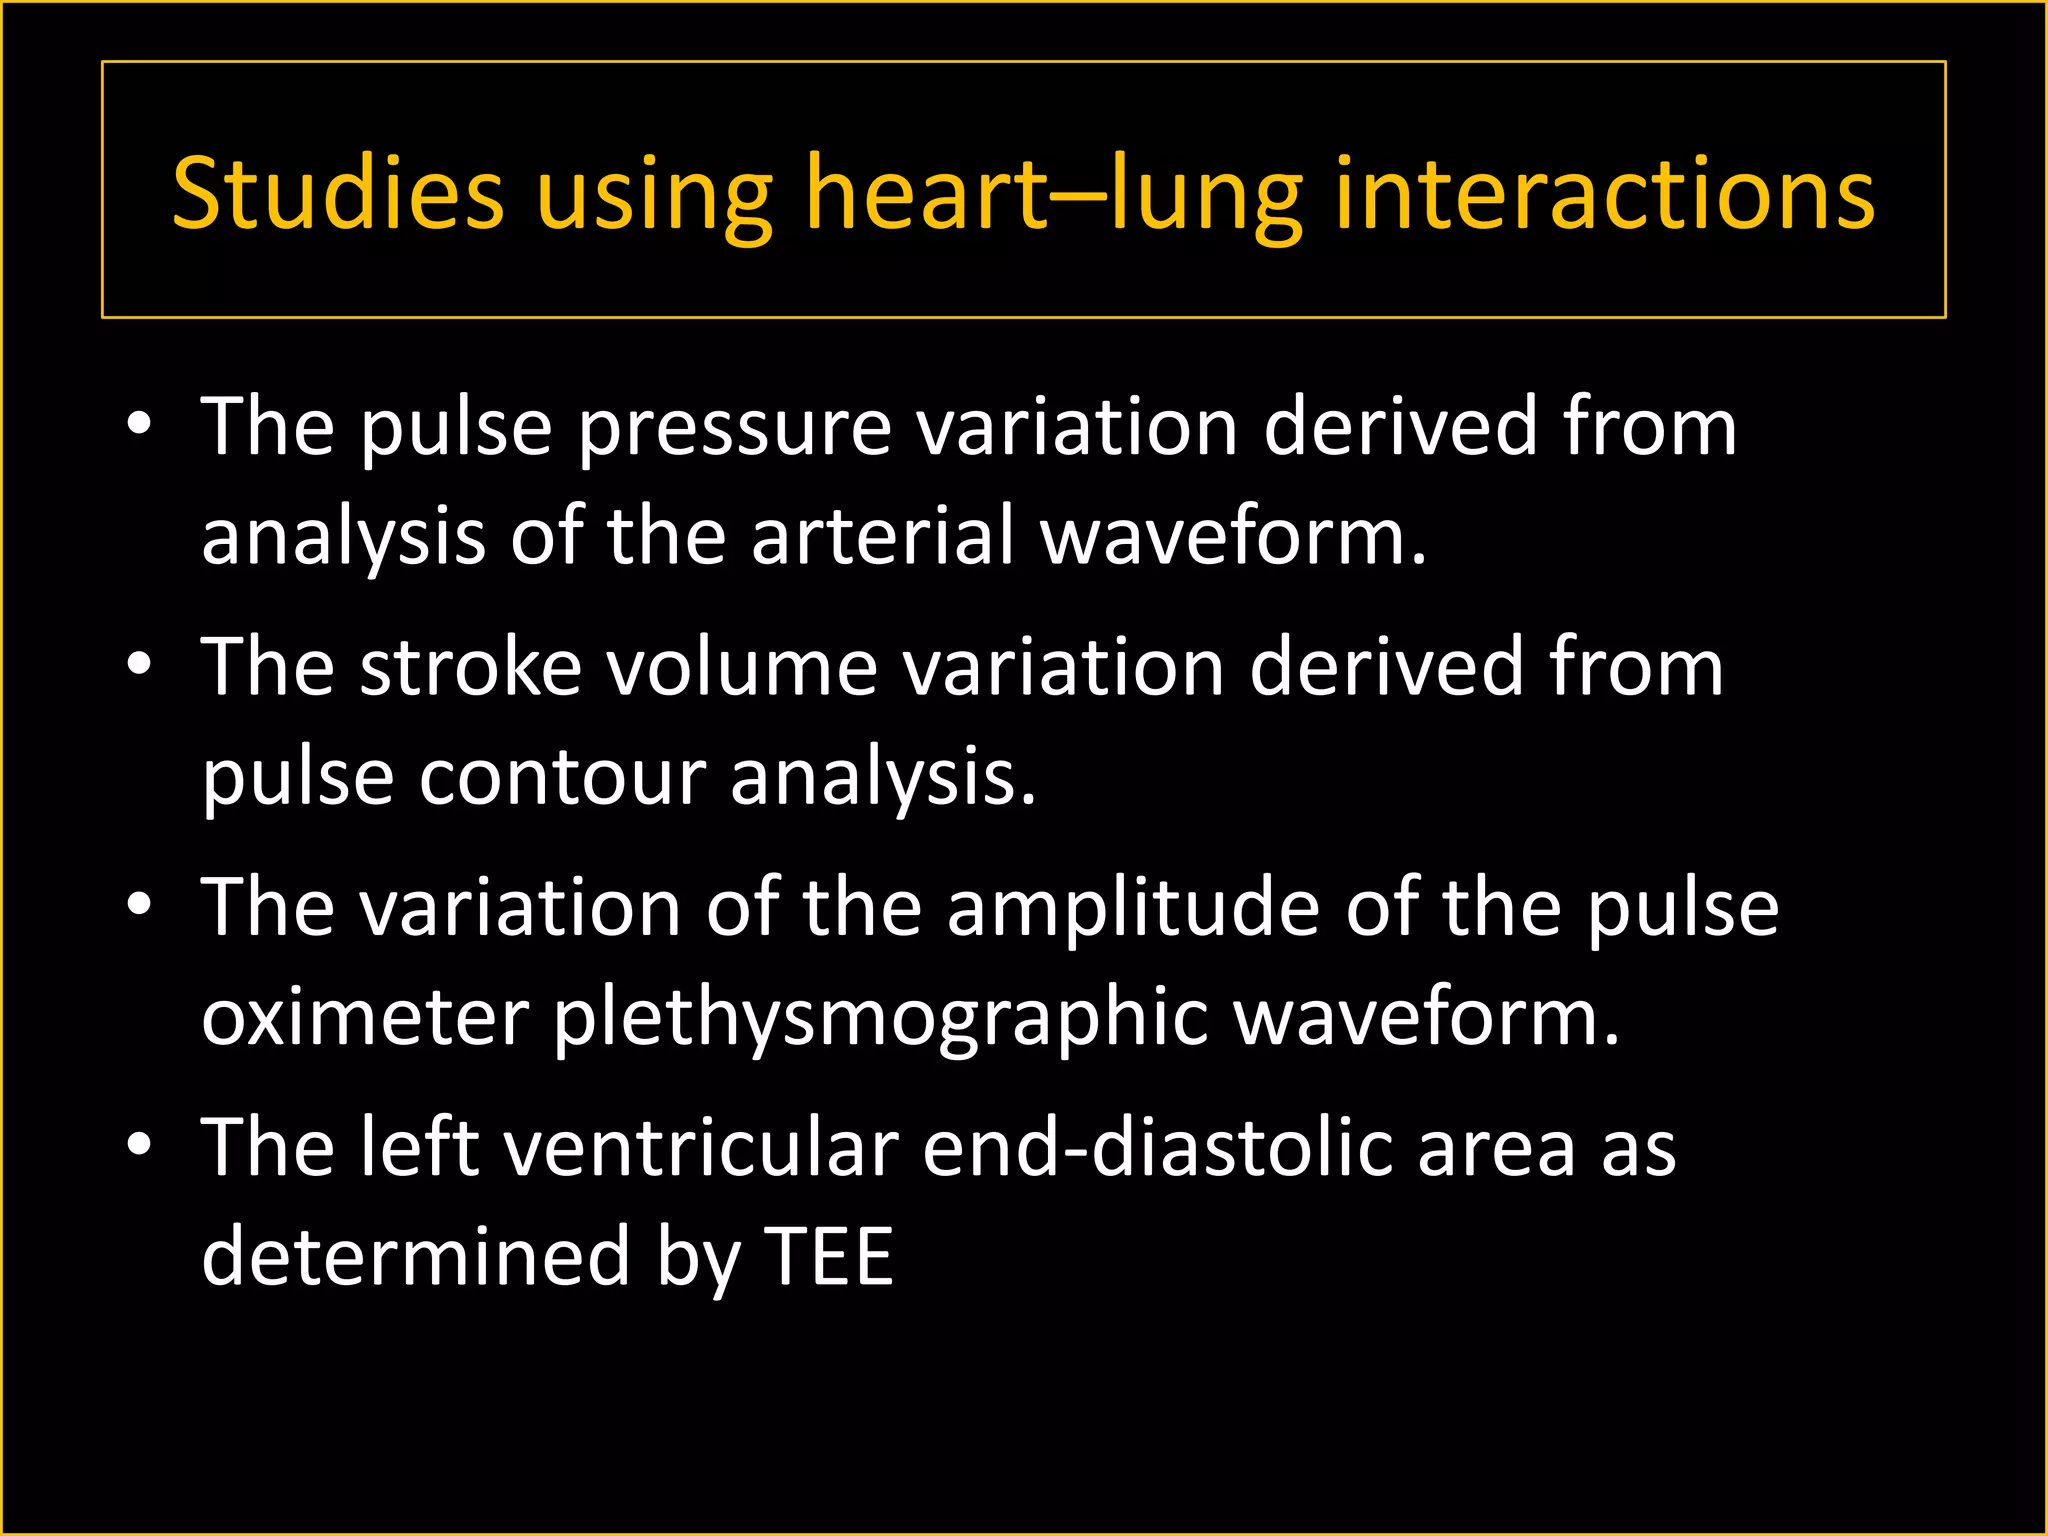
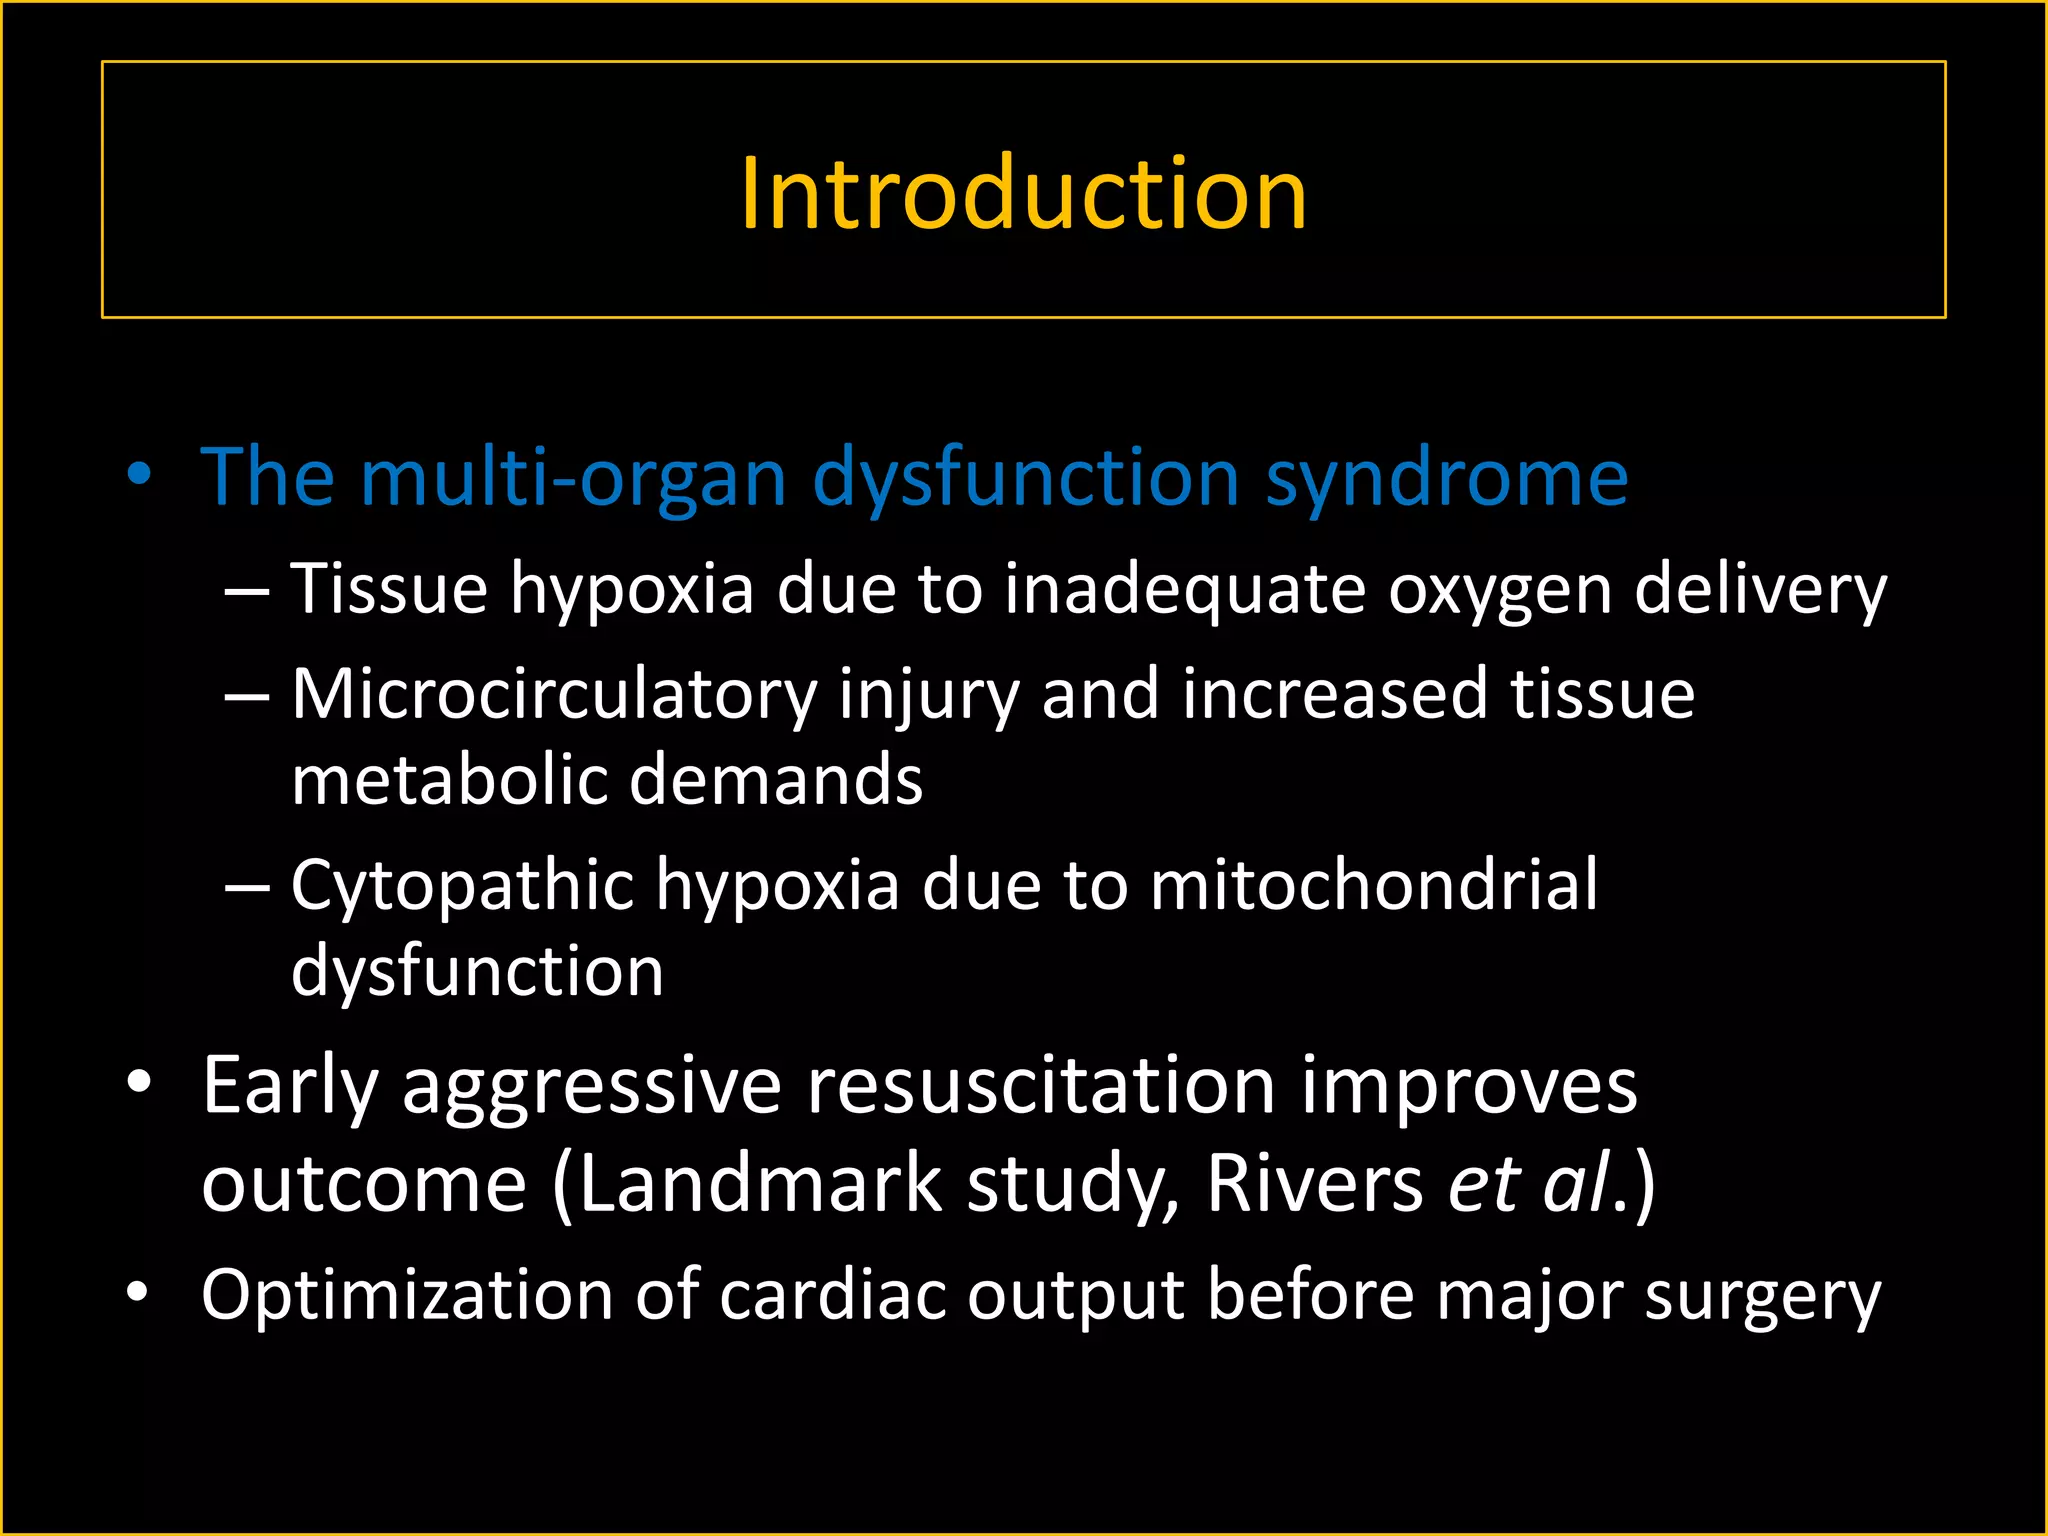
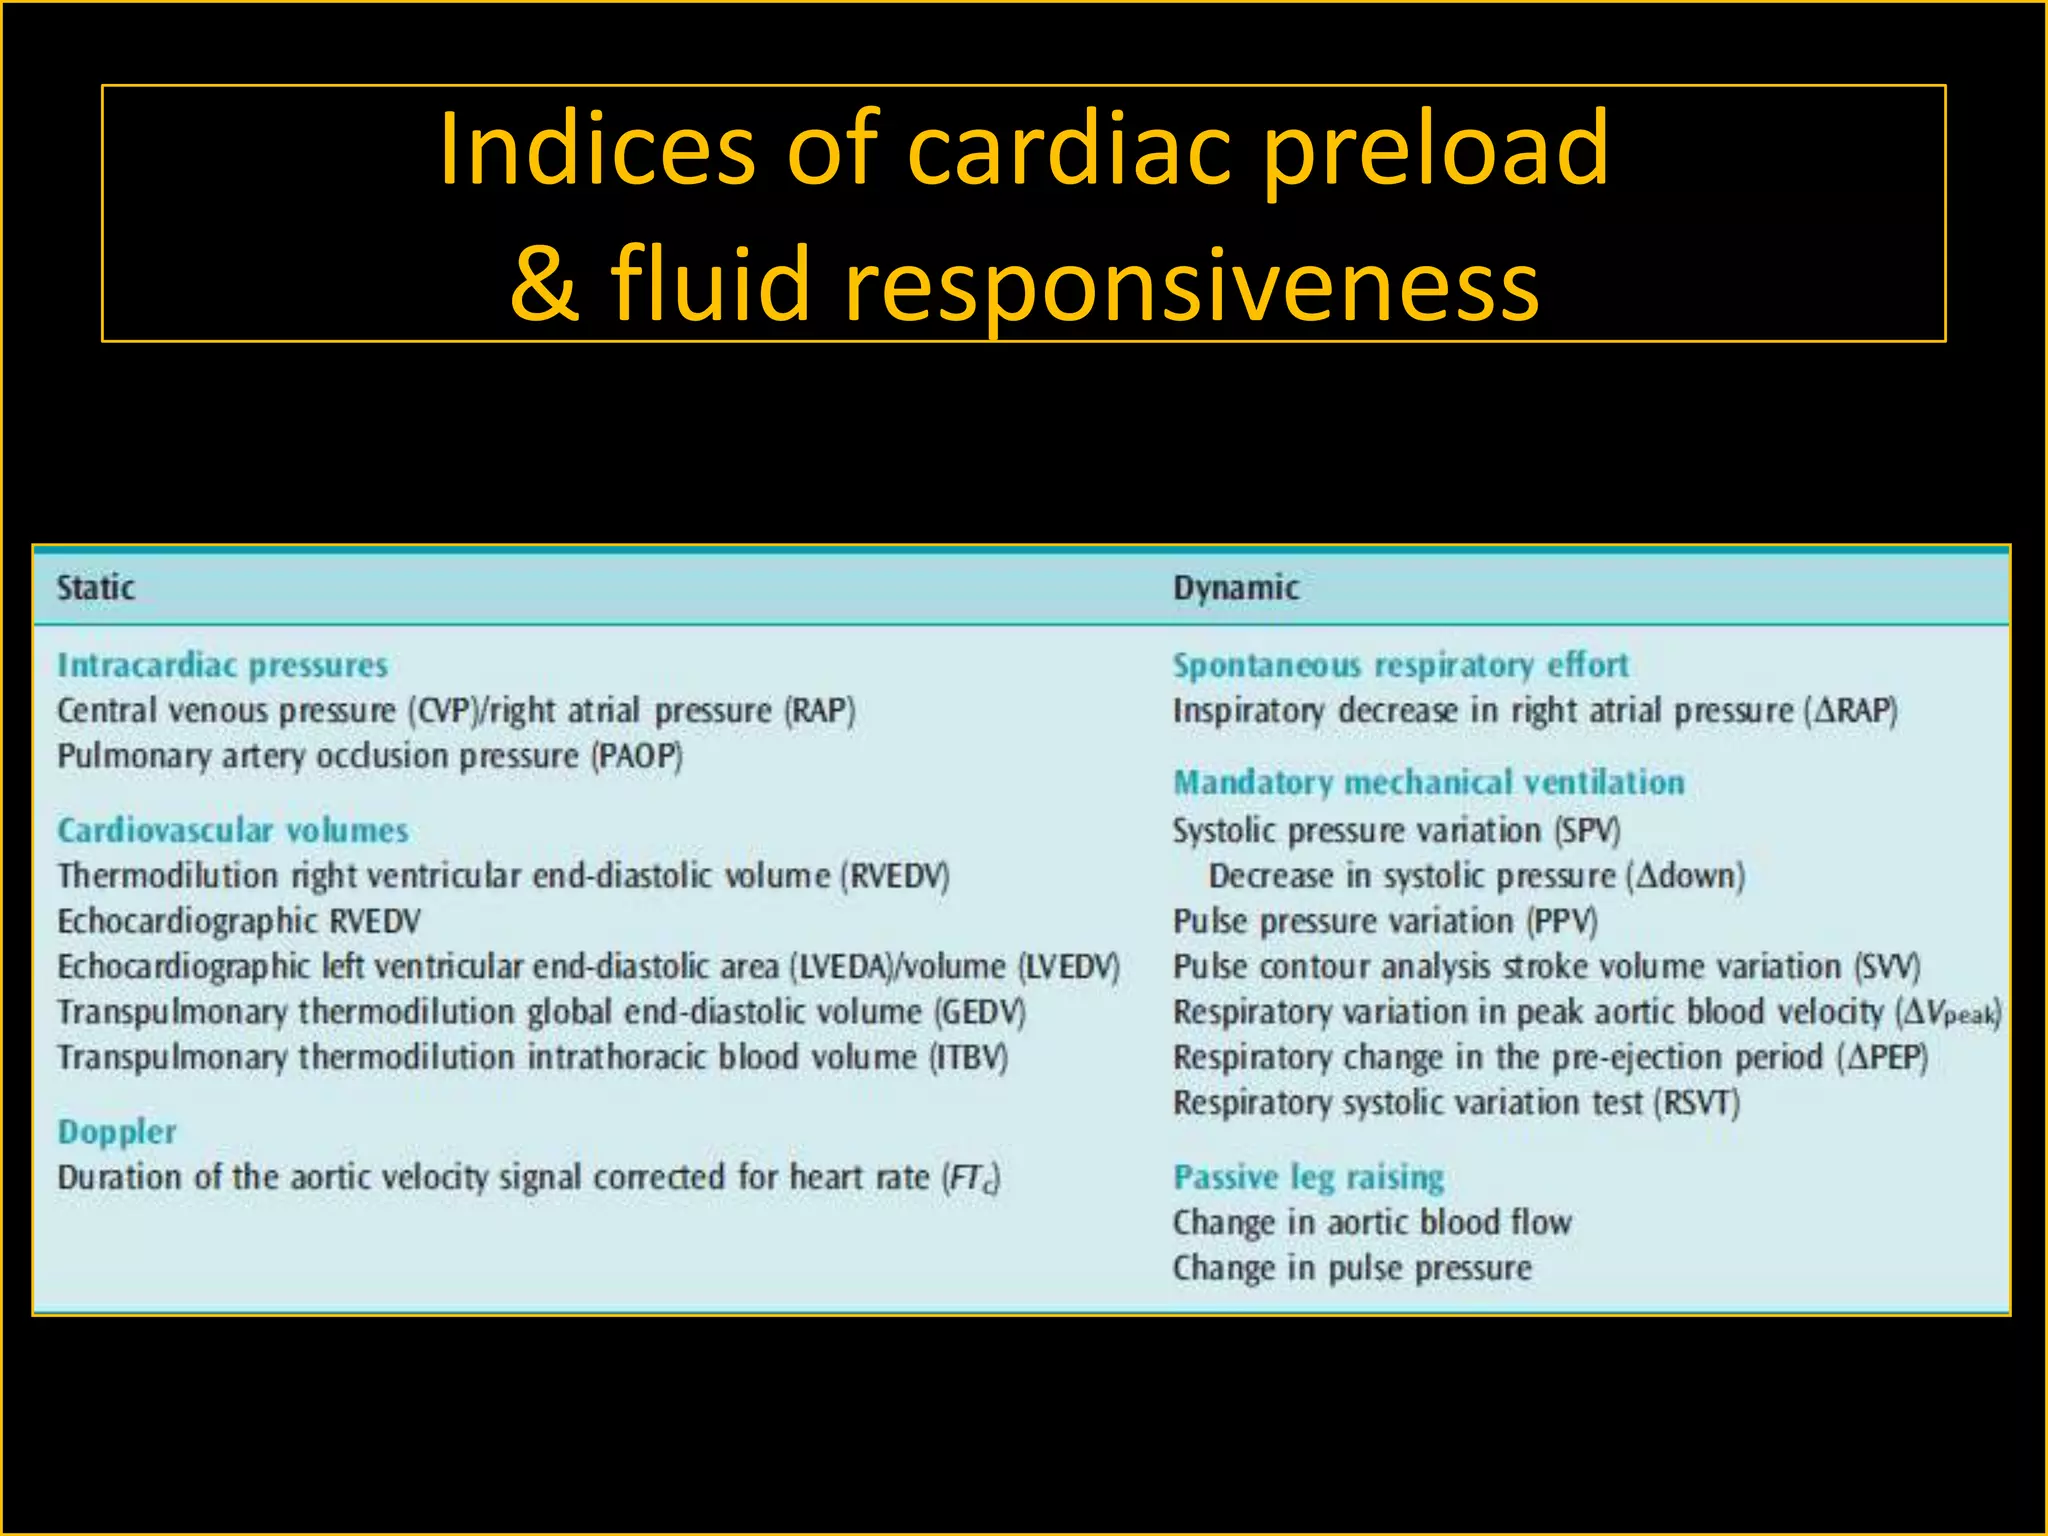

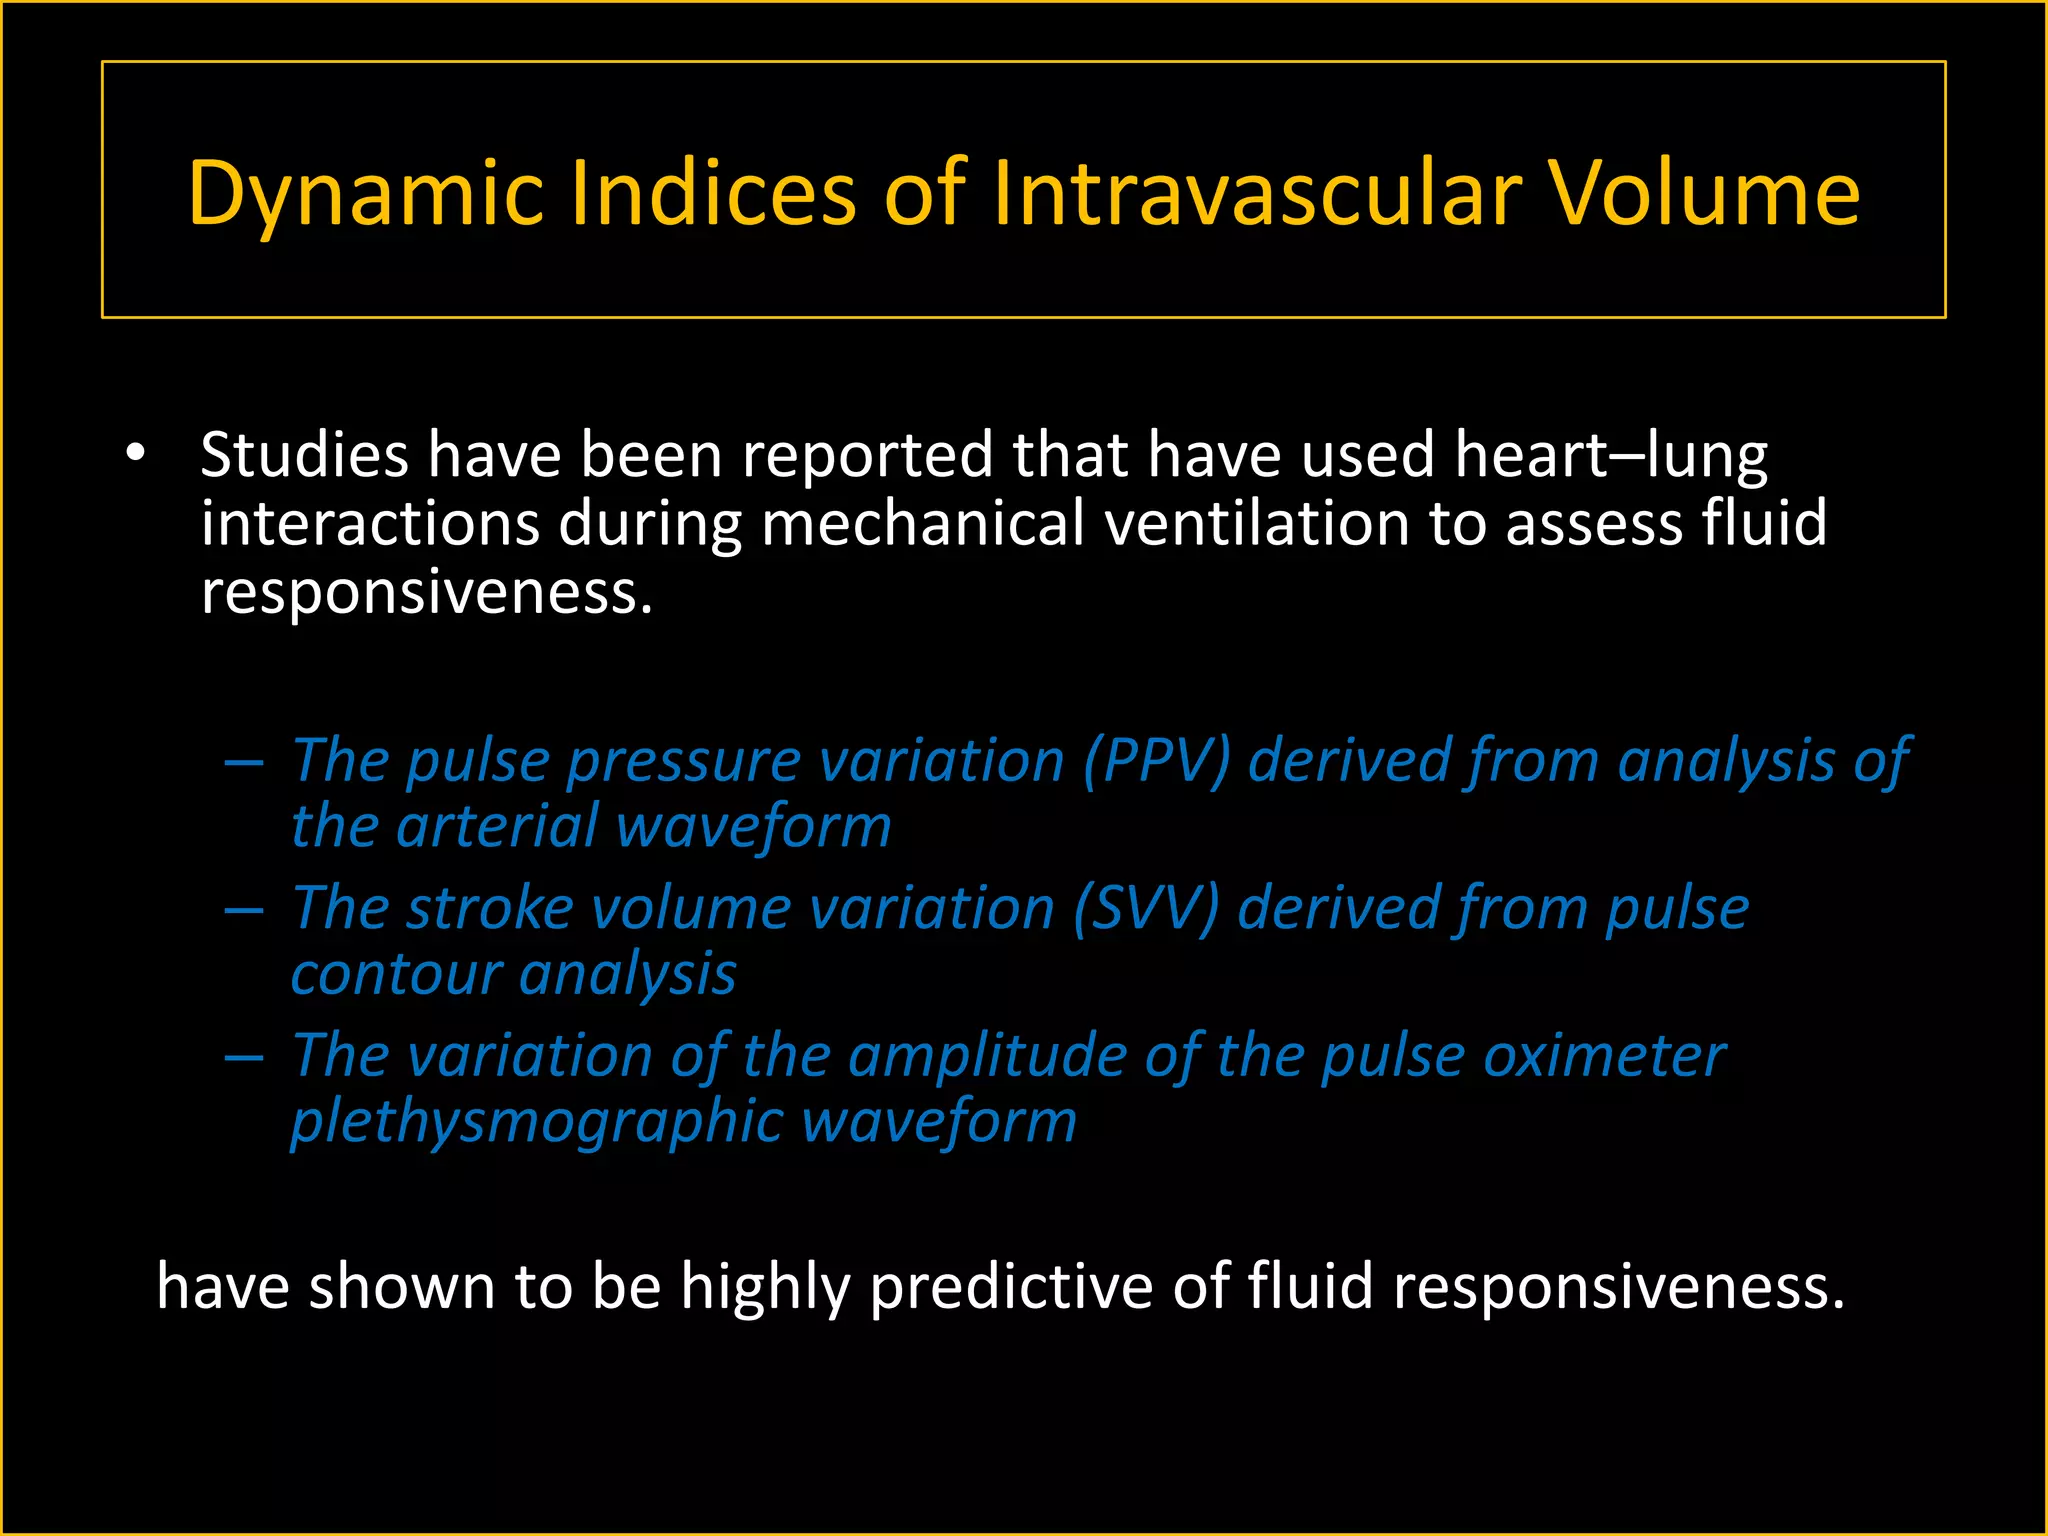
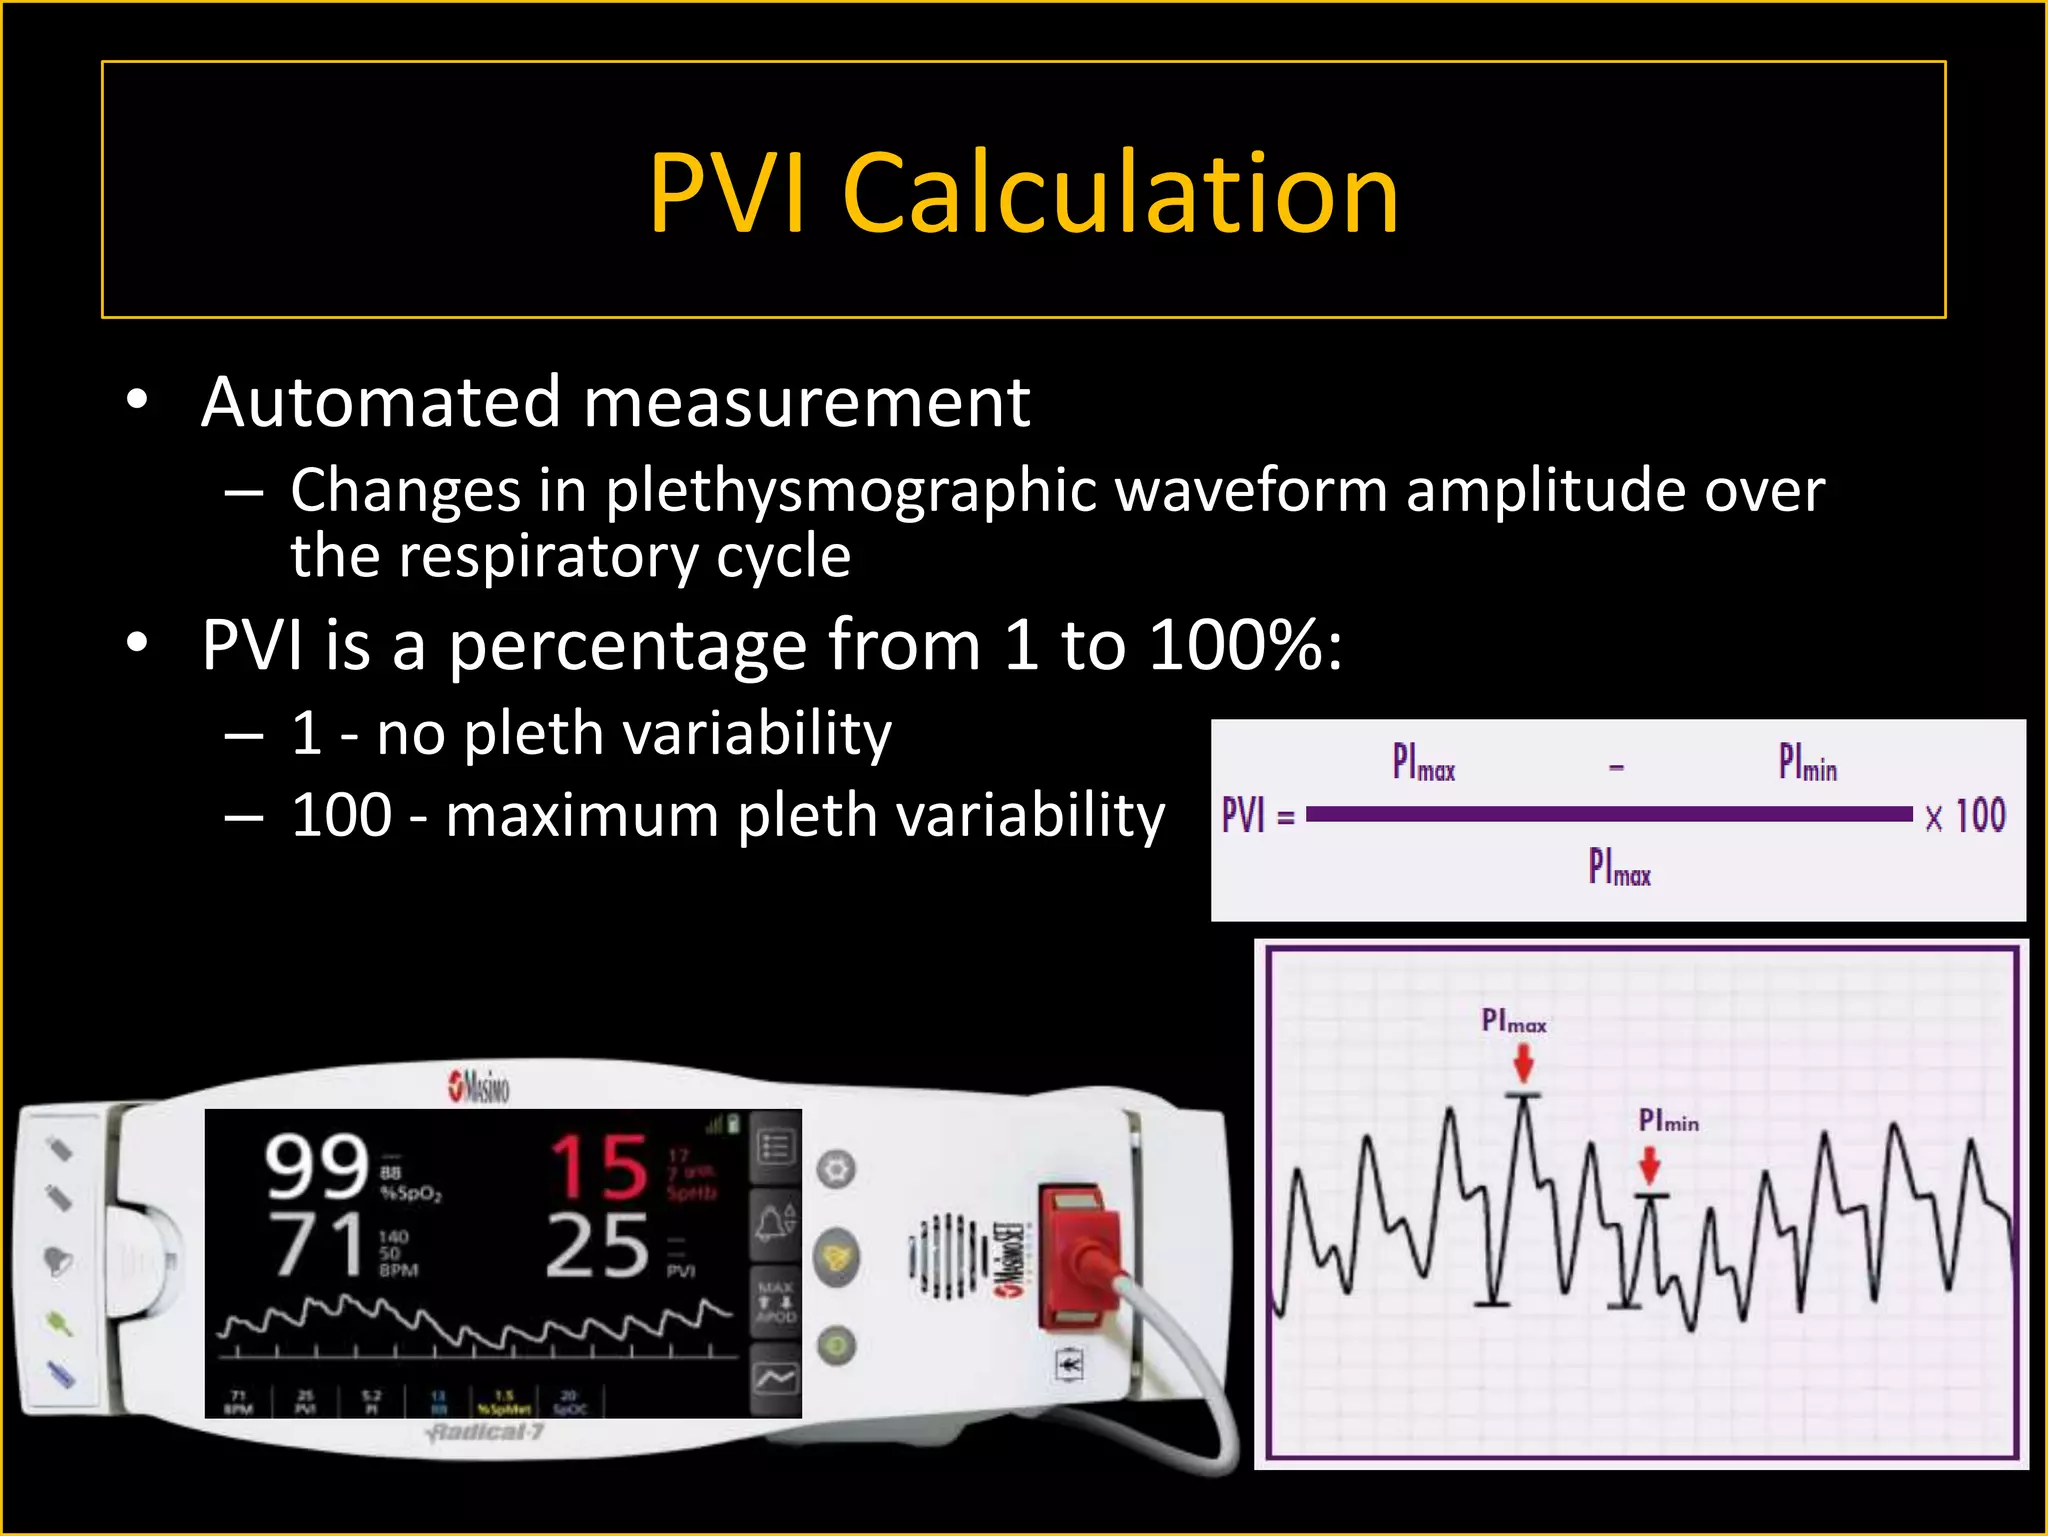
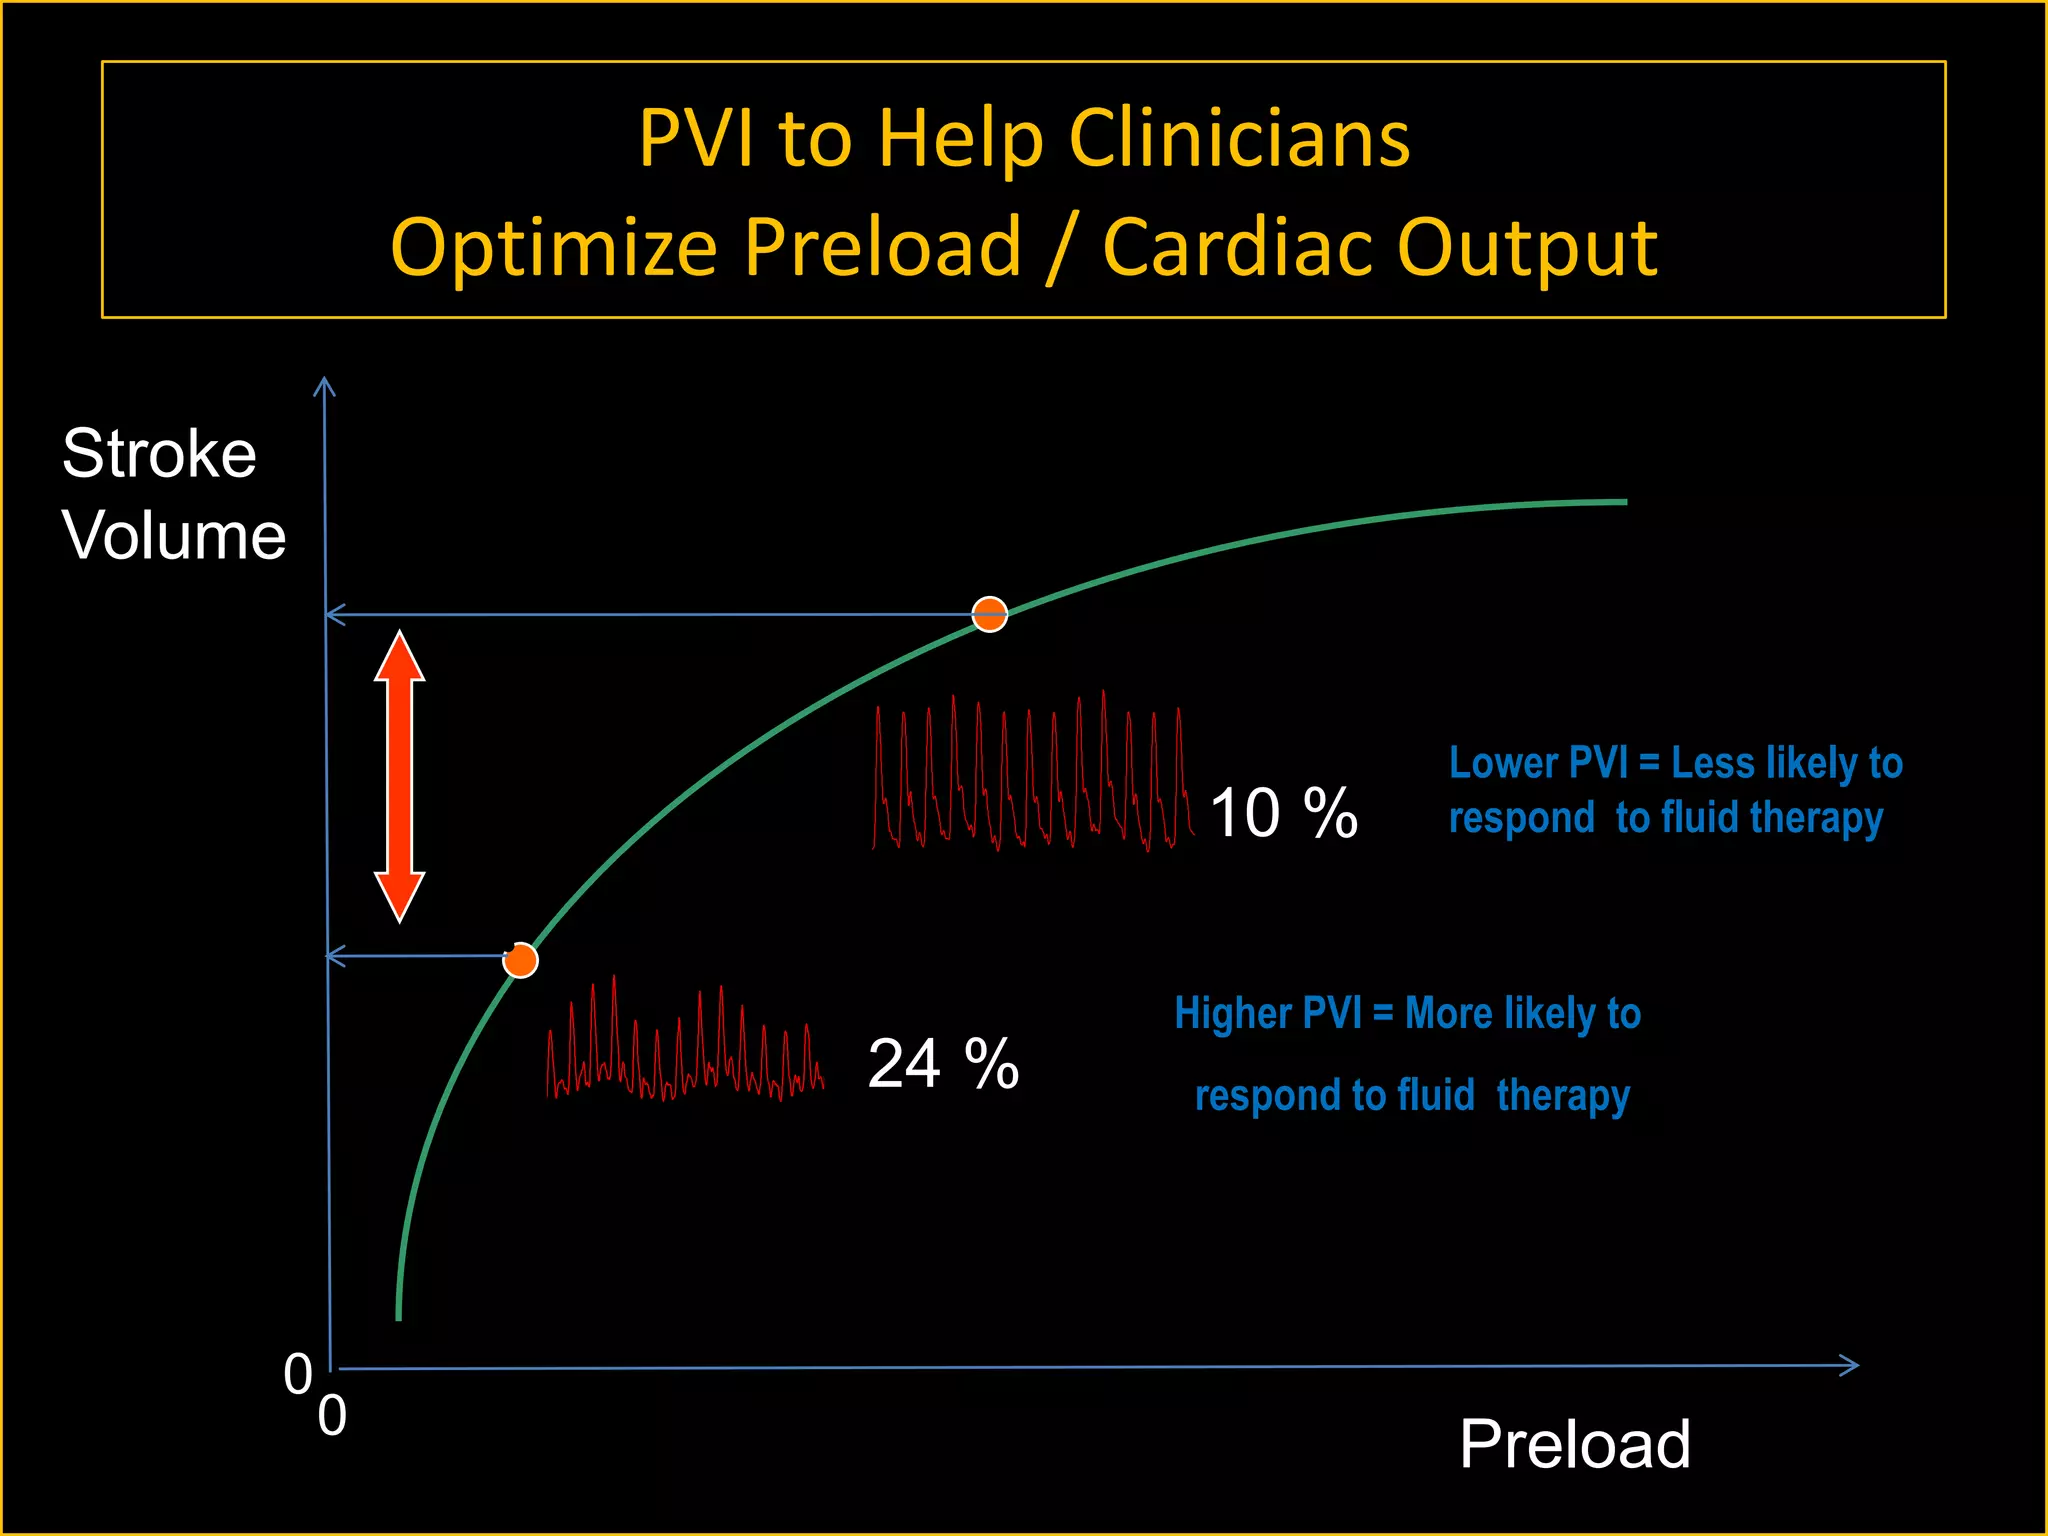
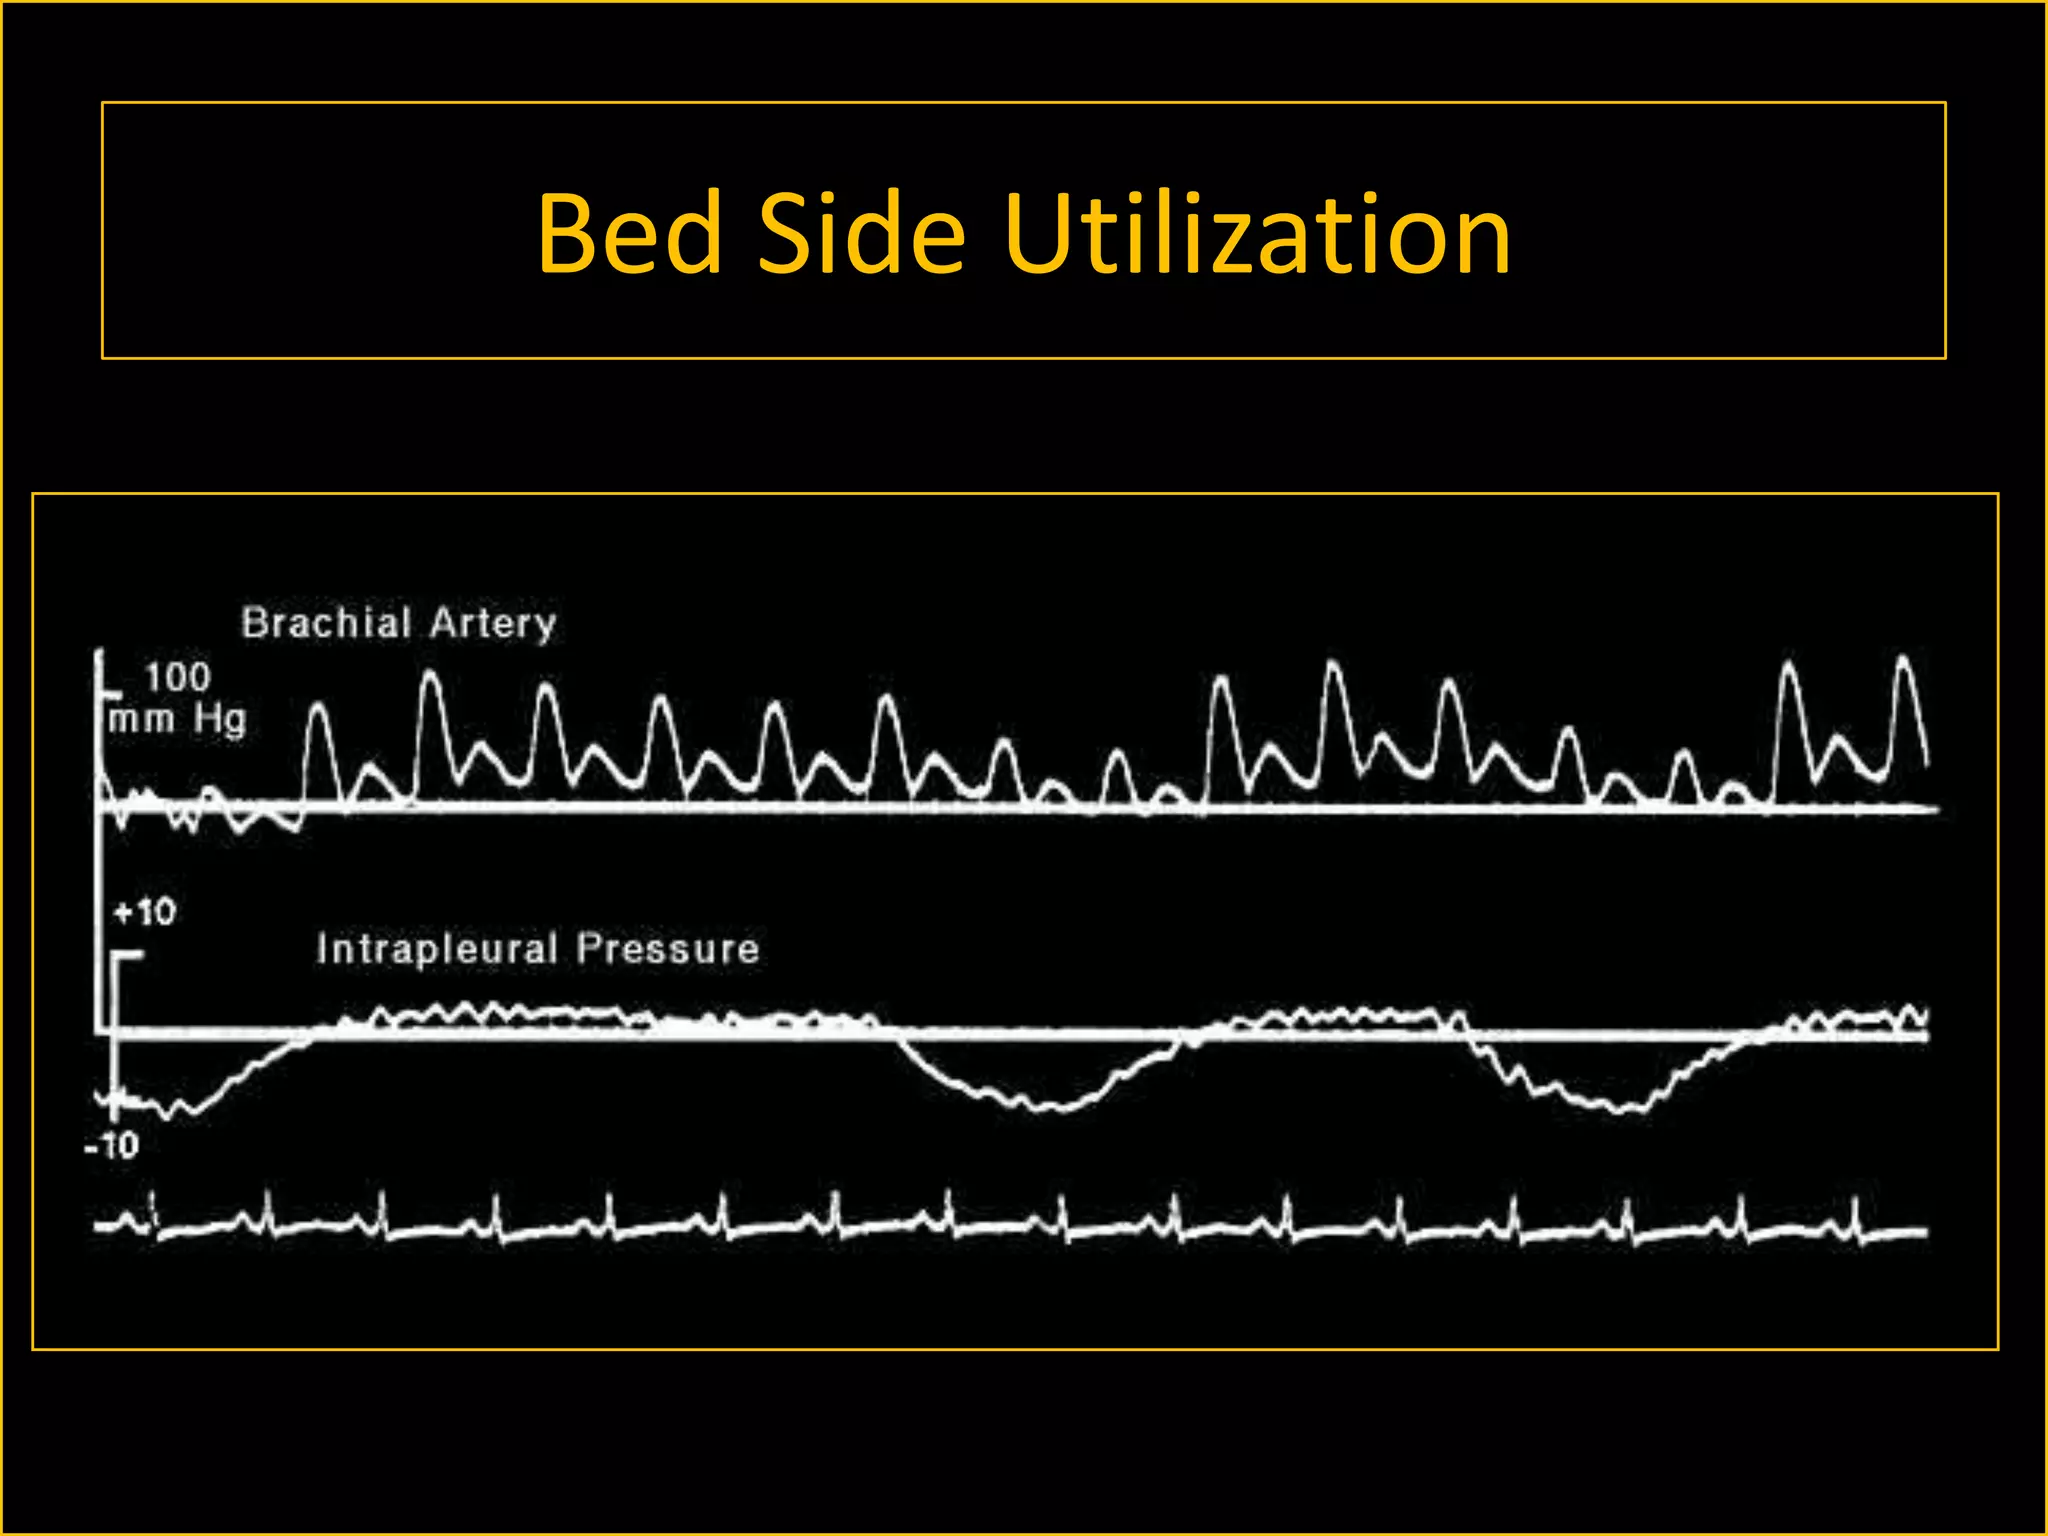
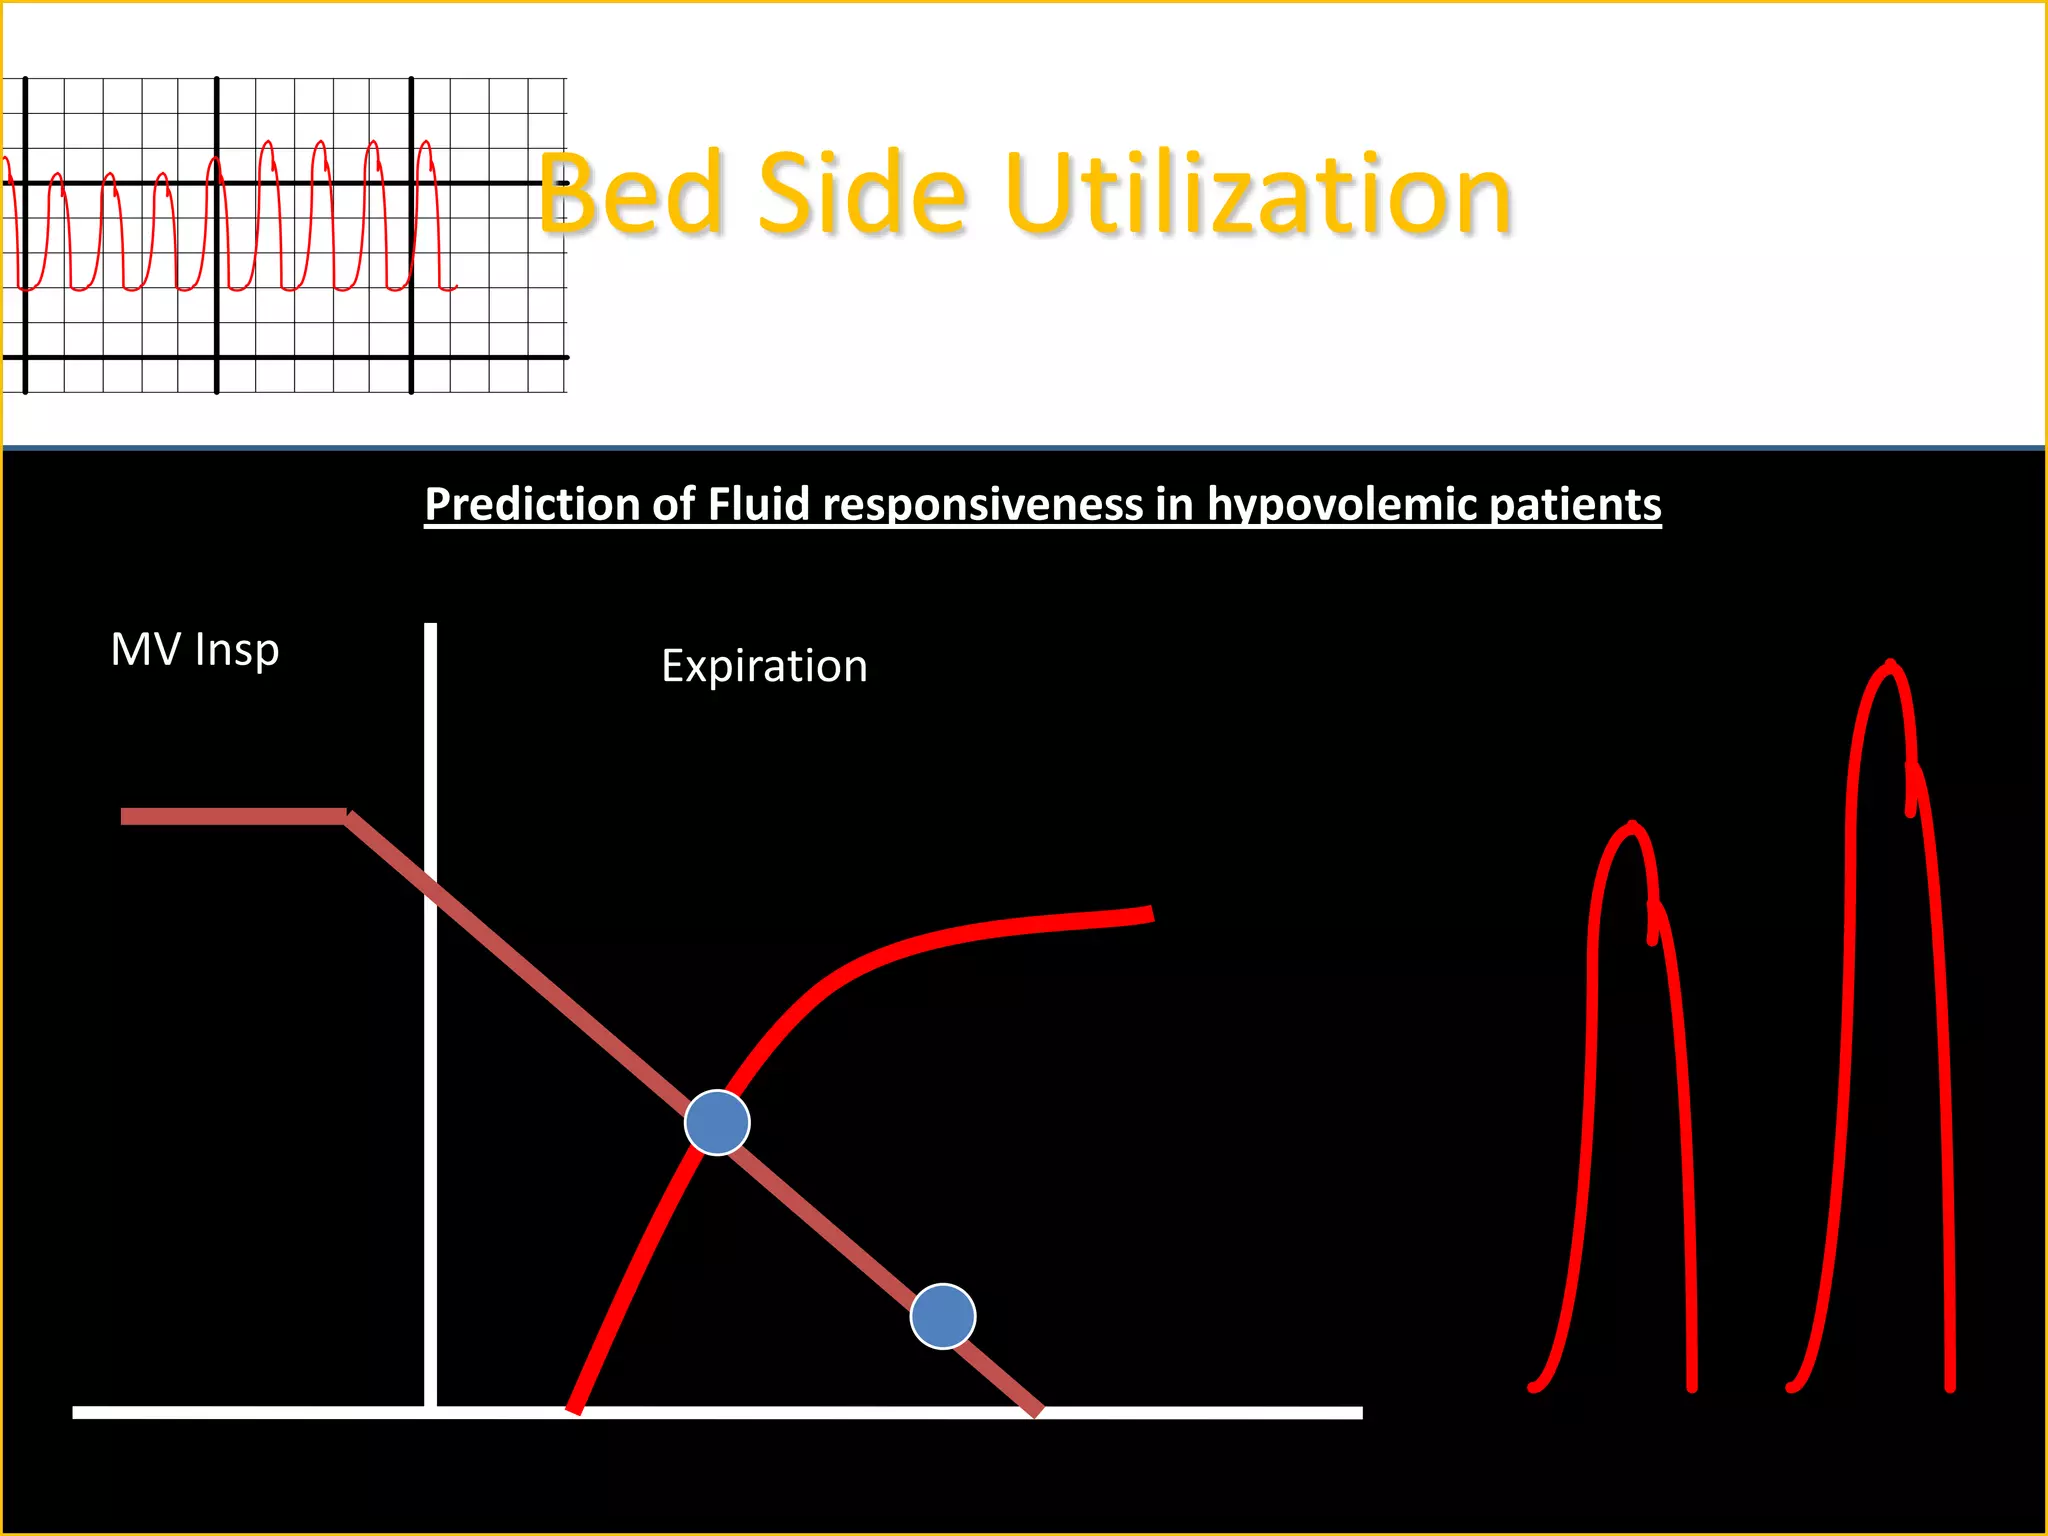
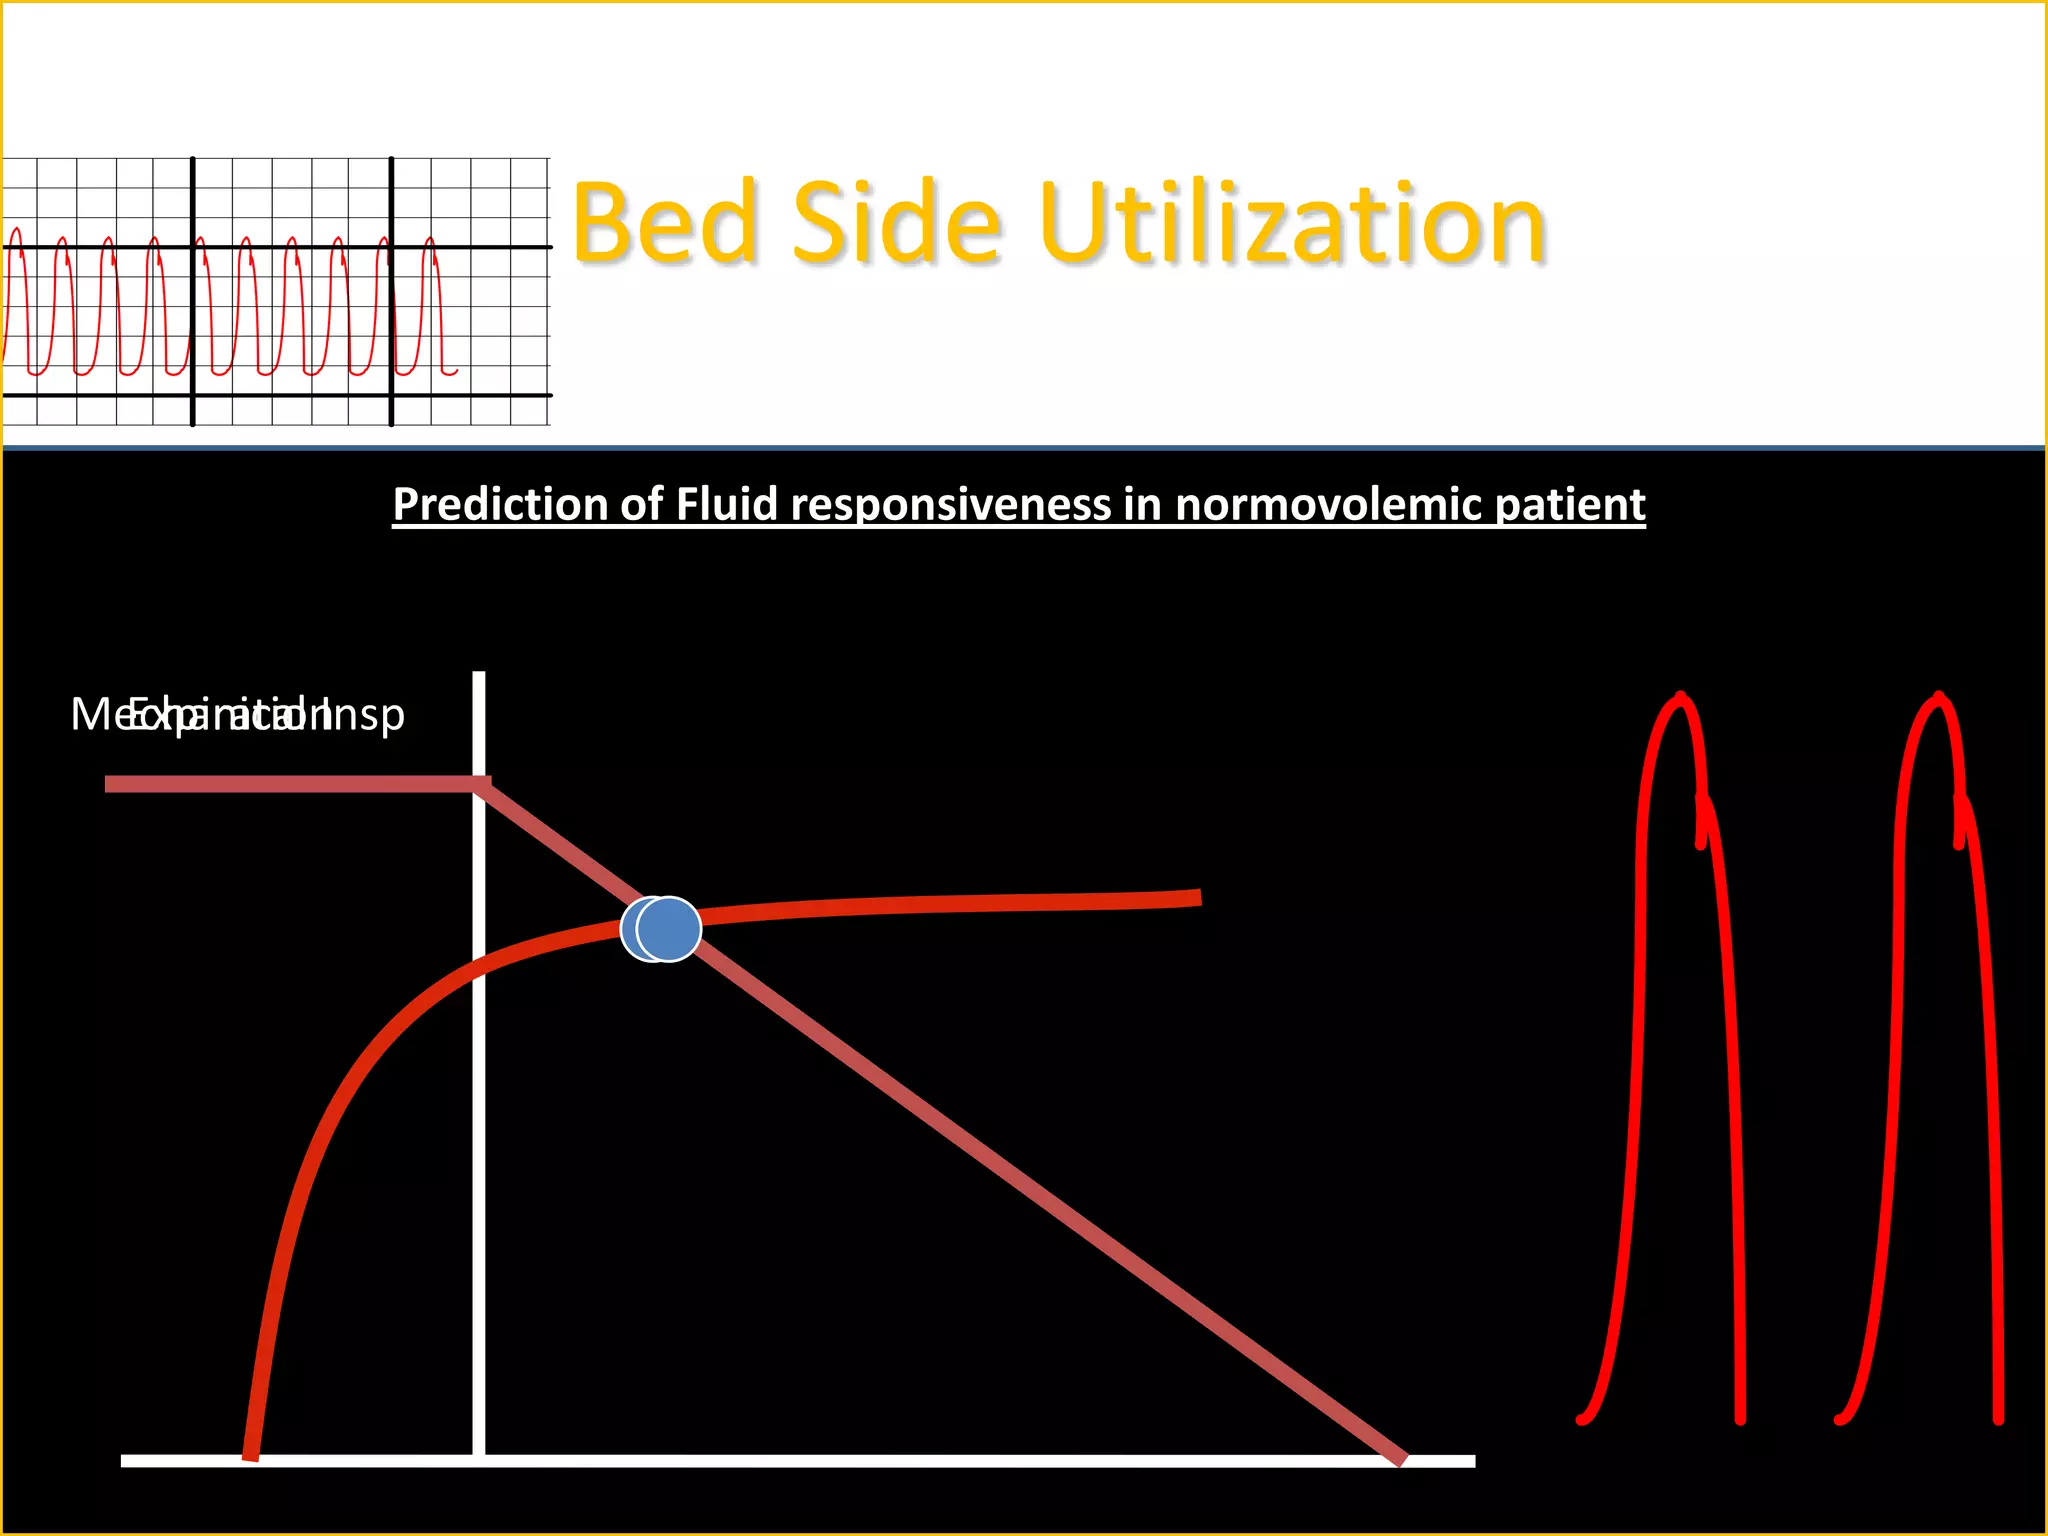
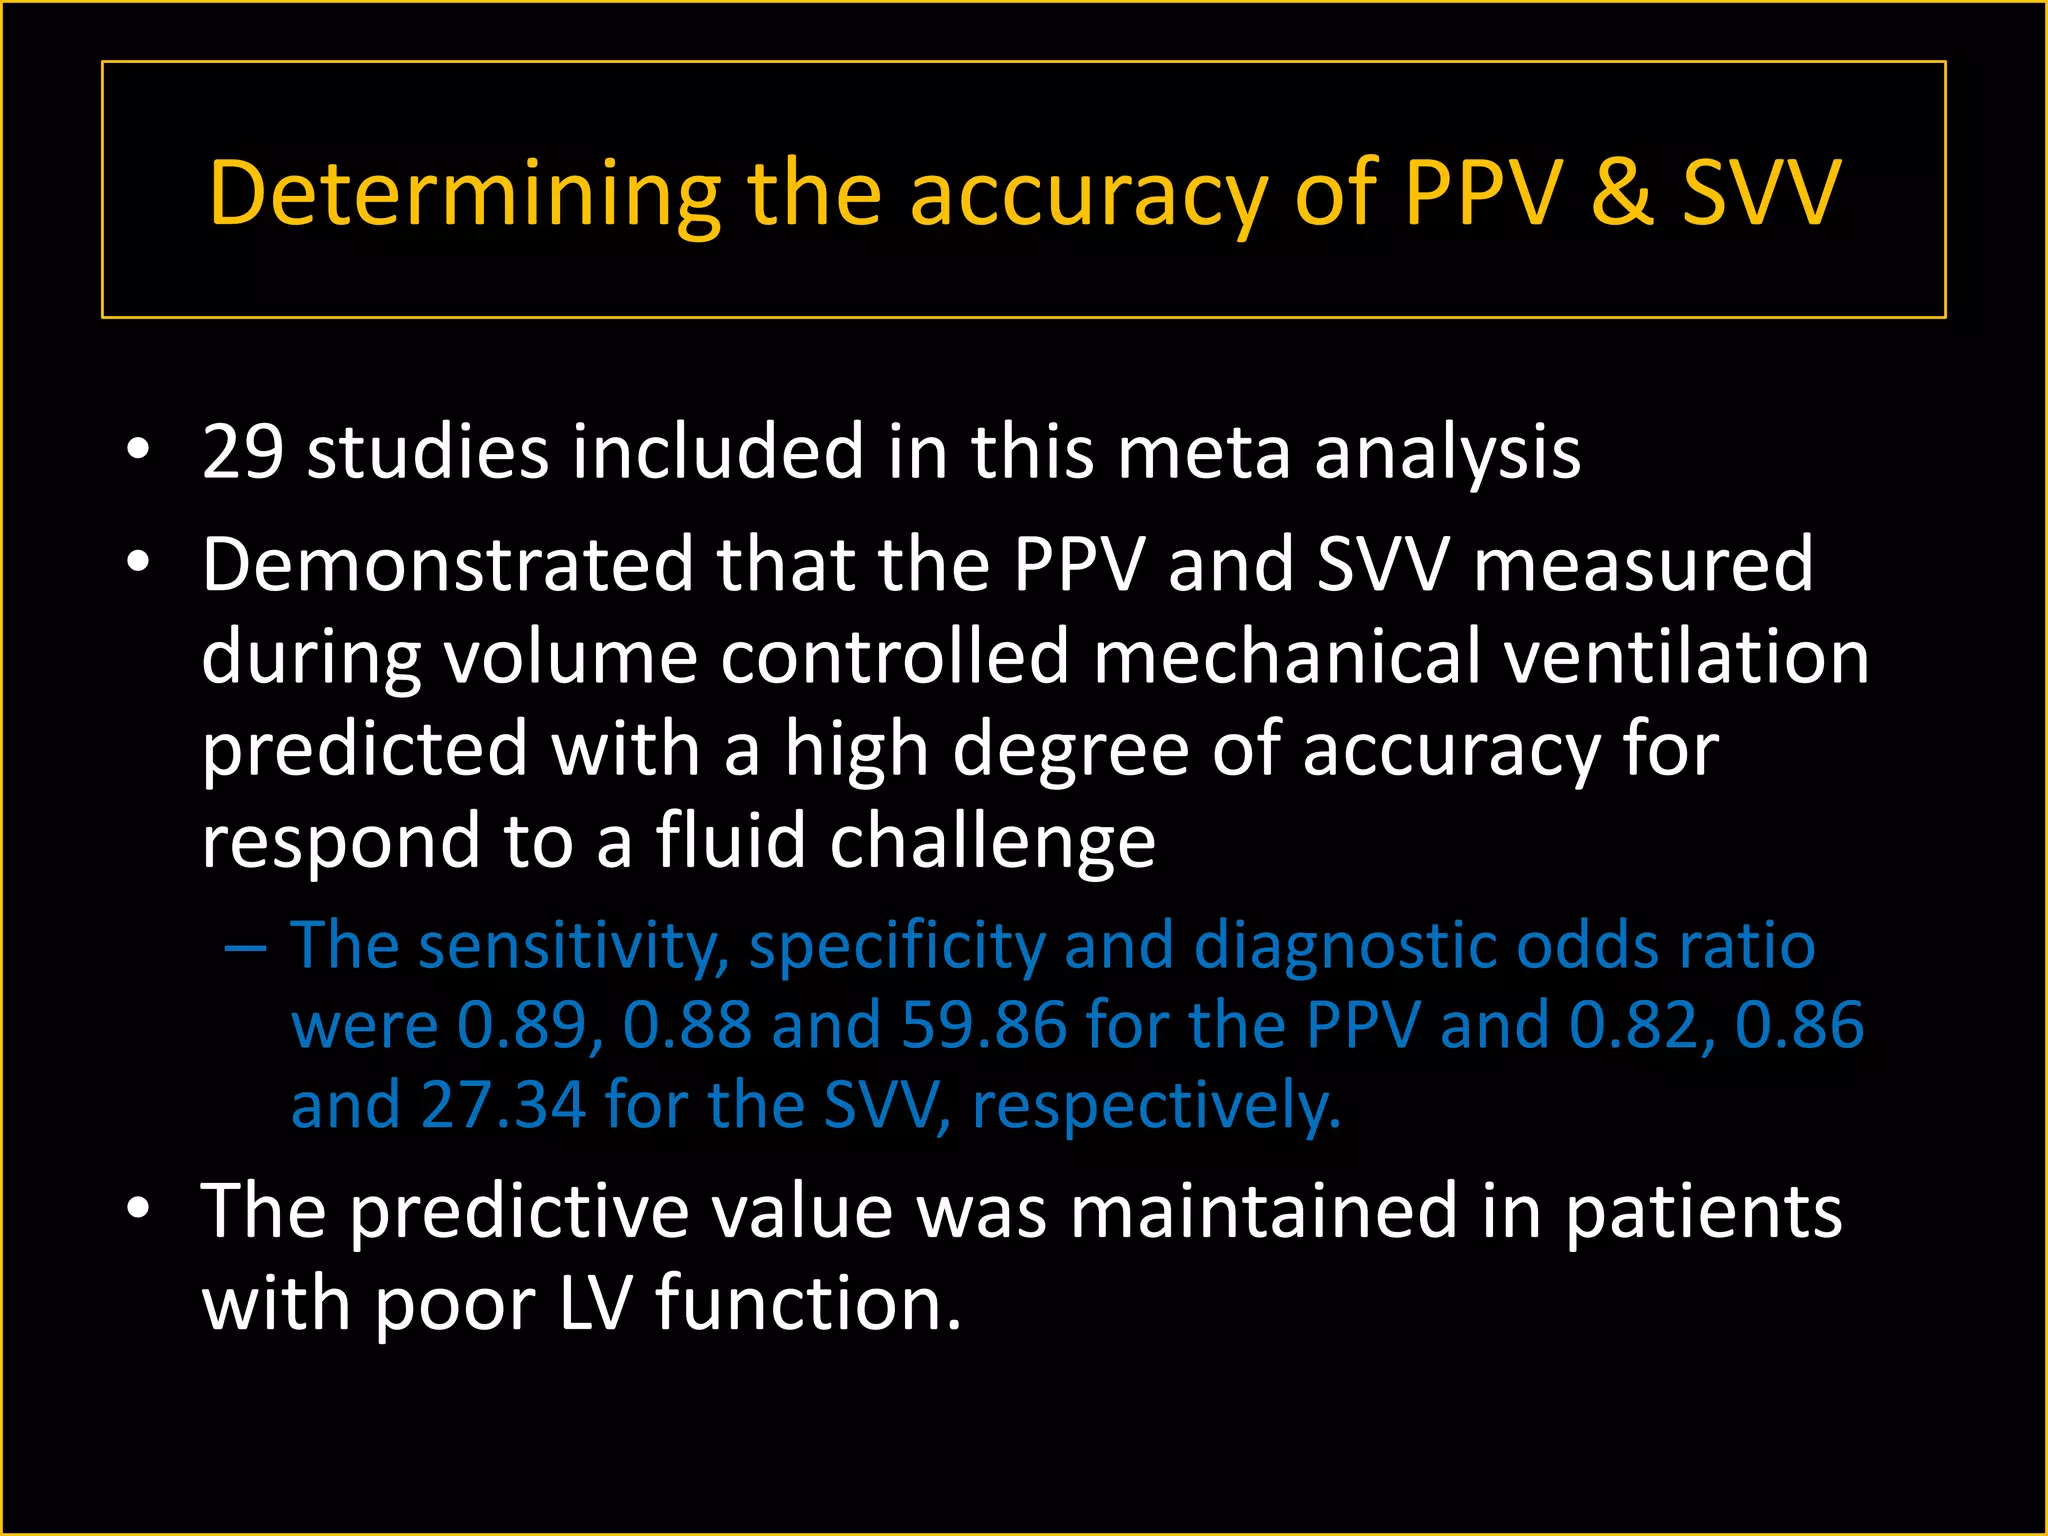
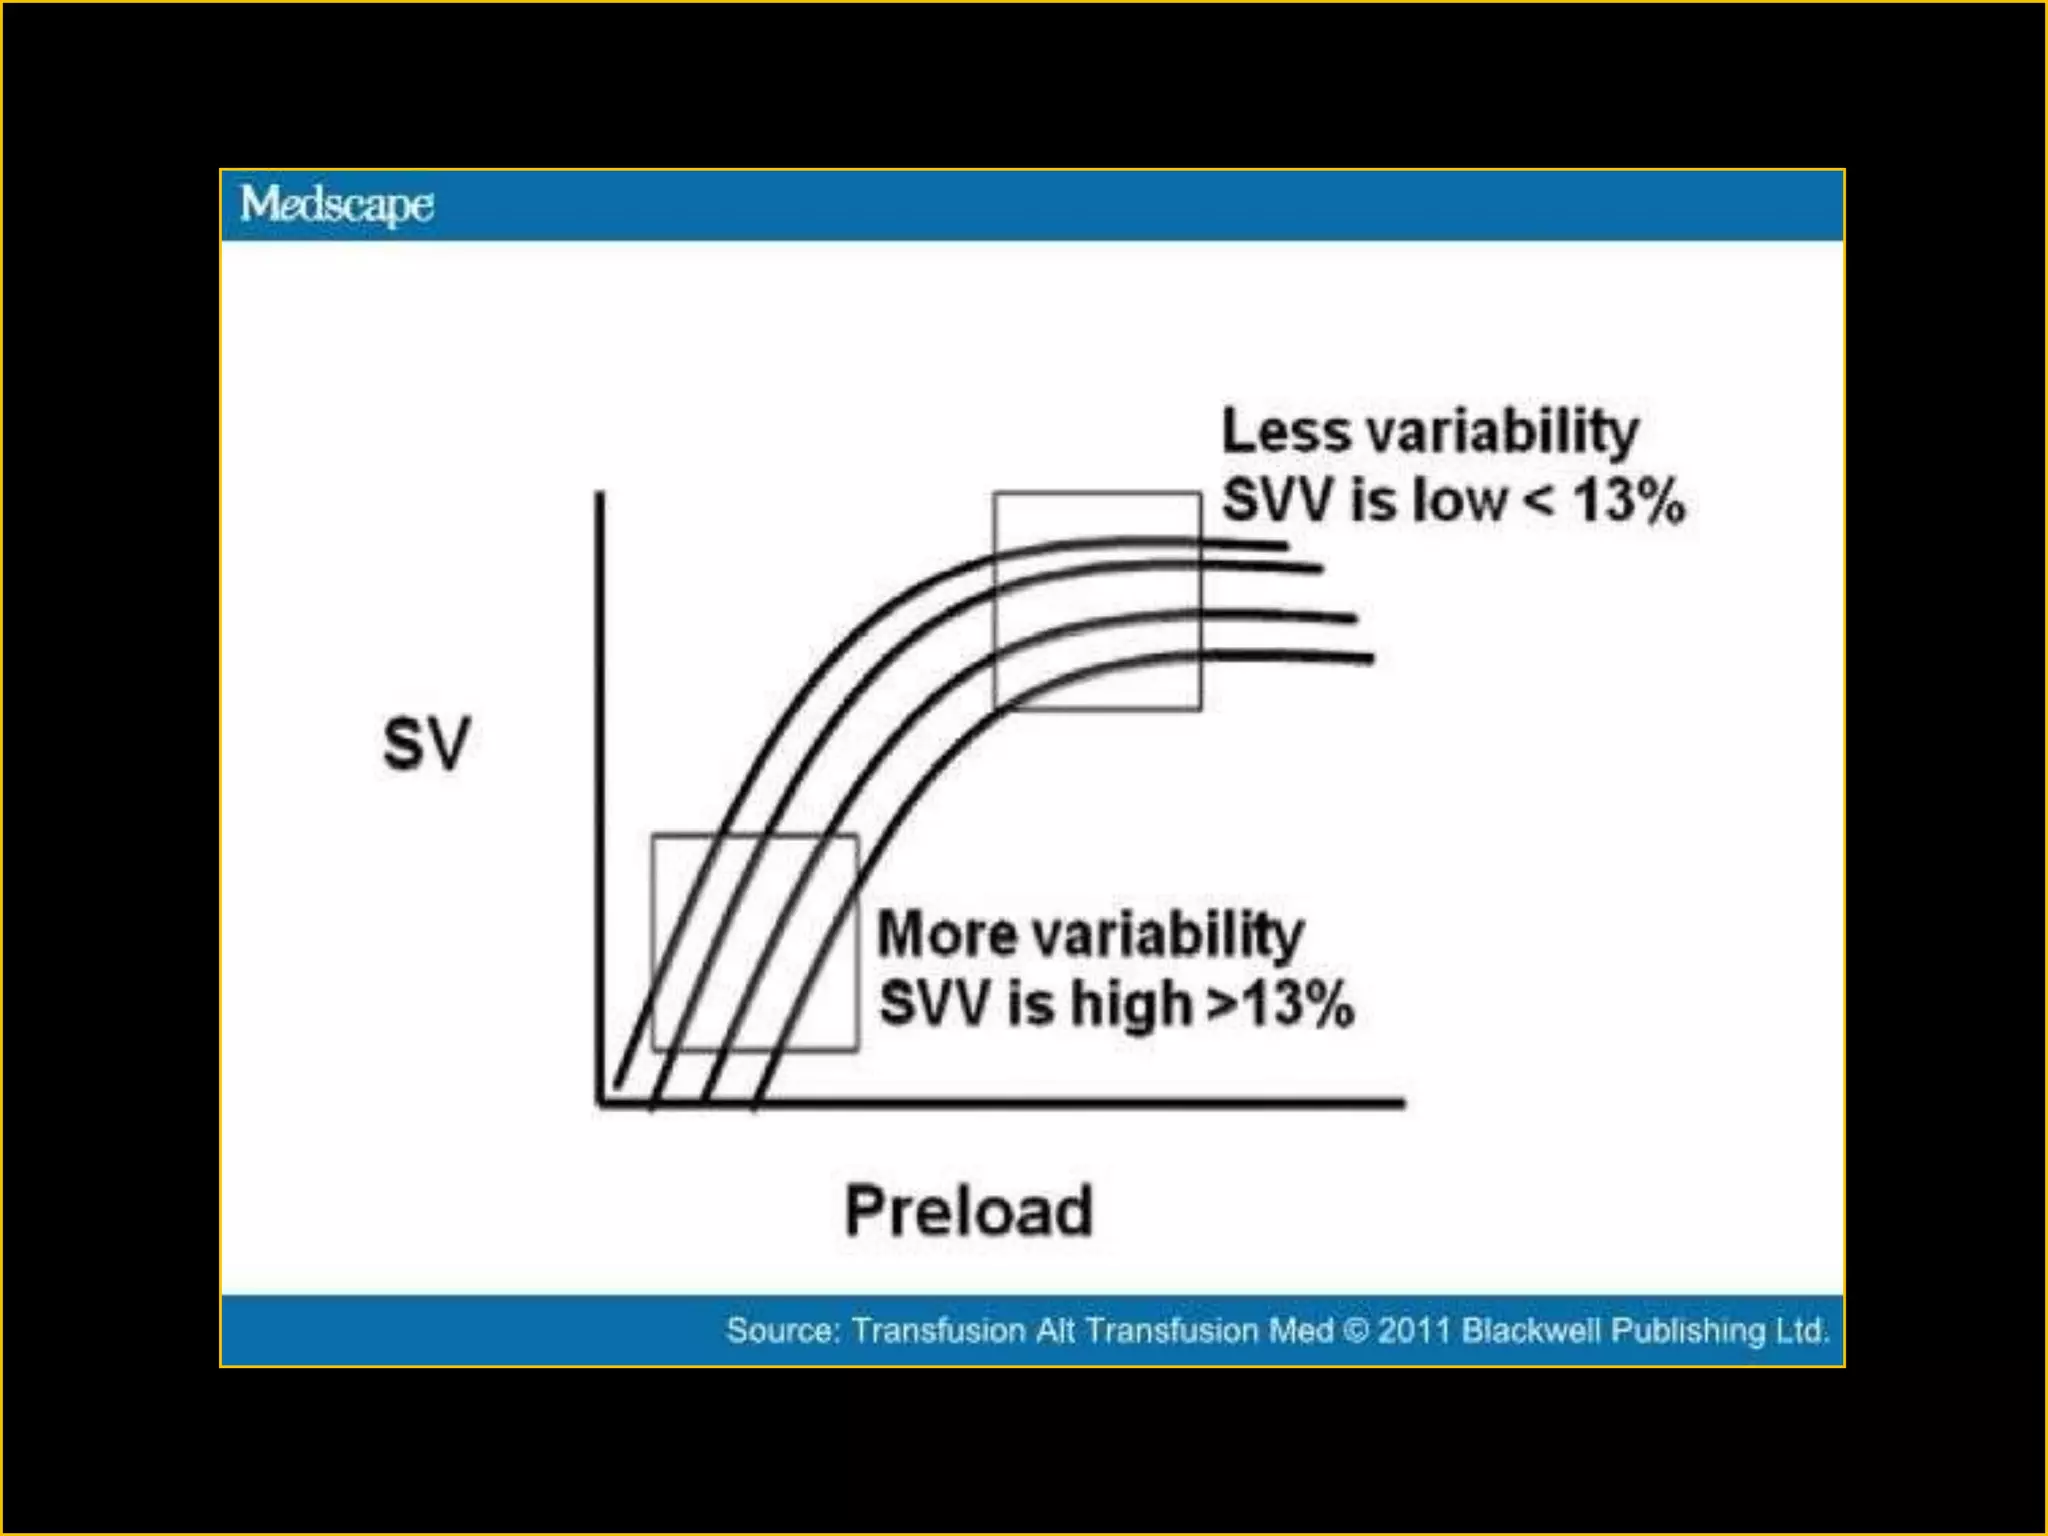
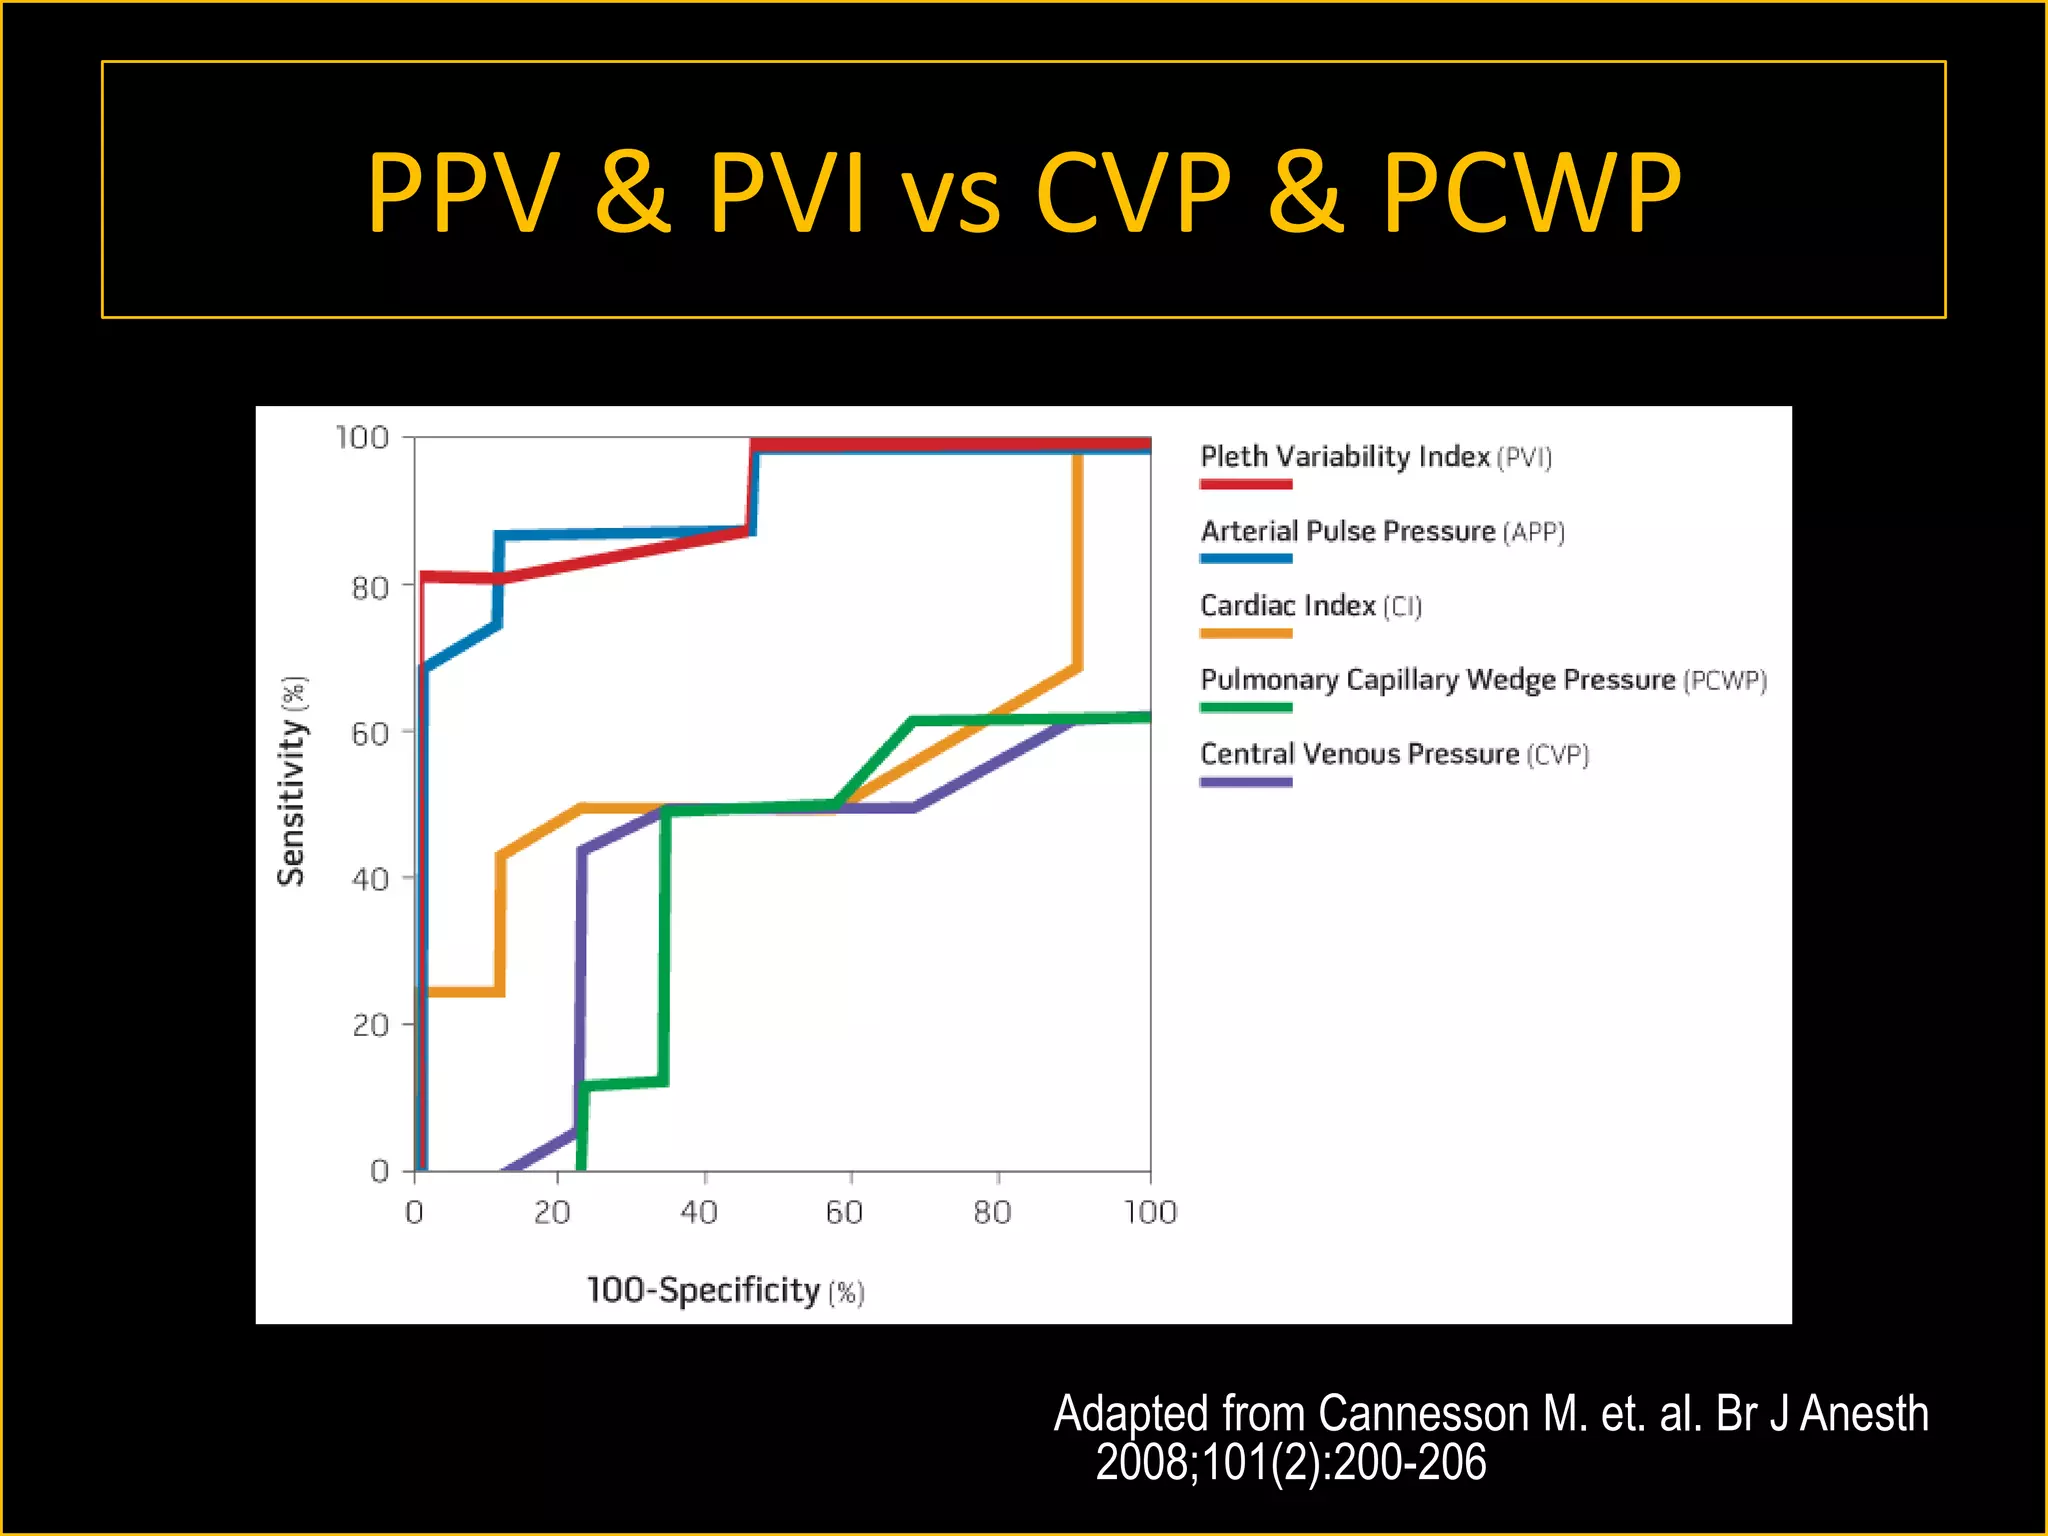
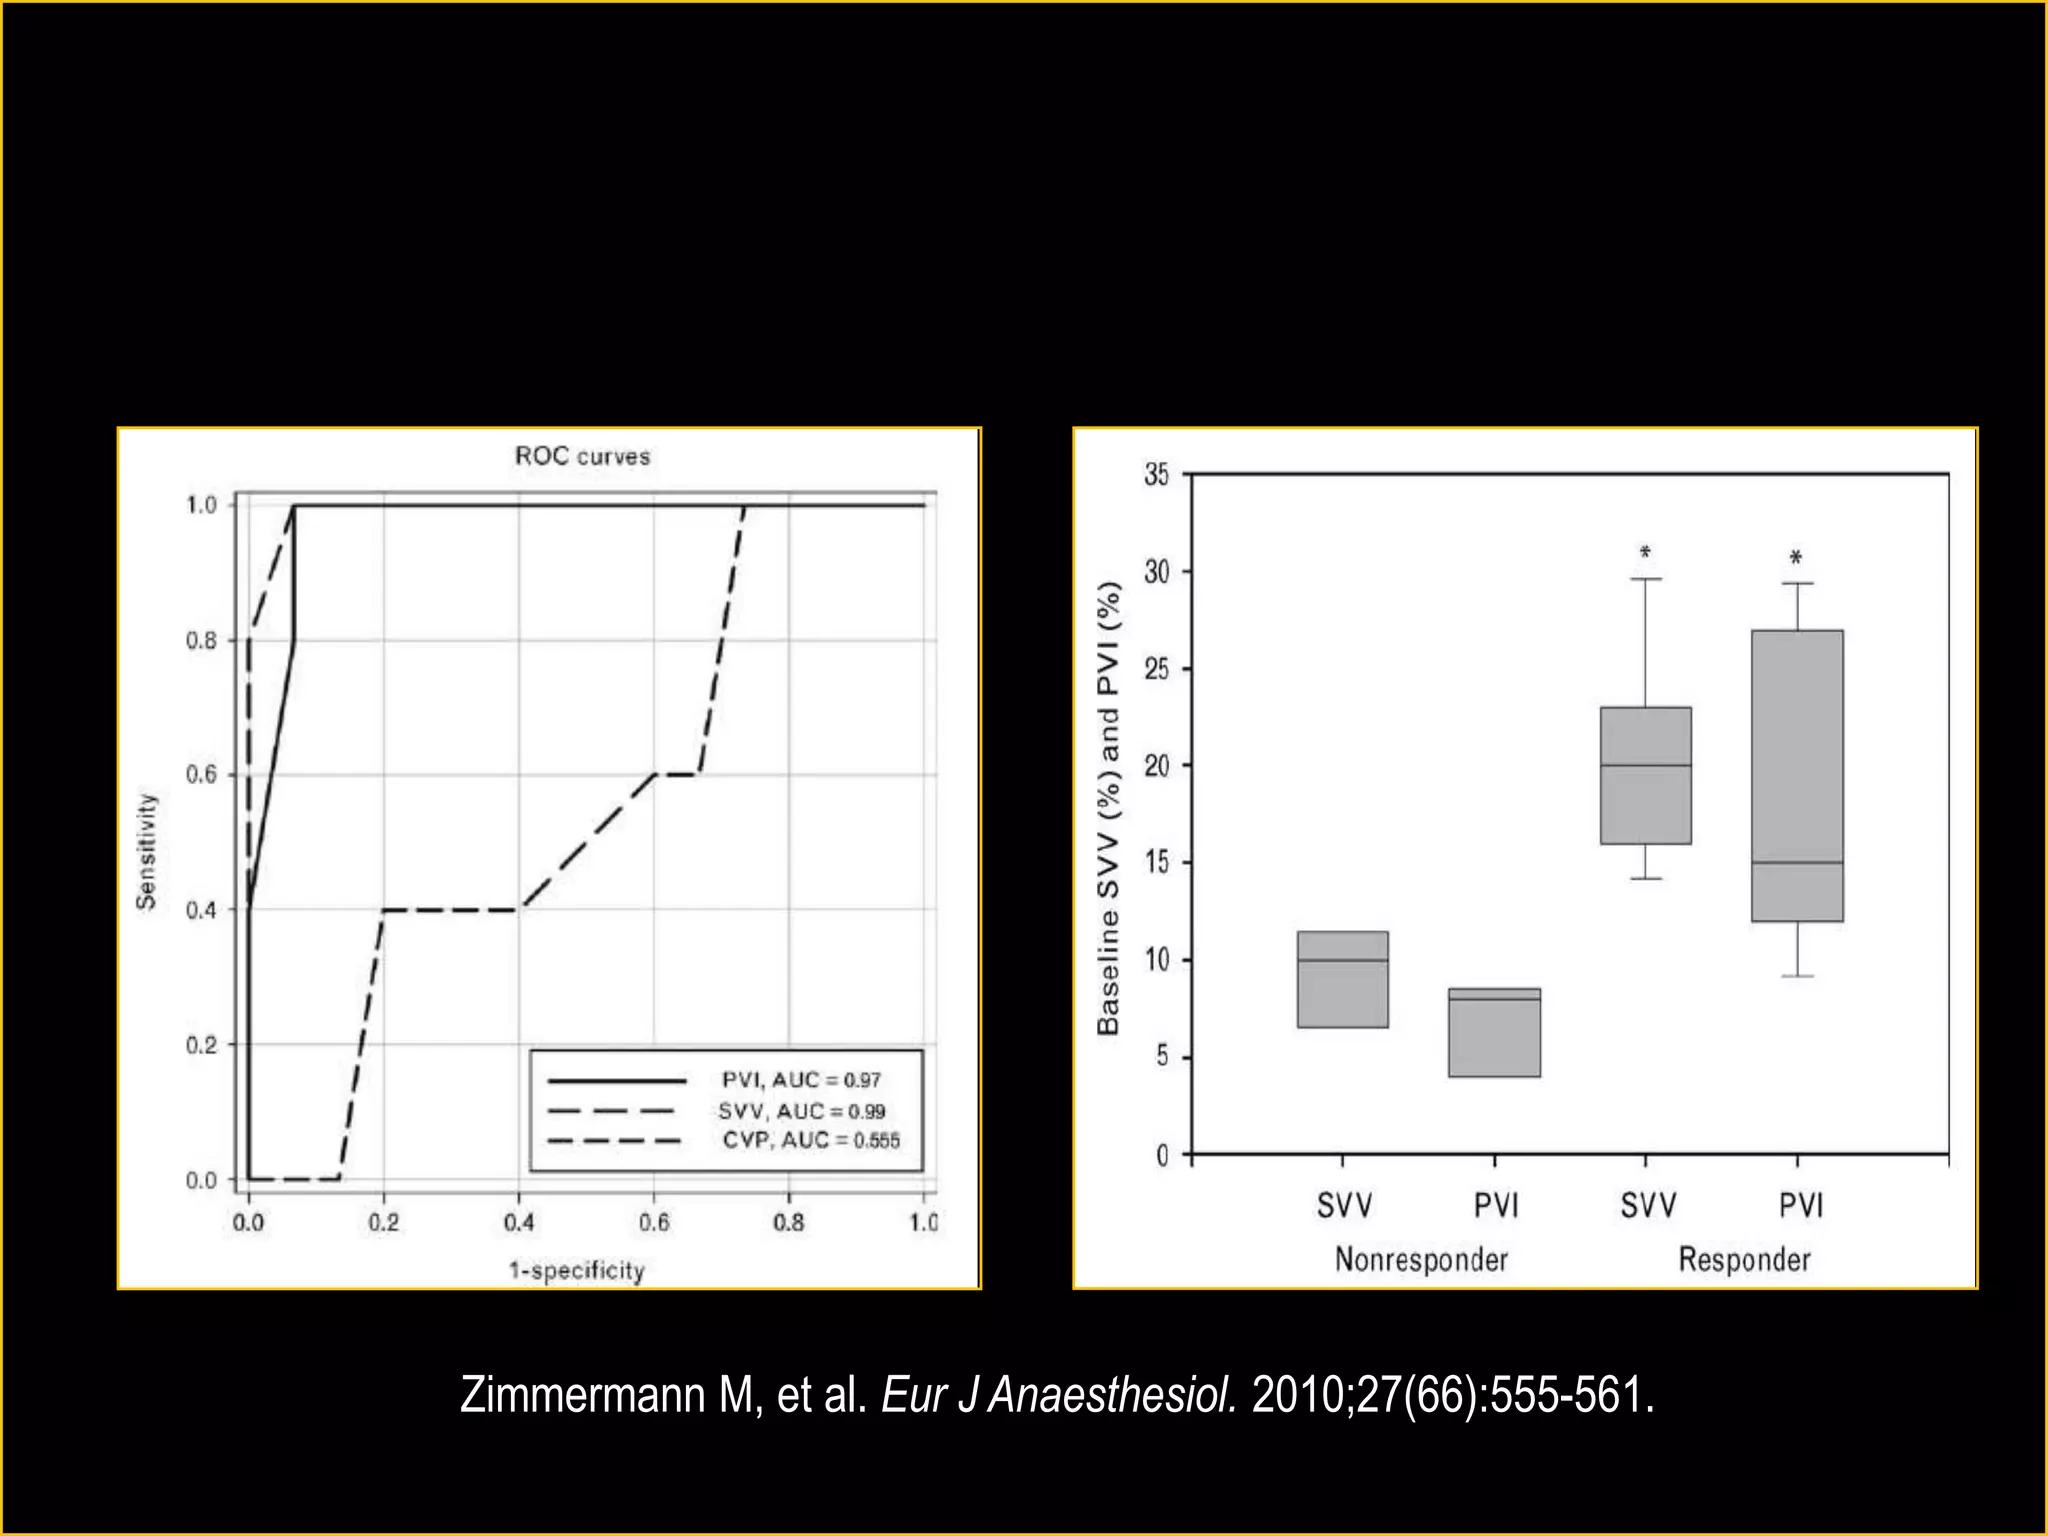
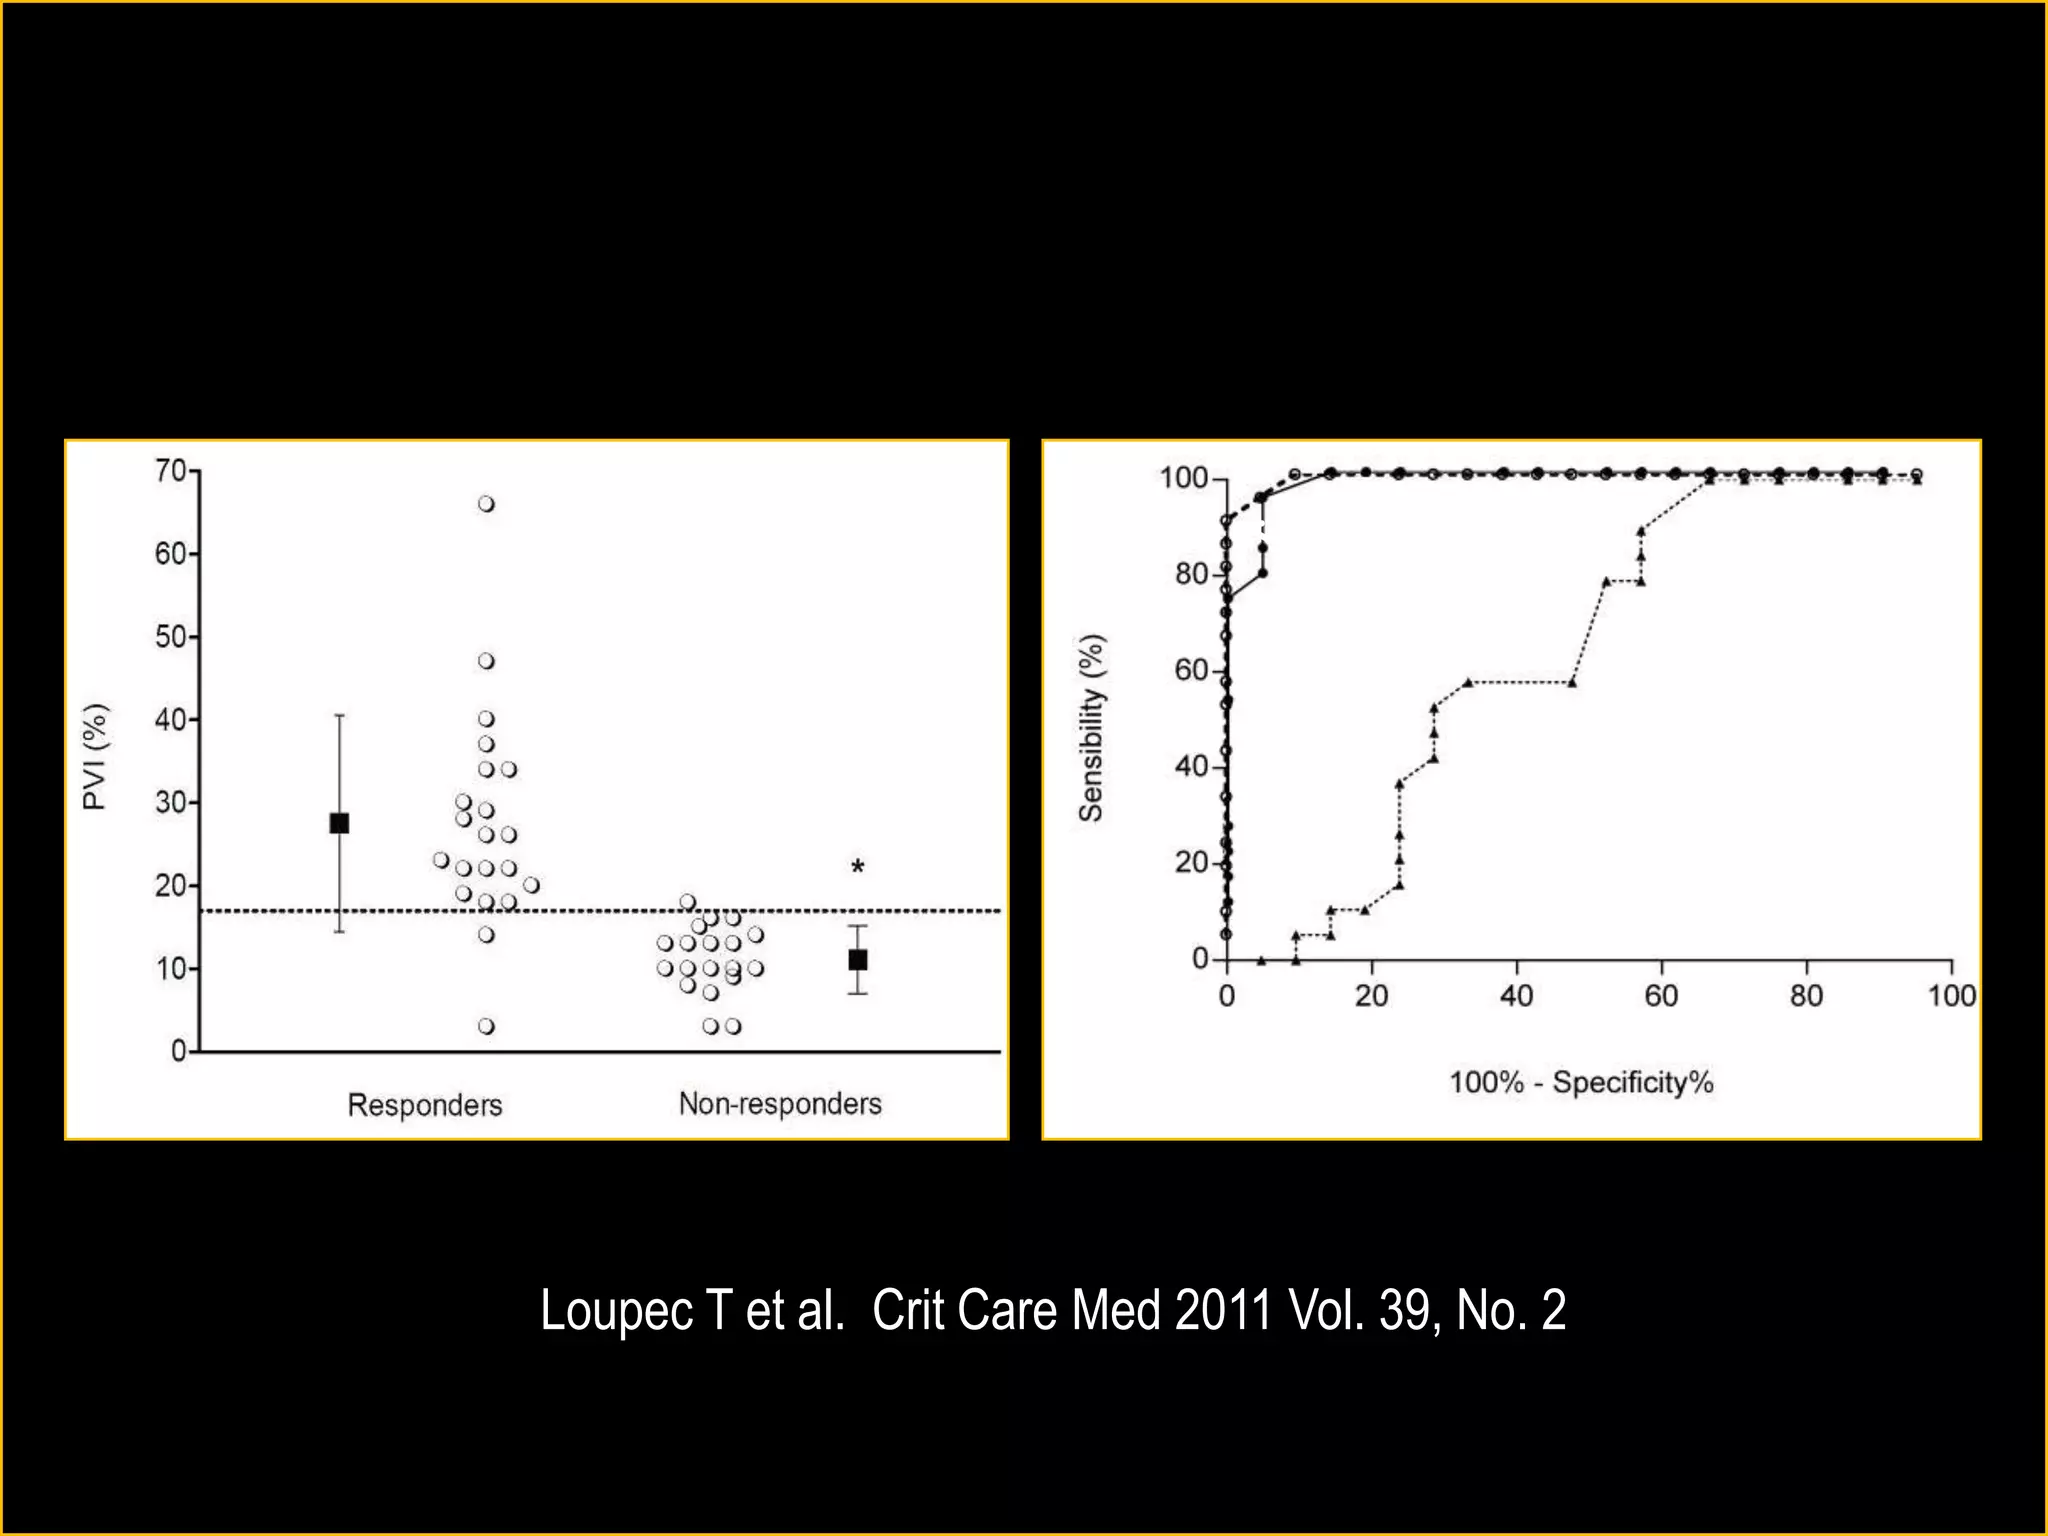


The document discusses the complexities of assessing intravascular volume and the importance of fluid therapy in resuscitating hemodynamically unstable patients. It emphasizes the inadequacies of traditional markers such as central venous pressure (CVP) and examines alternative indicators of fluid responsiveness, including pulse pressure variation, stroke volume variation, and plethysmography variability index. Ultimately, the document advocates for advanced monitoring techniques to optimize fluid resuscitation in critically ill patients.


