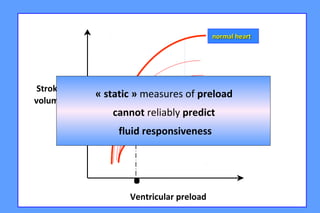
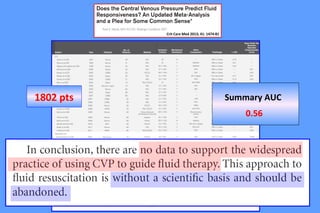
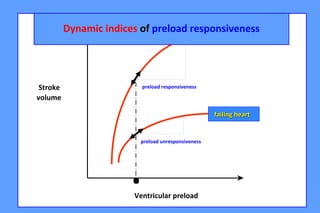
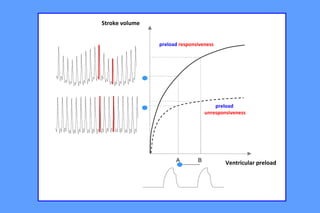
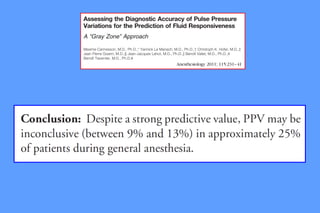
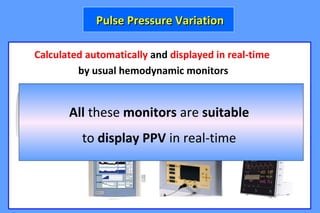
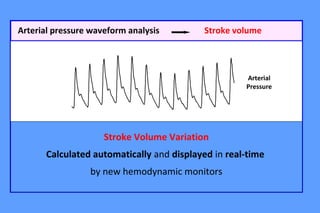
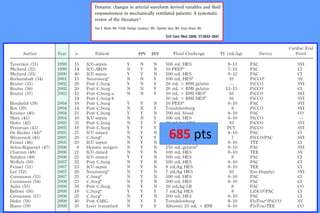
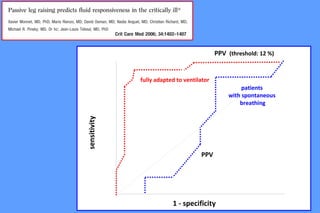
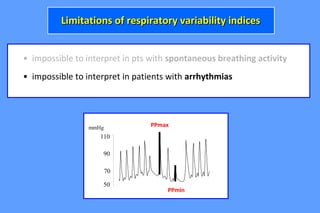
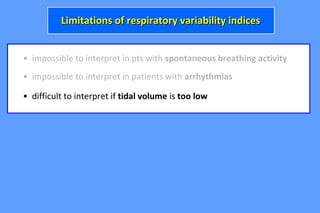
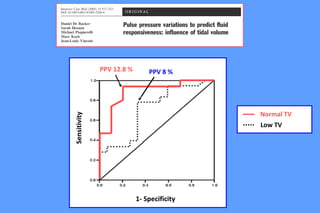
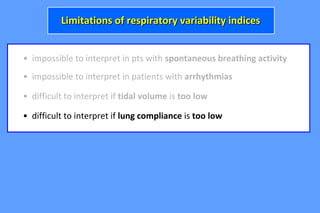
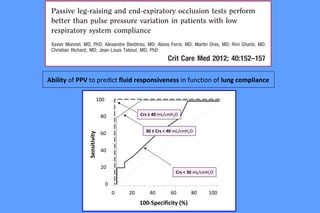
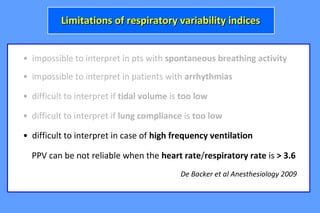
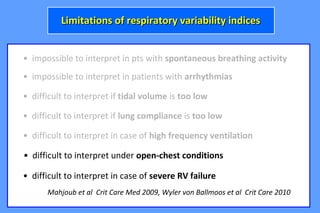
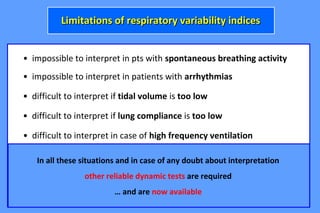
Prof. Jean-Louis TEBOULProf. Jean-Louis TEBOUL
Medical ICU
Bicetre hospital
University Paris South
France
Fluid responsiveness
in practice
• presence of hemodynamic instability/peripheral hypoperfusion
(mottled skin, hypotension, oliguria, hyperlactatemia…)
• and presence of preload responsiveness
• and limited risks of fluid overload
Decision of starting fluid administration
CHEST 2002, 121:2000-8CHEST 2002, 121:2000-8
Predictors of fluid responsiveness/unresponsiveness
Can help to choose the best fluid strategy by:
1) identifiying the pts eligible for fluid infusion
2) avoiding to fluid overload patients,
who would be fluid unresponsive
preload responsiveness
preload unresponsiveness
Stroke
Volume
Ventricular preload
Fluid infusion will increase LV stroke volumeFluid infusion will increase LV stroke volume
only ifonly if both ventriclesboth ventricles areare preload responsivepreload responsive
Fluid responsiveness
equivalent to
biventricular preload responsiveness
.
normal heartnormal heart
failing heartfailing heart
preload responsiveness
preload unresponsiveness
Stroke
volume
Ventricular preload
« static » measures of preload
cannot reliably predict
fluid responsiveness
1802 pts Summary AUC
0.56
Crit Care Med 2013; 41:1774-1781
Crit Care Med 2013; 41: 1474-81
normal heartnormal heart
failing heartfailing heart
preload responsiveness
preload unresponsiveness
Stroke
volume
Ventricular preload
.
Dynamic indices of preload responsiveness
induces
only in pts with
biventricular
preload responsiveness
occurs only in pts with
biventricular
preload responsiveness
correlates with the magnitude
of the
induced by
cyclic changes in SV fluid responsivenessMV
A B Ventricular preload
Stroke volume
preload responsiveness
preload
unresponsiveness
PPmax PPmin
PPPPmaxmax - PP- PPminmin
(PP(PPmaxmax ++ PPPPminmin) /2) /2
PPV =PPV =
Am J Respir Crit Care Med 2000; 162:134-8Am J Respir Crit Care Med 2000; 162:134-8
Arterial catheterArterial catheter
0
5
10
15
20
25
30
35
40
45
∆PP (%)
before fluid
Infusion
responders
n = 16
non-responders
n = 24
13 %
Sensitivity
PPV
CVP
PAOP
1 - Specificity
SVV
PVV
PAOP
CVP
PPV
SVV
CVP
CI
PCWP
1- Specificity
Sensitivity
PPV 12.8 %
Normal TV
0 20 40 60 80 100
0
20
40
60
80
100
Specificity(%)
100 - Specificity (%)
PPV
SVC collapsibility
(AUC: 0.94)
(AUC: 0.99)
12%
PPV
Chest 2005;128;848-854
Chest 2004, 126:1563-1568
Crit Care Med 2005;33:2534-9
M. Cannesson, J. Slieker, O. Desebbe, F. Fahdi,O. Bastien, JJ. Lehot
X. Monnet1,2*
, L. Guerin1,2
, M. Jozwiak1,2
, A. Bataille1,2
, F. Julien1,2
, C. Richard1,2
, J-L. Teboul1,2
Anesth Analg 2011; 113:523-8
rr
22
= 0. 85= 0. 85
Fluid-induced
changes in
cardiac index
(%)
∆PP (%) before fluid infusion
00
1010
2020
3030
4040
5050
00 1010 2020 3030 4040 5050
Am J Respir Crit Care Med 2000; 162:134-8Am J Respir Crit Care Med 2000; 162:134-8
The larger the ∆PP before fluid infusion,
the larger the increase in CO after fluid infusion
The smaller the PPV before fluid infusion,
the smaller the increase in CO after fluid infusion
Calculated automatically and displayed in real-time
by usual hemodynamic monitors
Pulse Pressure VariationPulse Pressure Variation
All these monitors are suitable
to display PPV in real-time
Arterial
Pressure
Arterial pressure waveform analysis Stroke volume
Stroke Volume Variation
Calculated automatically and displayed in real-time
by new hemodynamic monitors
Chest 2005;128;848-854
X. Monnet1,2*
, L. Guerin1,2
, M. Jozwiak1,2
, A. Bataille1,2
, F. Julien1,2
, C. Richard1,2
, J-L. Teboul1,2
Assessing fluid responsiveness by stroke volume variation
in mechanically ventilated patients with severe sepsis
G. Marx, T. Cope, L. McCrossan, S. Swaraj, C. Cowan, SM. Mostafa,
R. Wenstone, M. Leuwer
European Journal of Anaesthesiology 2004; 21:132-138
SVVPPV
685 pts
Average cut-off: 12.5%
PPVi PPVni
Non-invasive
finger blood pressure
monitoring device
R NR
∆ABF % =
ABF max - ABF min
(ABF max + ABF min)/2
18%
Esophageal DopplerEsophageal Doppler
Vpeakmin
∆Vpeak
Vpeakmax
∆Vpeak (%)
before fluid
4
8
12
16
20
24
28
32
36
responders non responders
Vpeak max – Vpeak min
(Vpeak max + Vpeak min) / 2
∆Vpeak =
Doppler-echoDoppler-echo
Cut-off values:
PPV: 15 %
∆Ppleth: 15 %
Arterial wave
Plethysmographic wave
Pulse oximeterPulse oximeter
PPV
SVV
PVI
GEDV
NE (-)
NE (+)
∆∆ dIVC %dIVC % ==
dIVCdIVCmaxmax - dIVC- dIVCminmin
(dIVC(dIVCmaxmax + dIVCm+ dIVCminin)/2)/2
Subcostal view
dIVCmaxdIVCmax
dIVCmindIVCmin
66 pts with MV
Systematic fluid loading with 10 mL/kg HES
0 20 40 60 80 100
0
20
40
60
80
100
Specificity(%)
100 - Specificity (%)
PPV
SVC collapsibility
(AUC: 0.94)
(AUC: 0.99)
12%
36 %
PPV and SVC collapsibility
perform equally
for predicting fluid responsiveness
Transesophageal
approach
is required
Volume responsiveness is a physiological phenomenon
related to a normal preload reserve.
Therefore,Therefore, detecting volume responsivenessdetecting volume responsiveness
must notmust not lead to infuse fluidlead to infuse fluid systematically.systematically.
The decision of fluid infusion must be based
on the presence of criteria of peripheral hypoperfusion
Limitations of respiratory variability indicesLimitations of respiratory variability indices
• impossible to interpret in pts with spontaneous breathing activity
Limitations of respiratory variability indicesLimitations of respiratory variability indices
1 - specificity
PPV
sensitivity
patients
with spontaneous
breathing
PPV (threshold: 12 %)
fully adapted to ventilator
• impossible to interpret in pts with spontaneous breathing activity
• impossible to interpret in patients with arrhythmias
Limitations of respiratory variability indicesLimitations of respiratory variability indices
50
70
90
110
mmHg PPmax
PPmin
• impossible to interpret in pts with spontaneous breathing activity
• difficult to interpret if tidal volume is too low
• impossible to interpret in patients with arrhythmias
Limitations of respiratory variability indicesLimitations of respiratory variability indices
PPV 8 %
1- Specificity
Sensitivity
PPV 12.8 %
Normal TV
Low TV
• impossible to interpret in pts with spontaneous breathing activity
• difficult to interpret if tidal volume is too low
• impossible to interpret in patients with arrhythmias
Limitations of respiratory variability indicesLimitations of respiratory variability indices
• difficult to interpret if lung compliance is too low
Crs < 30 mL/cmH2O
0 20 40 60 80 100
100
80
60
40
20
0
100-Specificity (%)
Sensitivity
Crs ≥ 40 mL/cmH2O
30 ≤ Crs < 40 mL/cmH2O
Ability of PPV to predict fluid responsiveness in function of lung compliance
• impossible to interpret in pts with spontaneous breathing activity
• difficult to interpret if tidal volume is too low
• impossible to interpret in patients with arrhythmias
Limitations of respiratory variability indicesLimitations of respiratory variability indices
• difficult to interpret if lung compliance is too low
• difficult to interpret in case of high frequency ventilation
PPV can be not reliable when the heart rate/respiratory rate is > 3.6
De Backer et al Anesthesiology 2009
• impossible to interpret in pts with spontaneous breathing activity
• difficult to interpret if tidal volume is too low
• impossible to interpret in patients with arrhythmias
Limitations of respiratory variability indicesLimitations of respiratory variability indices
• difficult to interpret if lung compliance is too low
• difficult to interpret in case of high frequency ventilation
• difficult to interpret under open-chest conditions
• difficult to interpret in case of severe RV failure
Mahjoub et al Crit Care Med 2009, Wyler von Ballmoos et al Crit Care 2010
• impossible to interpret in pts with spontaneous breathing activity
• difficult to interpret if tidal volume is too low
• impossible to interpret in patients with arrhythmias
Limitations of respiratory variability indicesLimitations of respiratory variability indices
• difficult to interpret if lung compliance is too low
• difficult to interpret in case of high frequency ventilation
• difficult to interpret under open-chest conditions
• difficult to interpret in case of severe RV failure
In all these situations and in case of any doubt about interpretation
other reliable dynamic tests are required
… and are now available

Fluid responsiveness in pratice

  • 1.
    Prof. Jean-Louis TEBOULProf.Jean-Louis TEBOUL Medical ICU Bicetre hospital University Paris South France Fluid responsiveness in practice
  • 2.
    • presence ofhemodynamic instability/peripheral hypoperfusion (mottled skin, hypotension, oliguria, hyperlactatemia…) • and presence of preload responsiveness • and limited risks of fluid overload Decision of starting fluid administration
  • 3.
  • 4.
    Predictors of fluidresponsiveness/unresponsiveness Can help to choose the best fluid strategy by: 1) identifiying the pts eligible for fluid infusion 2) avoiding to fluid overload patients, who would be fluid unresponsive
  • 5.
    preload responsiveness preload unresponsiveness Stroke Volume Ventricularpreload Fluid infusion will increase LV stroke volumeFluid infusion will increase LV stroke volume only ifonly if both ventriclesboth ventricles areare preload responsivepreload responsive Fluid responsiveness equivalent to biventricular preload responsiveness
  • 6.
    . normal heartnormal heart failingheartfailing heart preload responsiveness preload unresponsiveness Stroke volume Ventricular preload « static » measures of preload cannot reliably predict fluid responsiveness
  • 7.
    1802 pts SummaryAUC 0.56 Crit Care Med 2013; 41:1774-1781 Crit Care Med 2013; 41: 1474-81
  • 8.
    normal heartnormal heart failingheartfailing heart preload responsiveness preload unresponsiveness Stroke volume Ventricular preload . Dynamic indices of preload responsiveness
  • 9.
    induces only in ptswith biventricular preload responsiveness occurs only in pts with biventricular preload responsiveness correlates with the magnitude of the induced by cyclic changes in SV fluid responsivenessMV
  • 10.
    A B Ventricularpreload Stroke volume preload responsiveness preload unresponsiveness
  • 11.
    PPmax PPmin PPPPmaxmax -PP- PPminmin (PP(PPmaxmax ++ PPPPminmin) /2) /2 PPV =PPV = Am J Respir Crit Care Med 2000; 162:134-8Am J Respir Crit Care Med 2000; 162:134-8 Arterial catheterArterial catheter
  • 12.
  • 13.
  • 14.
    SVV PVV PAOP CVP PPV SVV CVP CI PCWP 1- Specificity Sensitivity PPV 12.8% Normal TV 0 20 40 60 80 100 0 20 40 60 80 100 Specificity(%) 100 - Specificity (%) PPV SVC collapsibility (AUC: 0.94) (AUC: 0.99) 12%
  • 15.
    PPV Chest 2005;128;848-854 Chest 2004,126:1563-1568 Crit Care Med 2005;33:2534-9 M. Cannesson, J. Slieker, O. Desebbe, F. Fahdi,O. Bastien, JJ. Lehot X. Monnet1,2* , L. Guerin1,2 , M. Jozwiak1,2 , A. Bataille1,2 , F. Julien1,2 , C. Richard1,2 , J-L. Teboul1,2 Anesth Analg 2011; 113:523-8
  • 17.
    rr 22 = 0. 85=0. 85 Fluid-induced changes in cardiac index (%) ∆PP (%) before fluid infusion 00 1010 2020 3030 4040 5050 00 1010 2020 3030 4040 5050 Am J Respir Crit Care Med 2000; 162:134-8Am J Respir Crit Care Med 2000; 162:134-8 The larger the ∆PP before fluid infusion, the larger the increase in CO after fluid infusion The smaller the PPV before fluid infusion, the smaller the increase in CO after fluid infusion
  • 18.
    Calculated automatically anddisplayed in real-time by usual hemodynamic monitors Pulse Pressure VariationPulse Pressure Variation All these monitors are suitable to display PPV in real-time
  • 19.
    Arterial Pressure Arterial pressure waveformanalysis Stroke volume Stroke Volume Variation Calculated automatically and displayed in real-time by new hemodynamic monitors
  • 20.
    Chest 2005;128;848-854 X. Monnet1,2* ,L. Guerin1,2 , M. Jozwiak1,2 , A. Bataille1,2 , F. Julien1,2 , C. Richard1,2 , J-L. Teboul1,2 Assessing fluid responsiveness by stroke volume variation in mechanically ventilated patients with severe sepsis G. Marx, T. Cope, L. McCrossan, S. Swaraj, C. Cowan, SM. Mostafa, R. Wenstone, M. Leuwer European Journal of Anaesthesiology 2004; 21:132-138
  • 21.
  • 22.
  • 23.
    PPVi PPVni Non-invasive finger bloodpressure monitoring device
  • 24.
    R NR ∆ABF %= ABF max - ABF min (ABF max + ABF min)/2 18% Esophageal DopplerEsophageal Doppler
  • 25.
    Vpeakmin ∆Vpeak Vpeakmax ∆Vpeak (%) before fluid 4 8 12 16 20 24 28 32 36 respondersnon responders Vpeak max – Vpeak min (Vpeak max + Vpeak min) / 2 ∆Vpeak = Doppler-echoDoppler-echo
  • 26.
    Cut-off values: PPV: 15% ∆Ppleth: 15 % Arterial wave Plethysmographic wave
  • 27.
  • 29.
  • 30.
  • 31.
    ∆∆ dIVC %dIVC% == dIVCdIVCmaxmax - dIVC- dIVCminmin (dIVC(dIVCmaxmax + dIVCm+ dIVCminin)/2)/2 Subcostal view dIVCmaxdIVCmax dIVCmindIVCmin
  • 32.
    66 pts withMV Systematic fluid loading with 10 mL/kg HES
  • 33.
    0 20 4060 80 100 0 20 40 60 80 100 Specificity(%) 100 - Specificity (%) PPV SVC collapsibility (AUC: 0.94) (AUC: 0.99) 12% 36 % PPV and SVC collapsibility perform equally for predicting fluid responsiveness Transesophageal approach is required
  • 34.
    Volume responsiveness isa physiological phenomenon related to a normal preload reserve. Therefore,Therefore, detecting volume responsivenessdetecting volume responsiveness must notmust not lead to infuse fluidlead to infuse fluid systematically.systematically. The decision of fluid infusion must be based on the presence of criteria of peripheral hypoperfusion Limitations of respiratory variability indicesLimitations of respiratory variability indices
  • 35.
    • impossible tointerpret in pts with spontaneous breathing activity Limitations of respiratory variability indicesLimitations of respiratory variability indices
  • 36.
    1 - specificity PPV sensitivity patients withspontaneous breathing PPV (threshold: 12 %) fully adapted to ventilator
  • 37.
    • impossible tointerpret in pts with spontaneous breathing activity • impossible to interpret in patients with arrhythmias Limitations of respiratory variability indicesLimitations of respiratory variability indices 50 70 90 110 mmHg PPmax PPmin
  • 38.
    • impossible tointerpret in pts with spontaneous breathing activity • difficult to interpret if tidal volume is too low • impossible to interpret in patients with arrhythmias Limitations of respiratory variability indicesLimitations of respiratory variability indices
  • 39.
    PPV 8 % 1-Specificity Sensitivity PPV 12.8 % Normal TV Low TV
  • 40.
    • impossible tointerpret in pts with spontaneous breathing activity • difficult to interpret if tidal volume is too low • impossible to interpret in patients with arrhythmias Limitations of respiratory variability indicesLimitations of respiratory variability indices • difficult to interpret if lung compliance is too low
  • 41.
    Crs < 30mL/cmH2O 0 20 40 60 80 100 100 80 60 40 20 0 100-Specificity (%) Sensitivity Crs ≥ 40 mL/cmH2O 30 ≤ Crs < 40 mL/cmH2O Ability of PPV to predict fluid responsiveness in function of lung compliance
  • 42.
    • impossible tointerpret in pts with spontaneous breathing activity • difficult to interpret if tidal volume is too low • impossible to interpret in patients with arrhythmias Limitations of respiratory variability indicesLimitations of respiratory variability indices • difficult to interpret if lung compliance is too low • difficult to interpret in case of high frequency ventilation PPV can be not reliable when the heart rate/respiratory rate is > 3.6 De Backer et al Anesthesiology 2009
  • 43.
    • impossible tointerpret in pts with spontaneous breathing activity • difficult to interpret if tidal volume is too low • impossible to interpret in patients with arrhythmias Limitations of respiratory variability indicesLimitations of respiratory variability indices • difficult to interpret if lung compliance is too low • difficult to interpret in case of high frequency ventilation • difficult to interpret under open-chest conditions • difficult to interpret in case of severe RV failure Mahjoub et al Crit Care Med 2009, Wyler von Ballmoos et al Crit Care 2010
  • 44.
    • impossible tointerpret in pts with spontaneous breathing activity • difficult to interpret if tidal volume is too low • impossible to interpret in patients with arrhythmias Limitations of respiratory variability indicesLimitations of respiratory variability indices • difficult to interpret if lung compliance is too low • difficult to interpret in case of high frequency ventilation • difficult to interpret under open-chest conditions • difficult to interpret in case of severe RV failure In all these situations and in case of any doubt about interpretation other reliable dynamic tests are required … and are now available

Editor's Notes

  • #8 In this meataanalysis, Marik and colleagues reviewed the studies that addressed the issue of predicting fluid responsiveness with CVP. Overall, a low value of the area under the curve was found confirming that CVP cannot predict fluid responsiveness. Importantly, they concluded that CVP should not be used to make clinical decisions regarding fluid management.