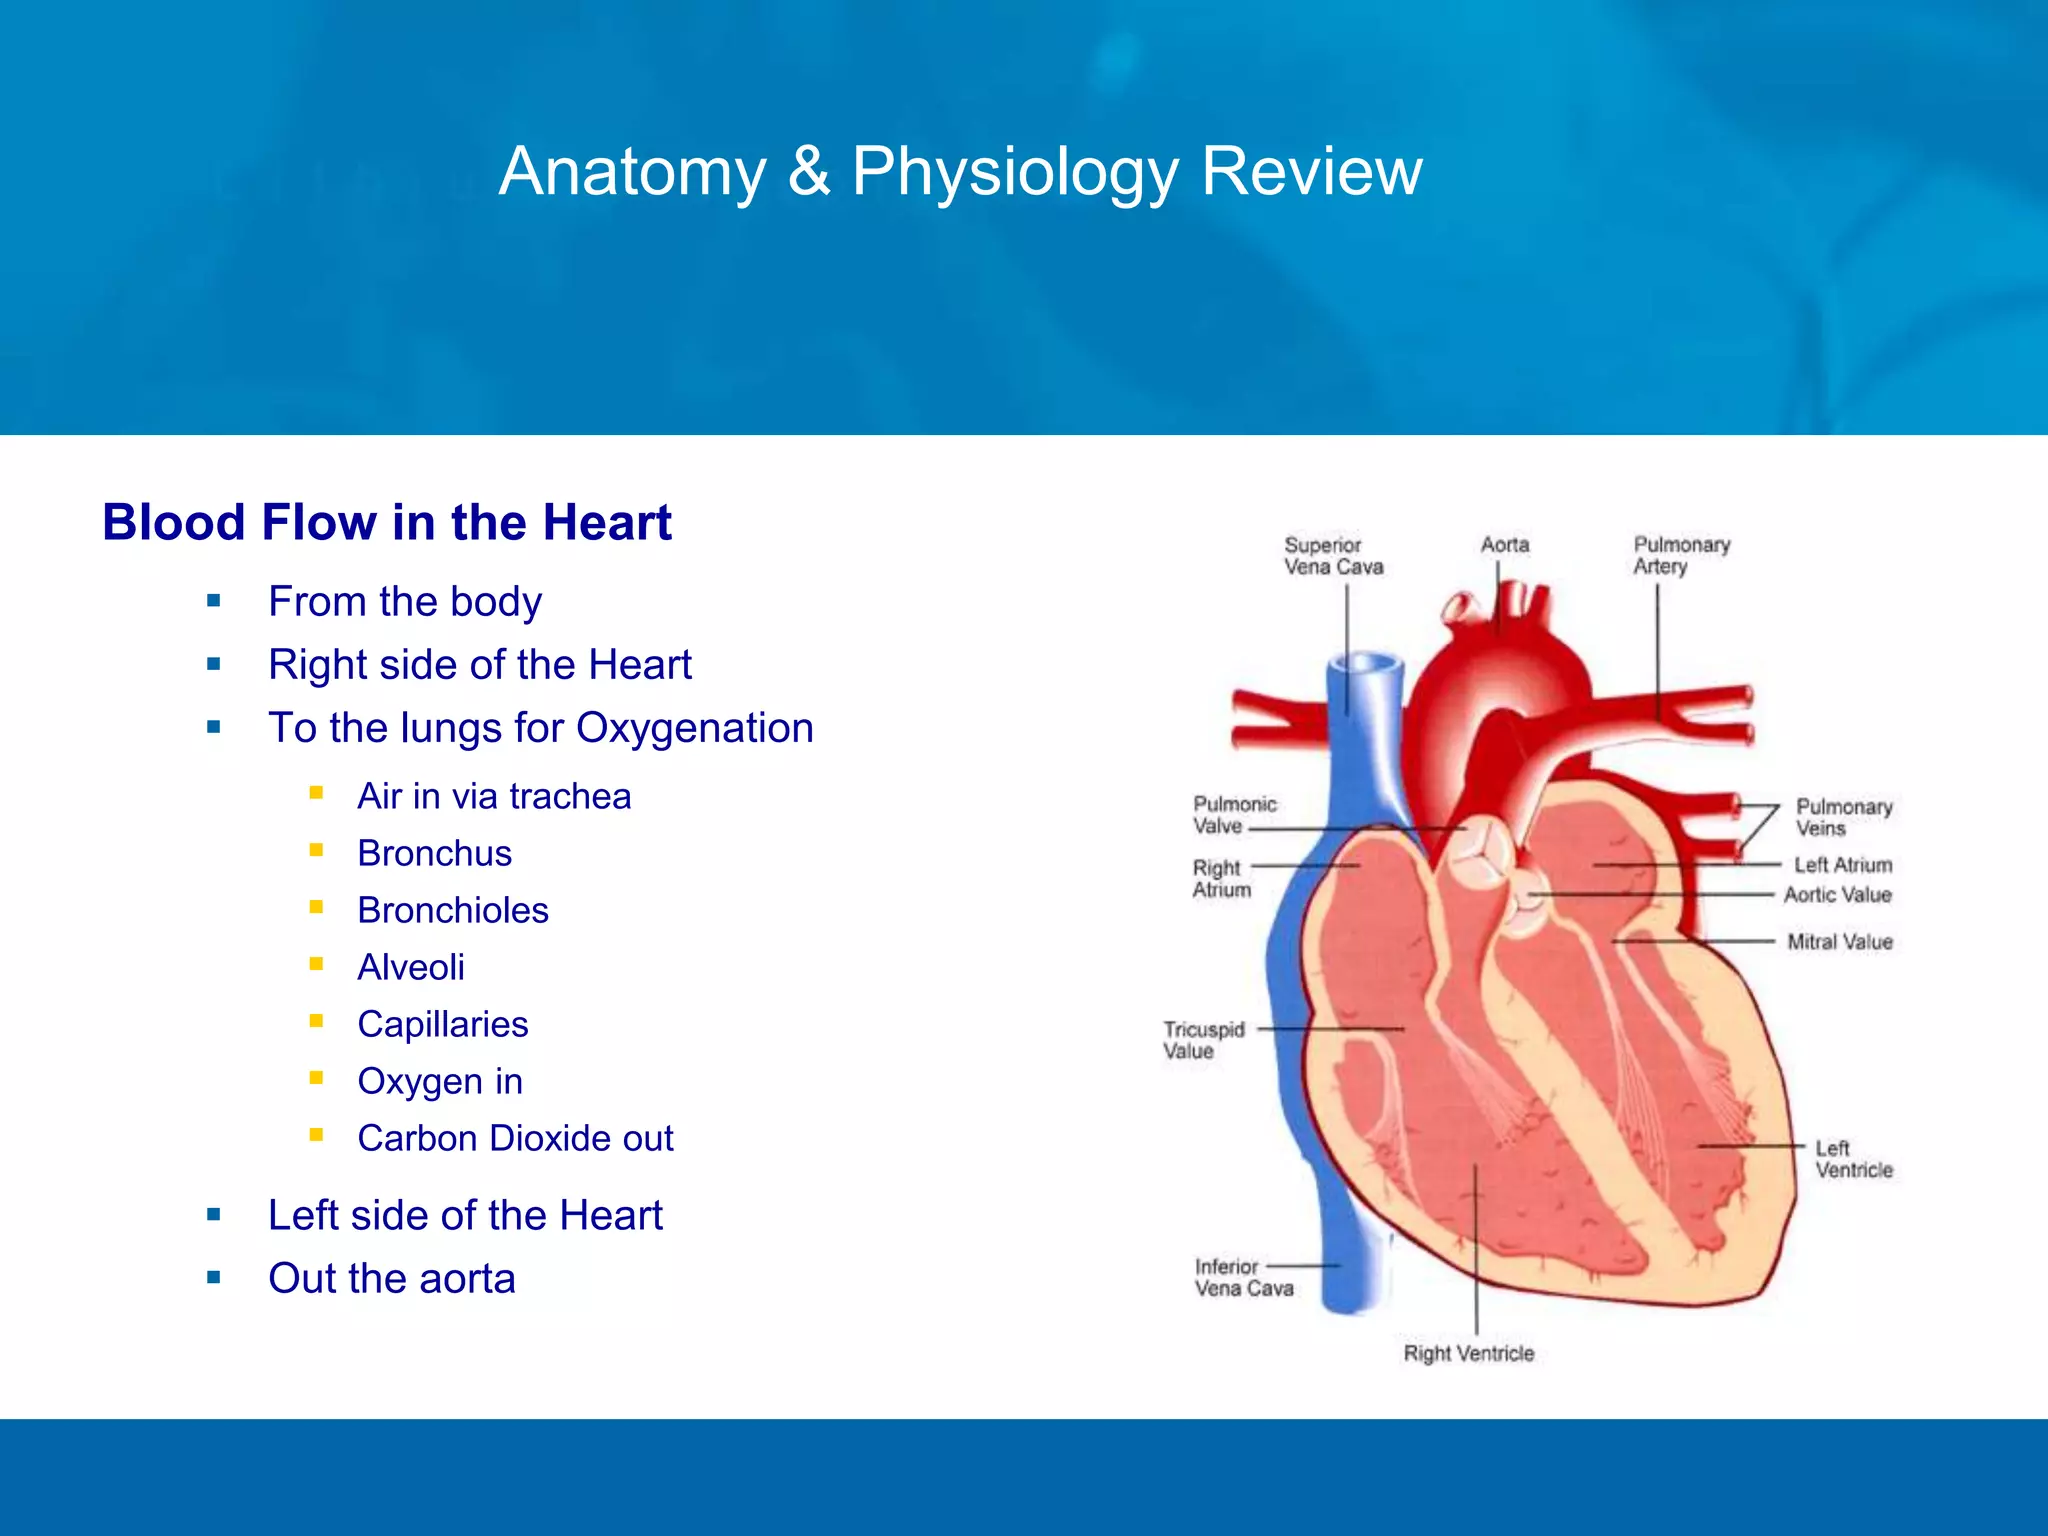
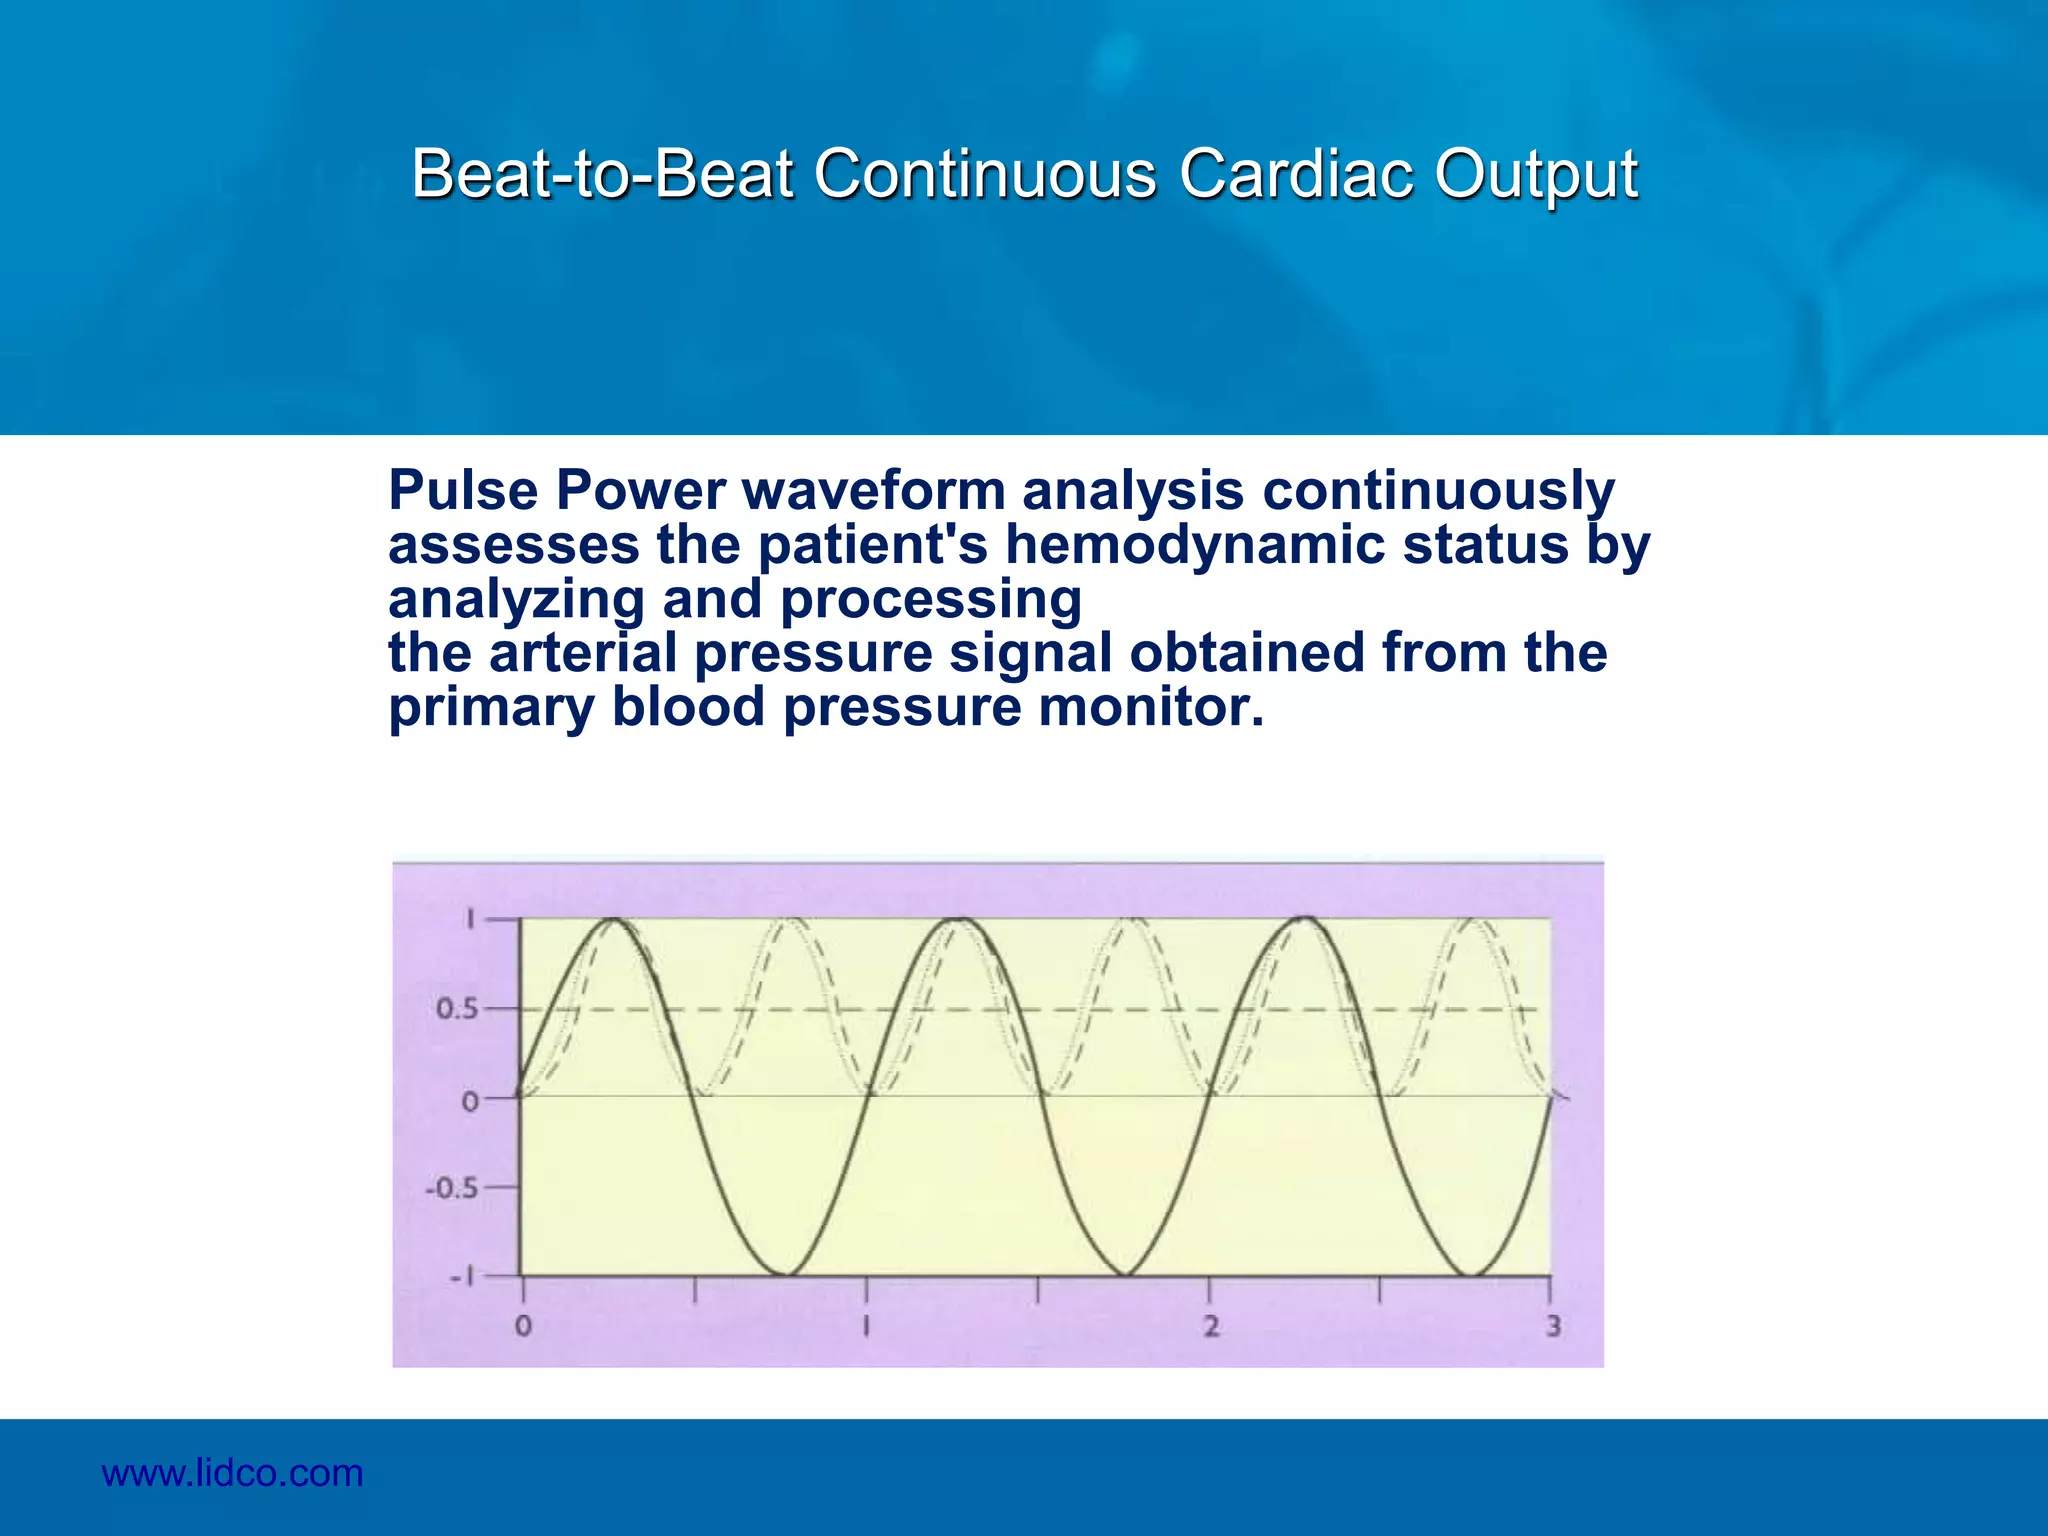
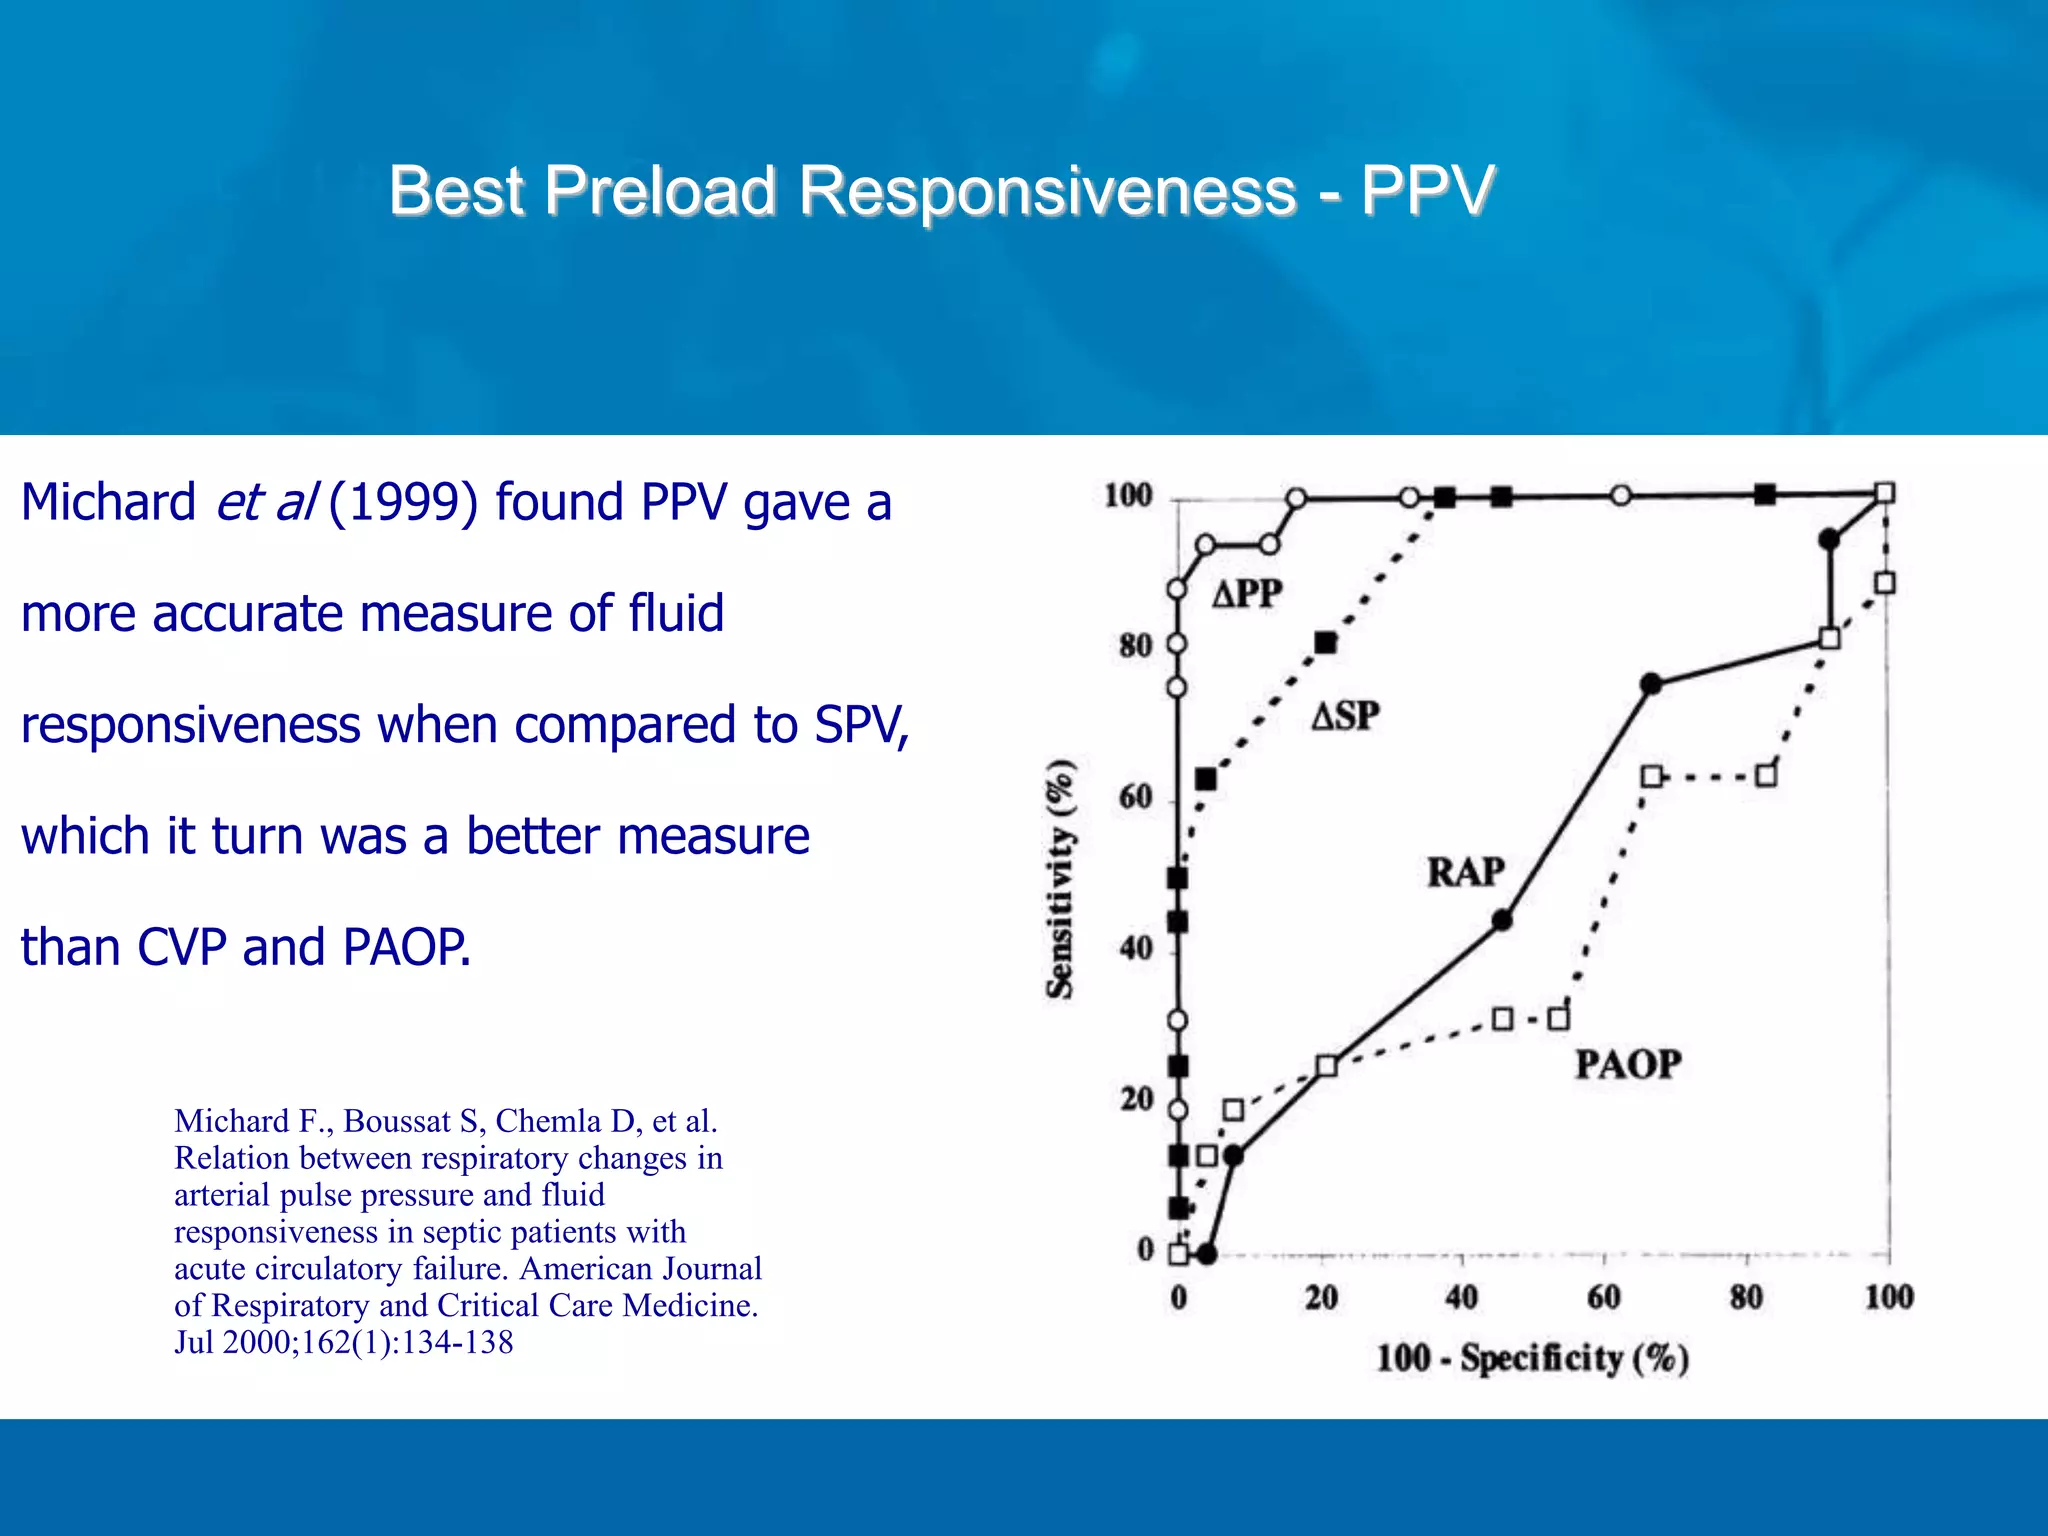
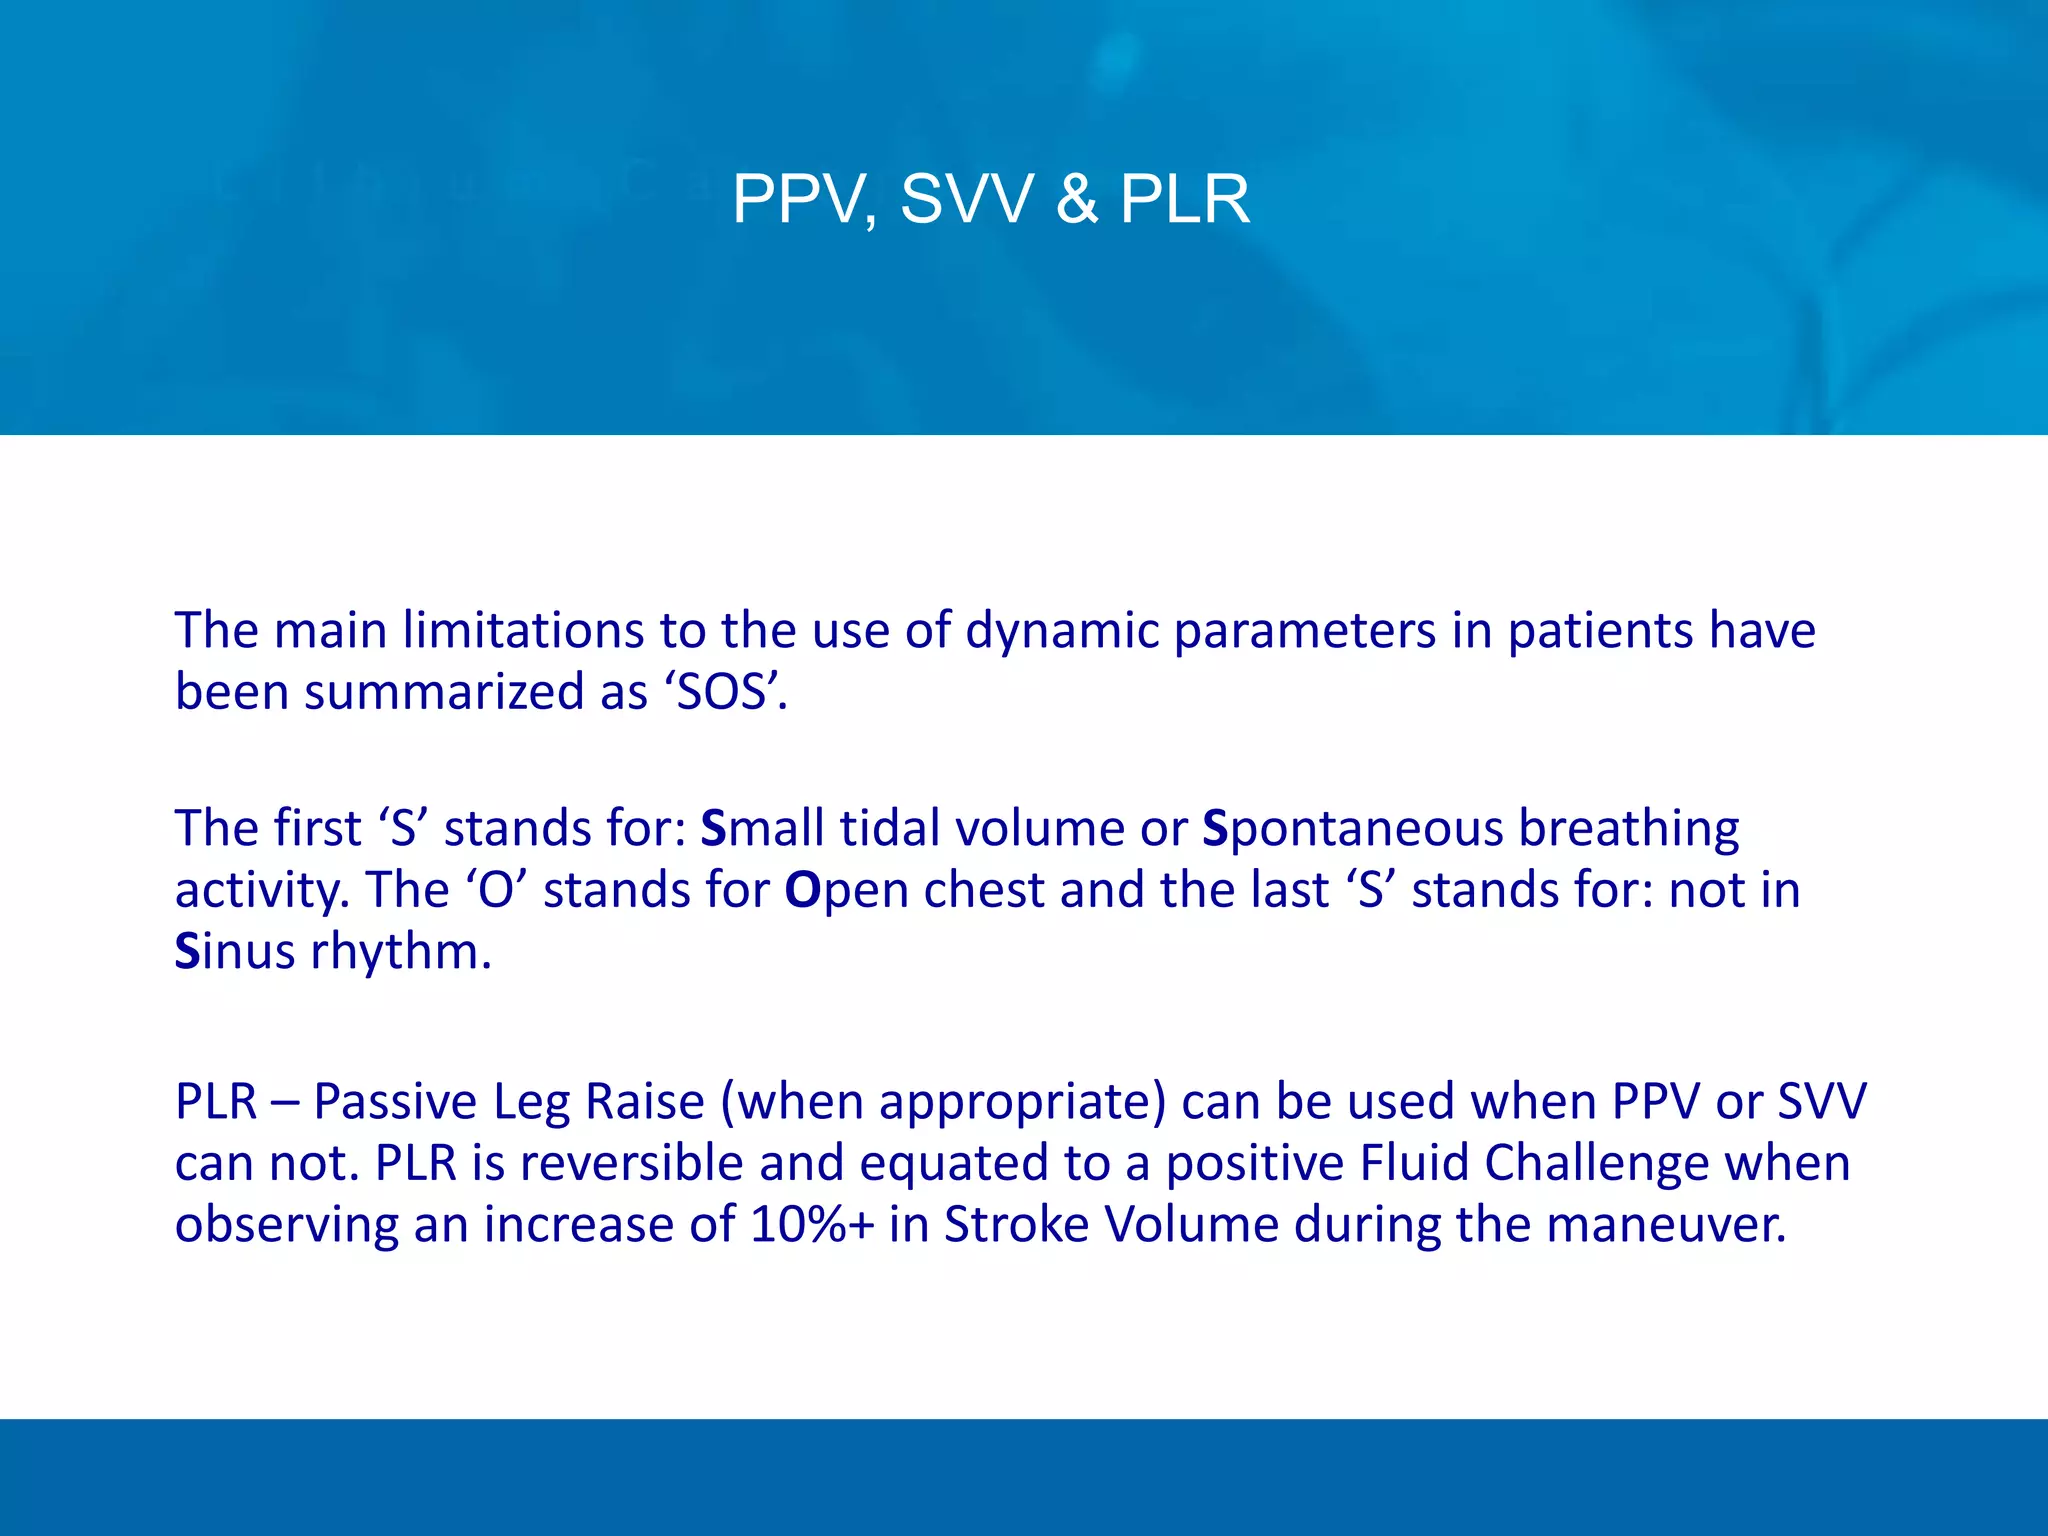
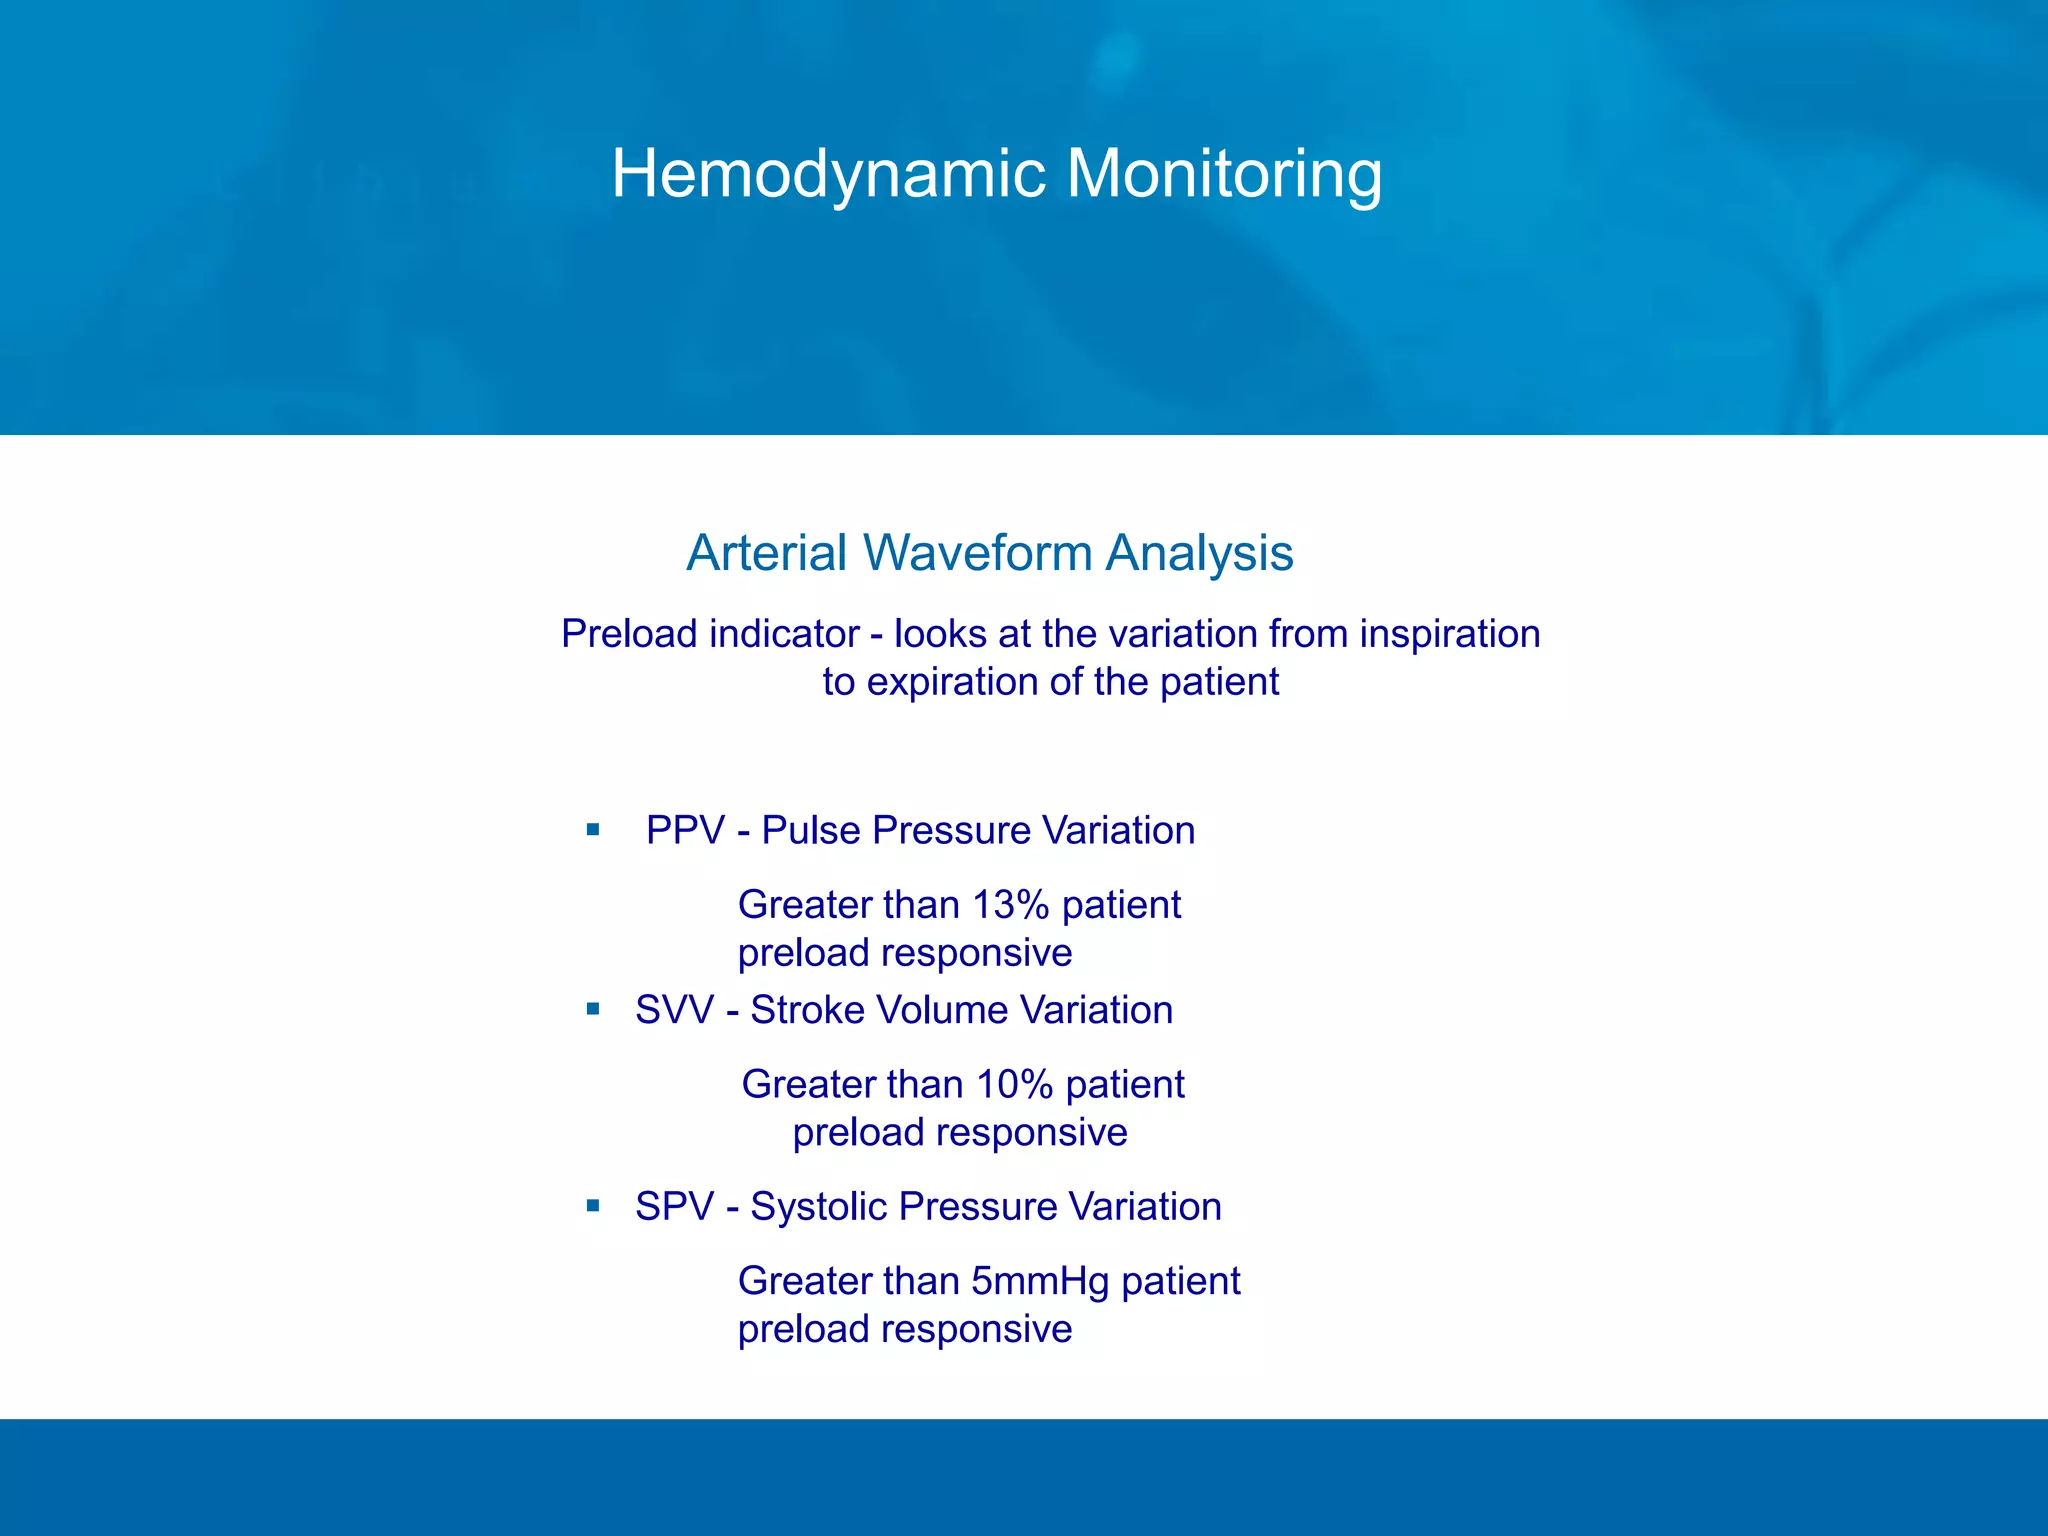
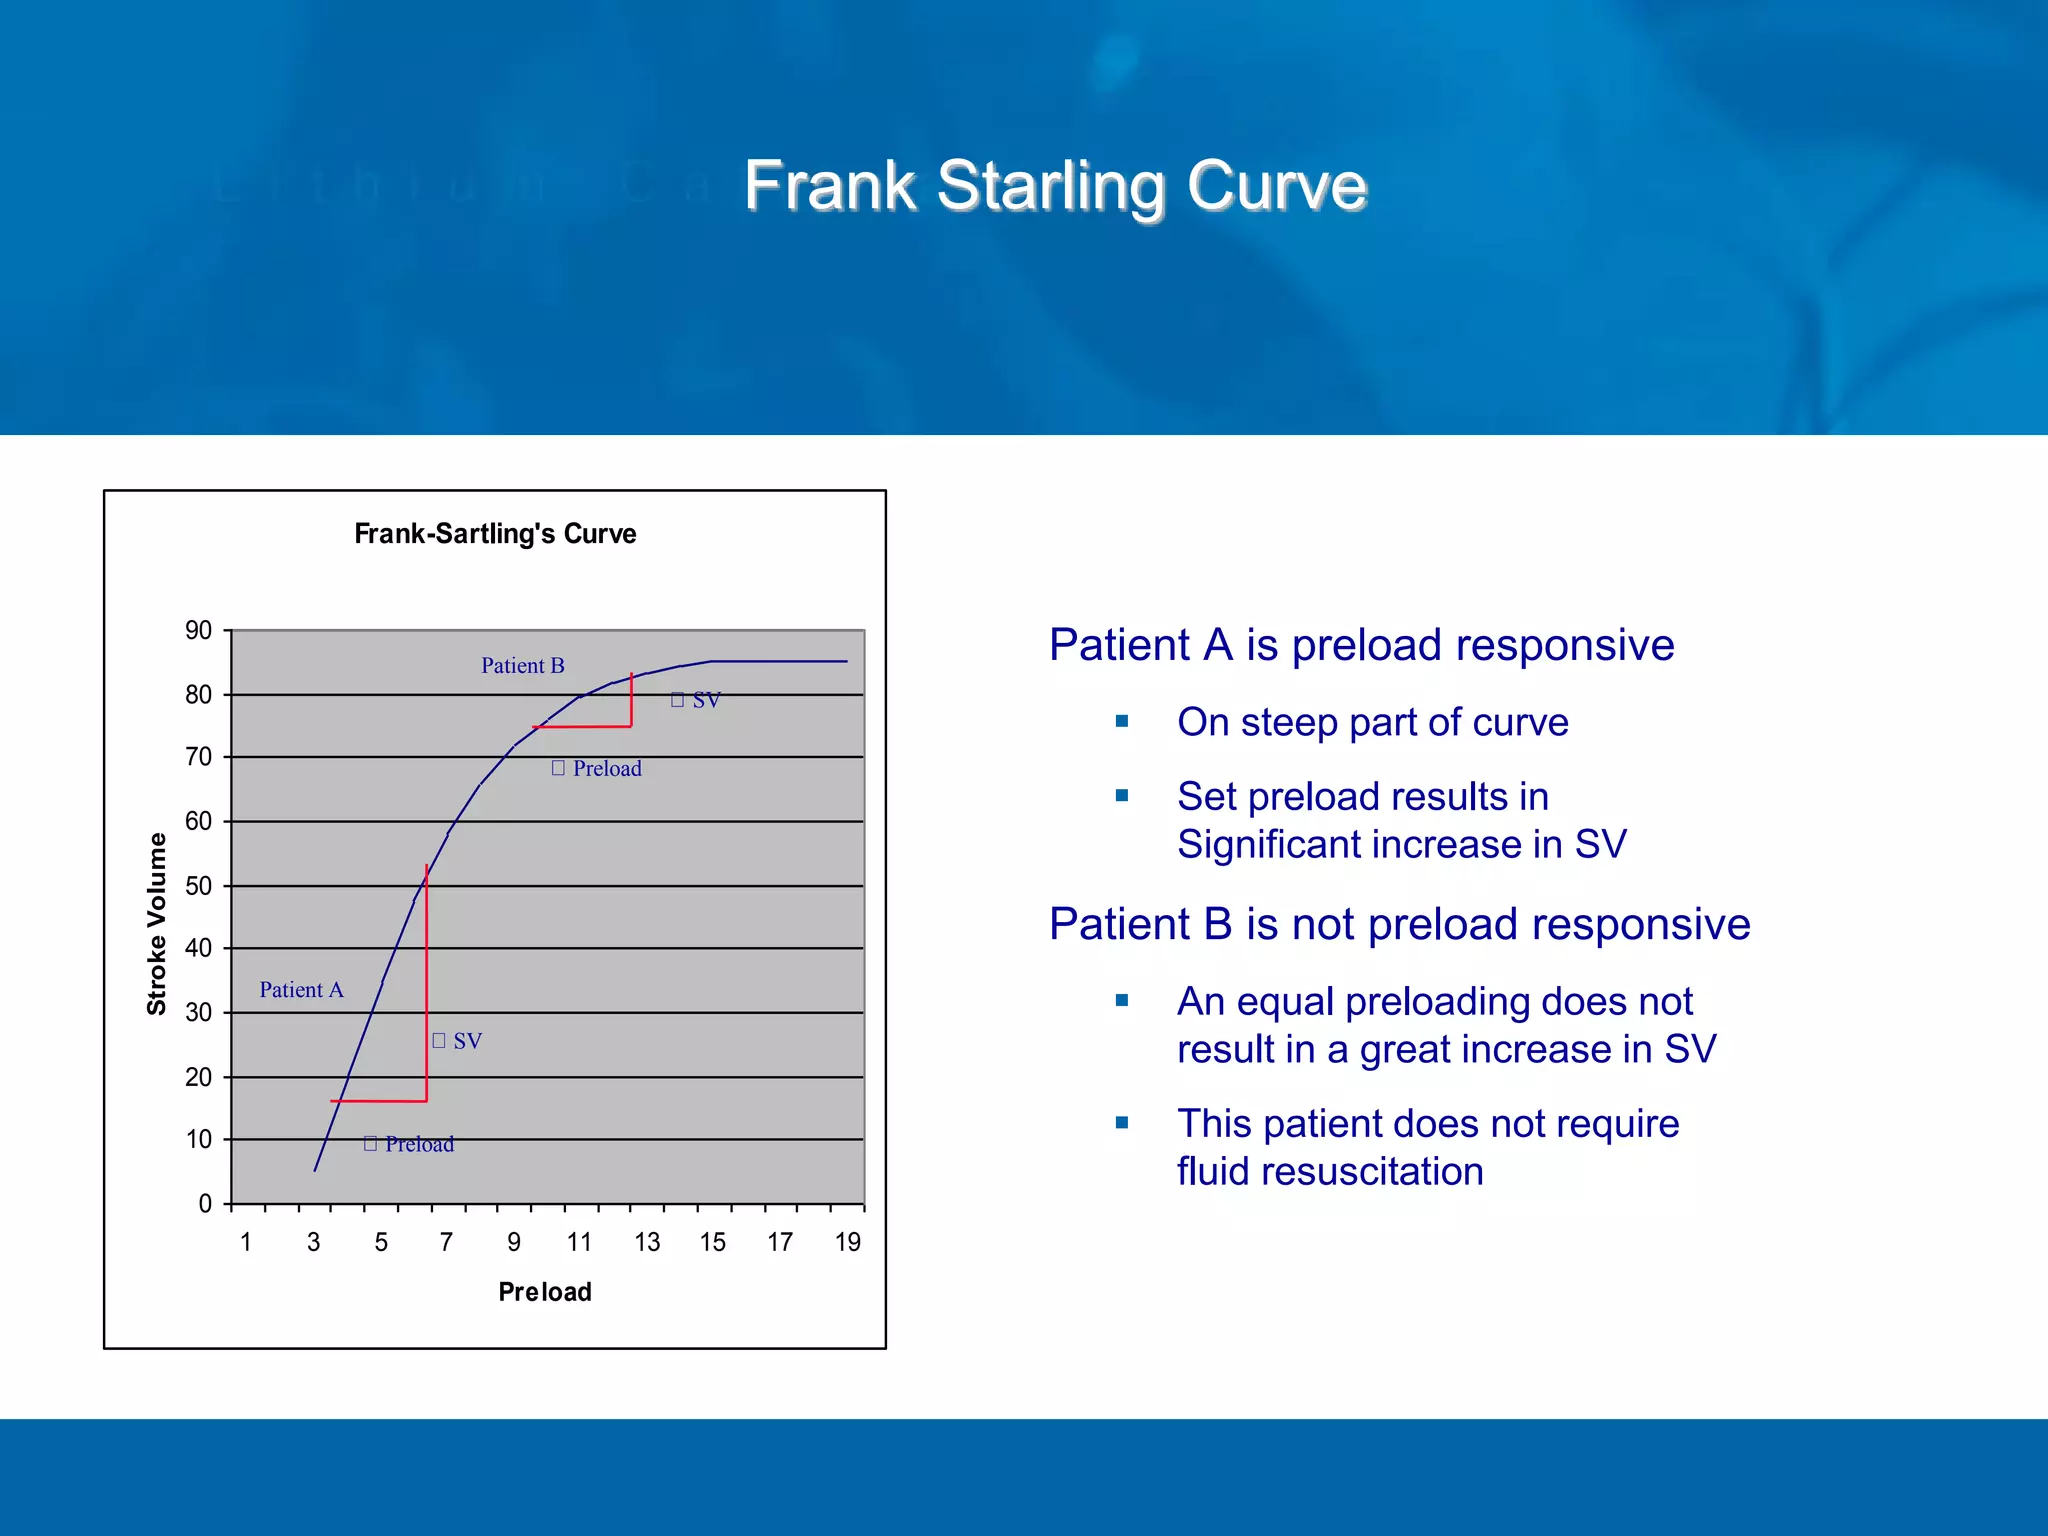
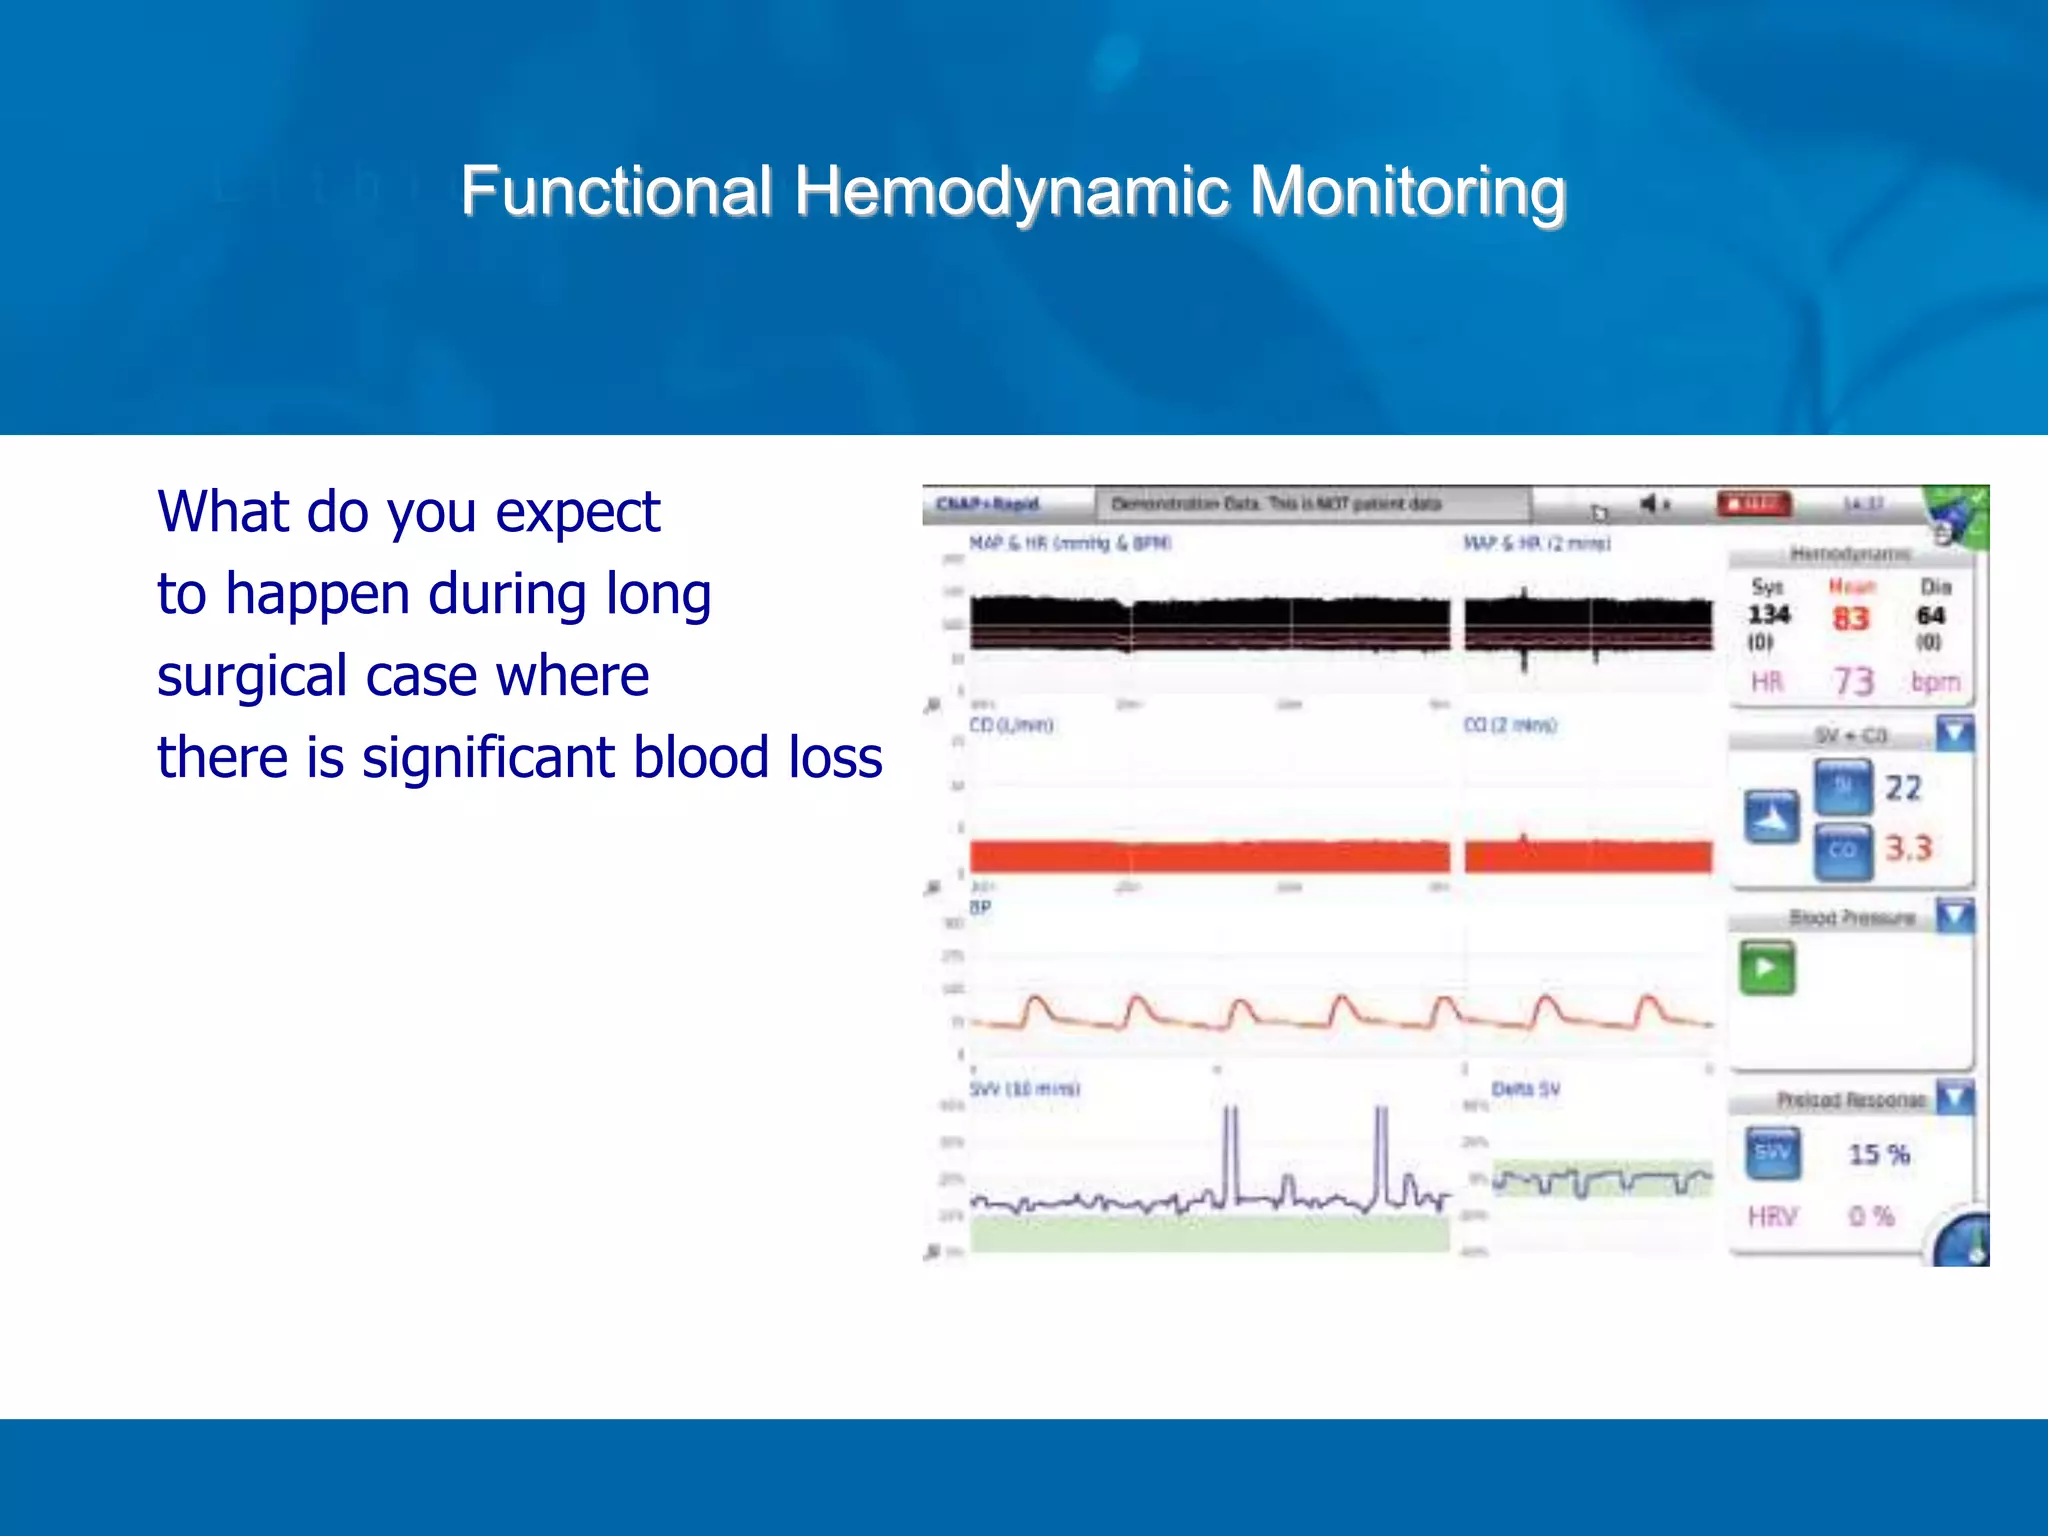
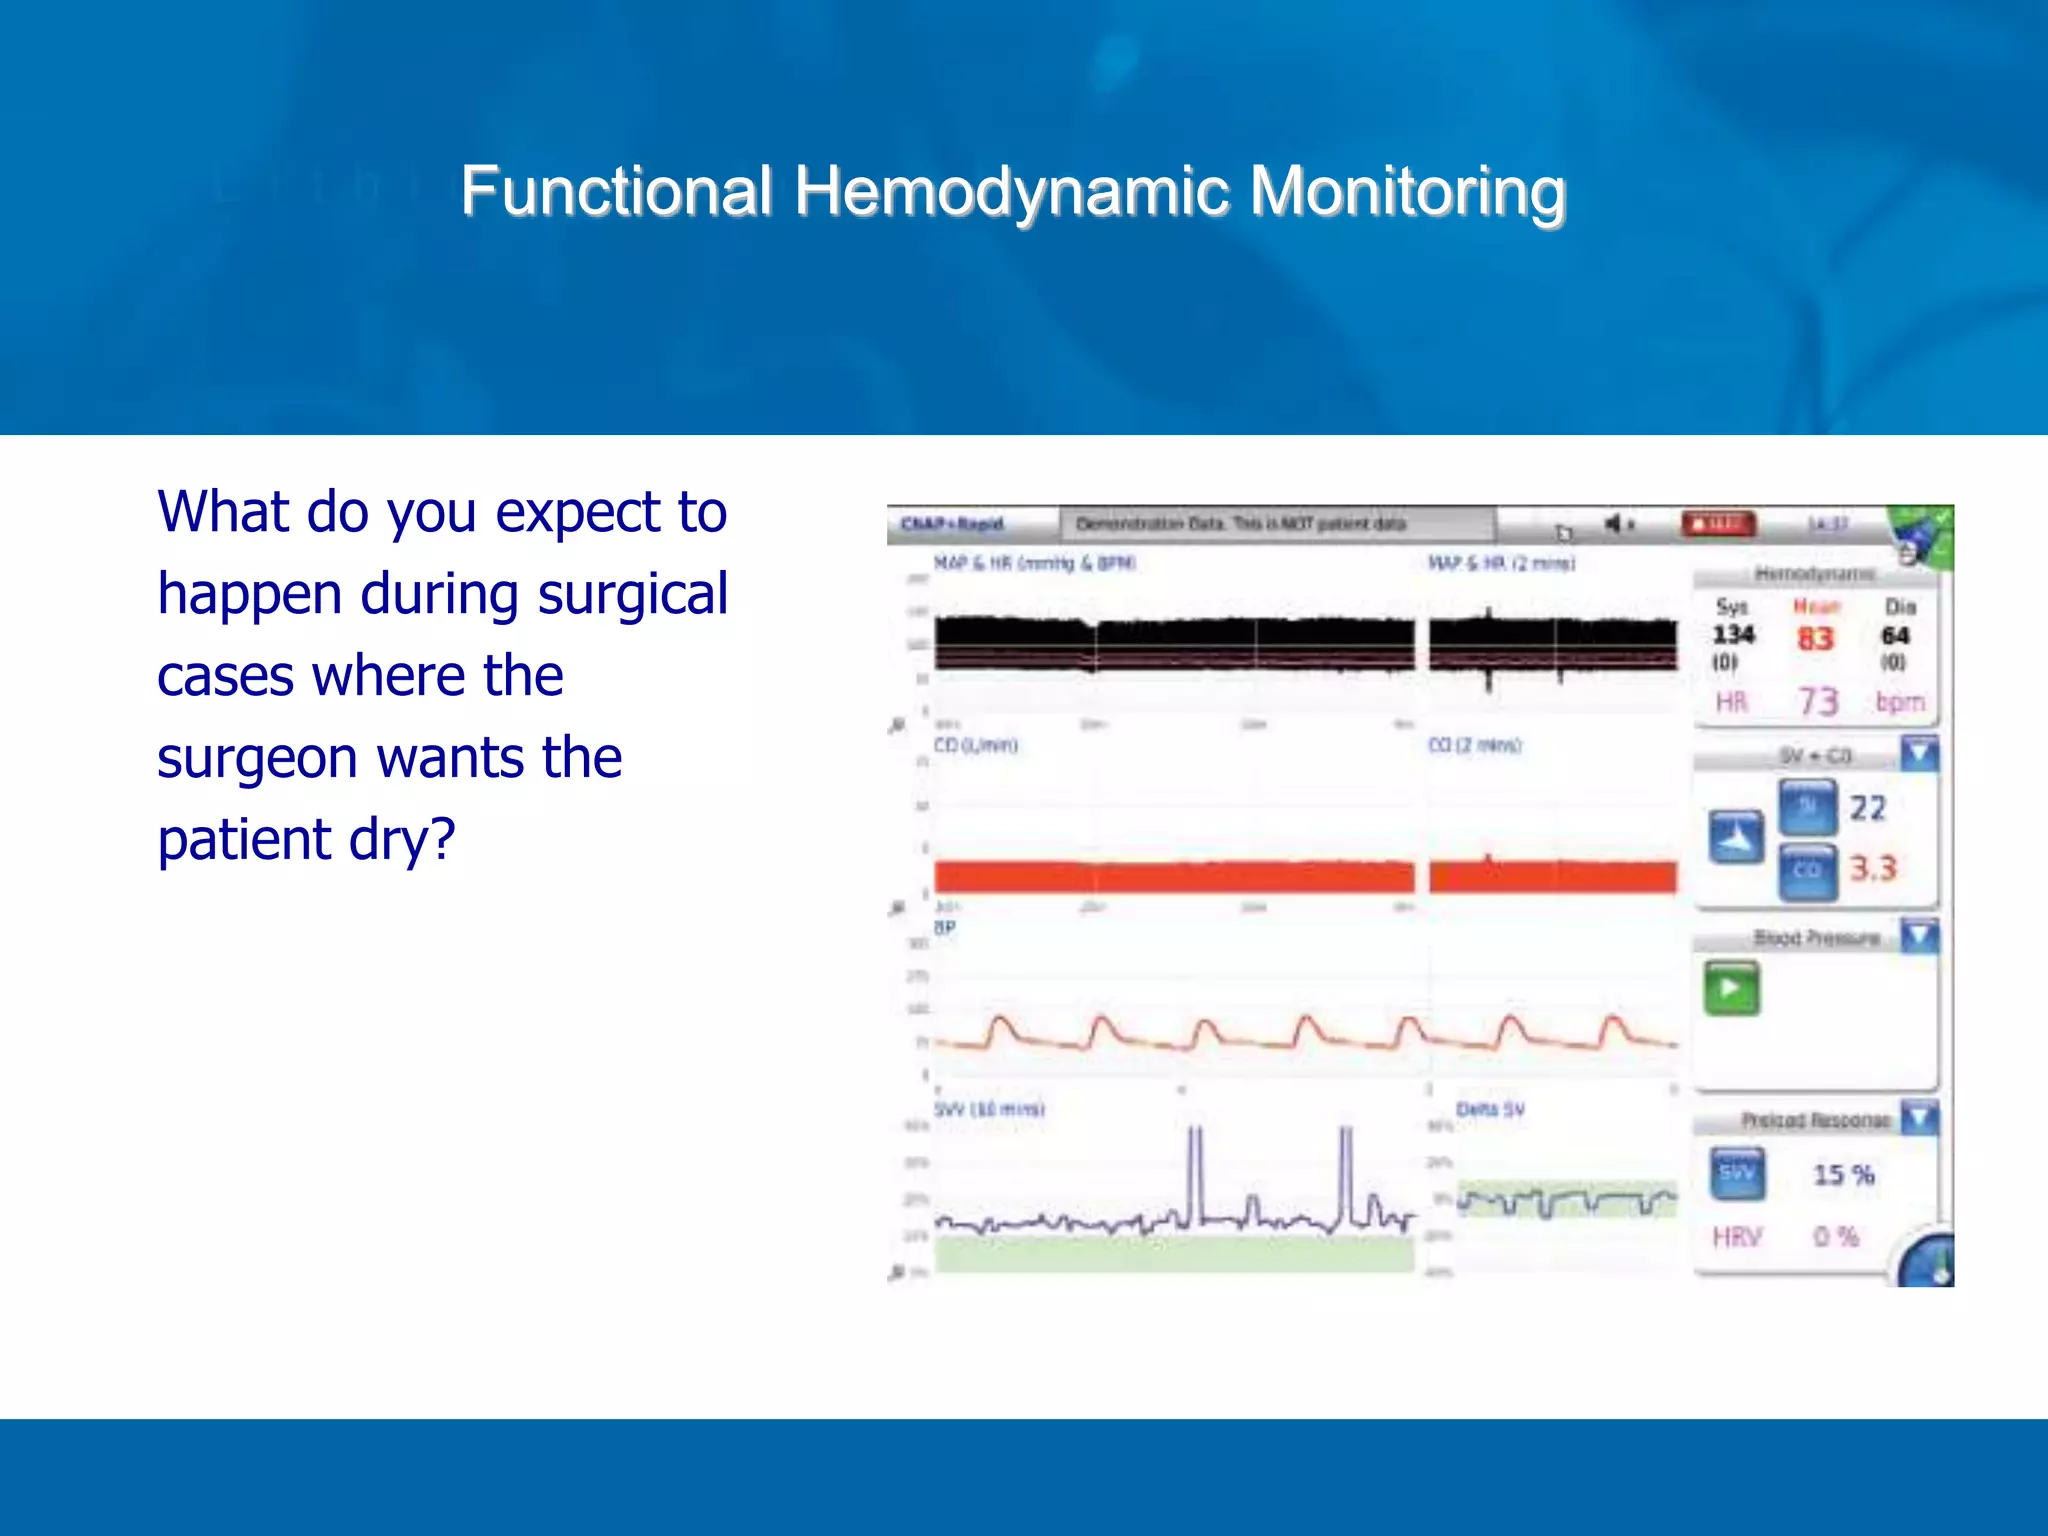
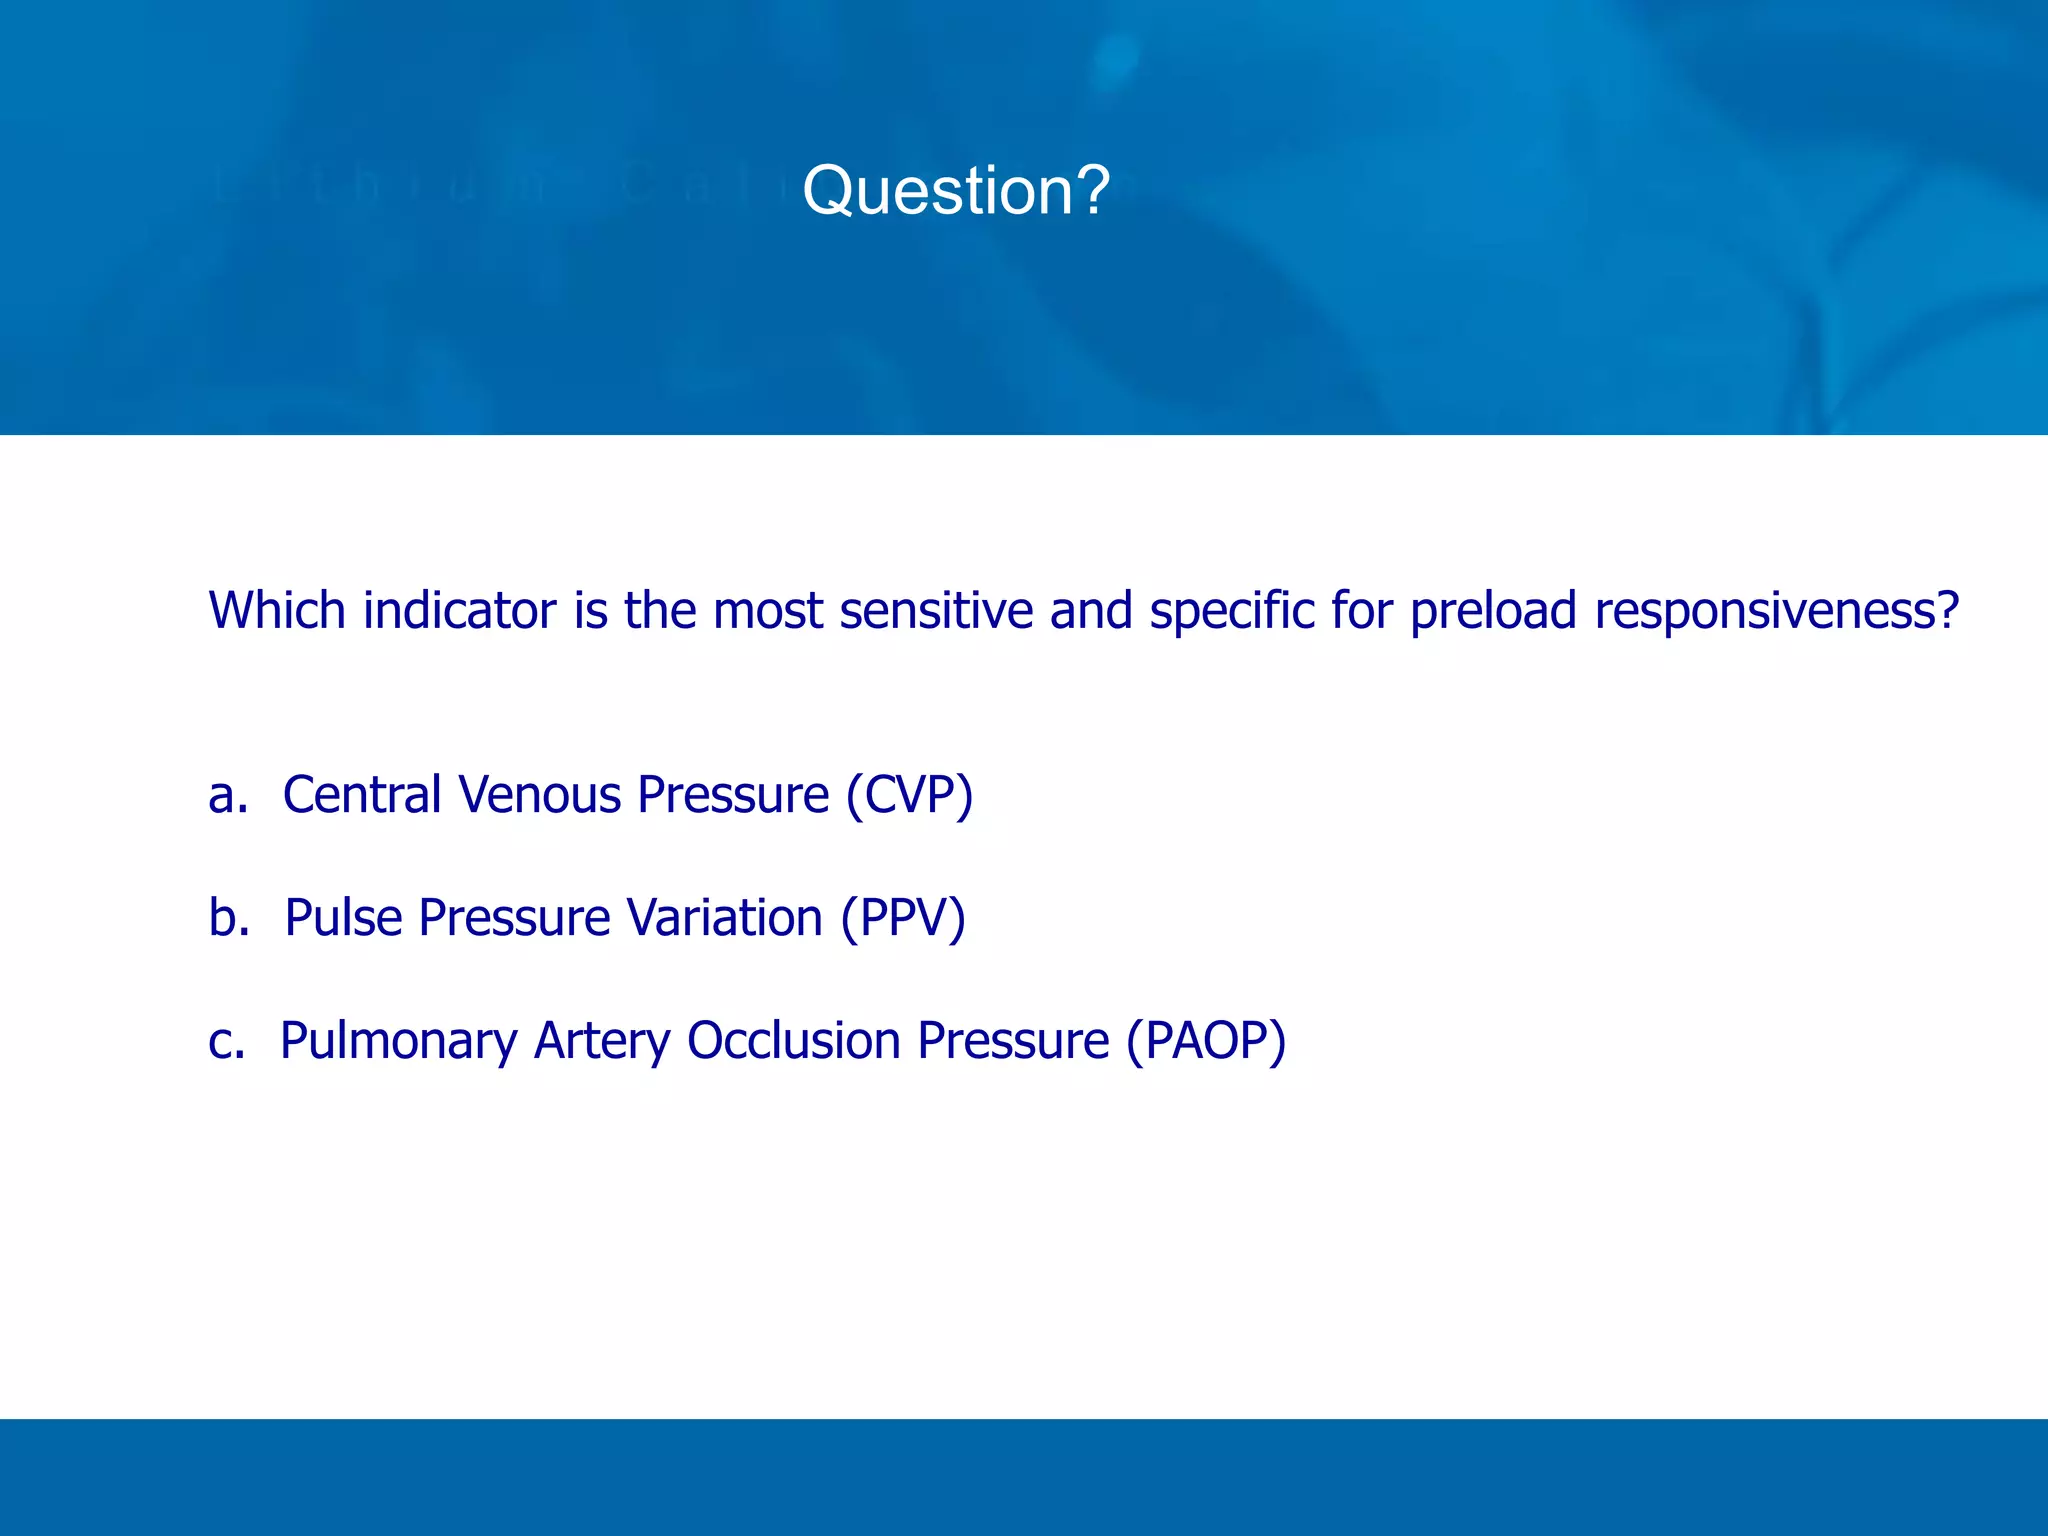
- The document describes functional hemodynamic monitoring, including the physiology of heart-lung interactions and parameters used to predict patient response to volume like pulse pressure variation.
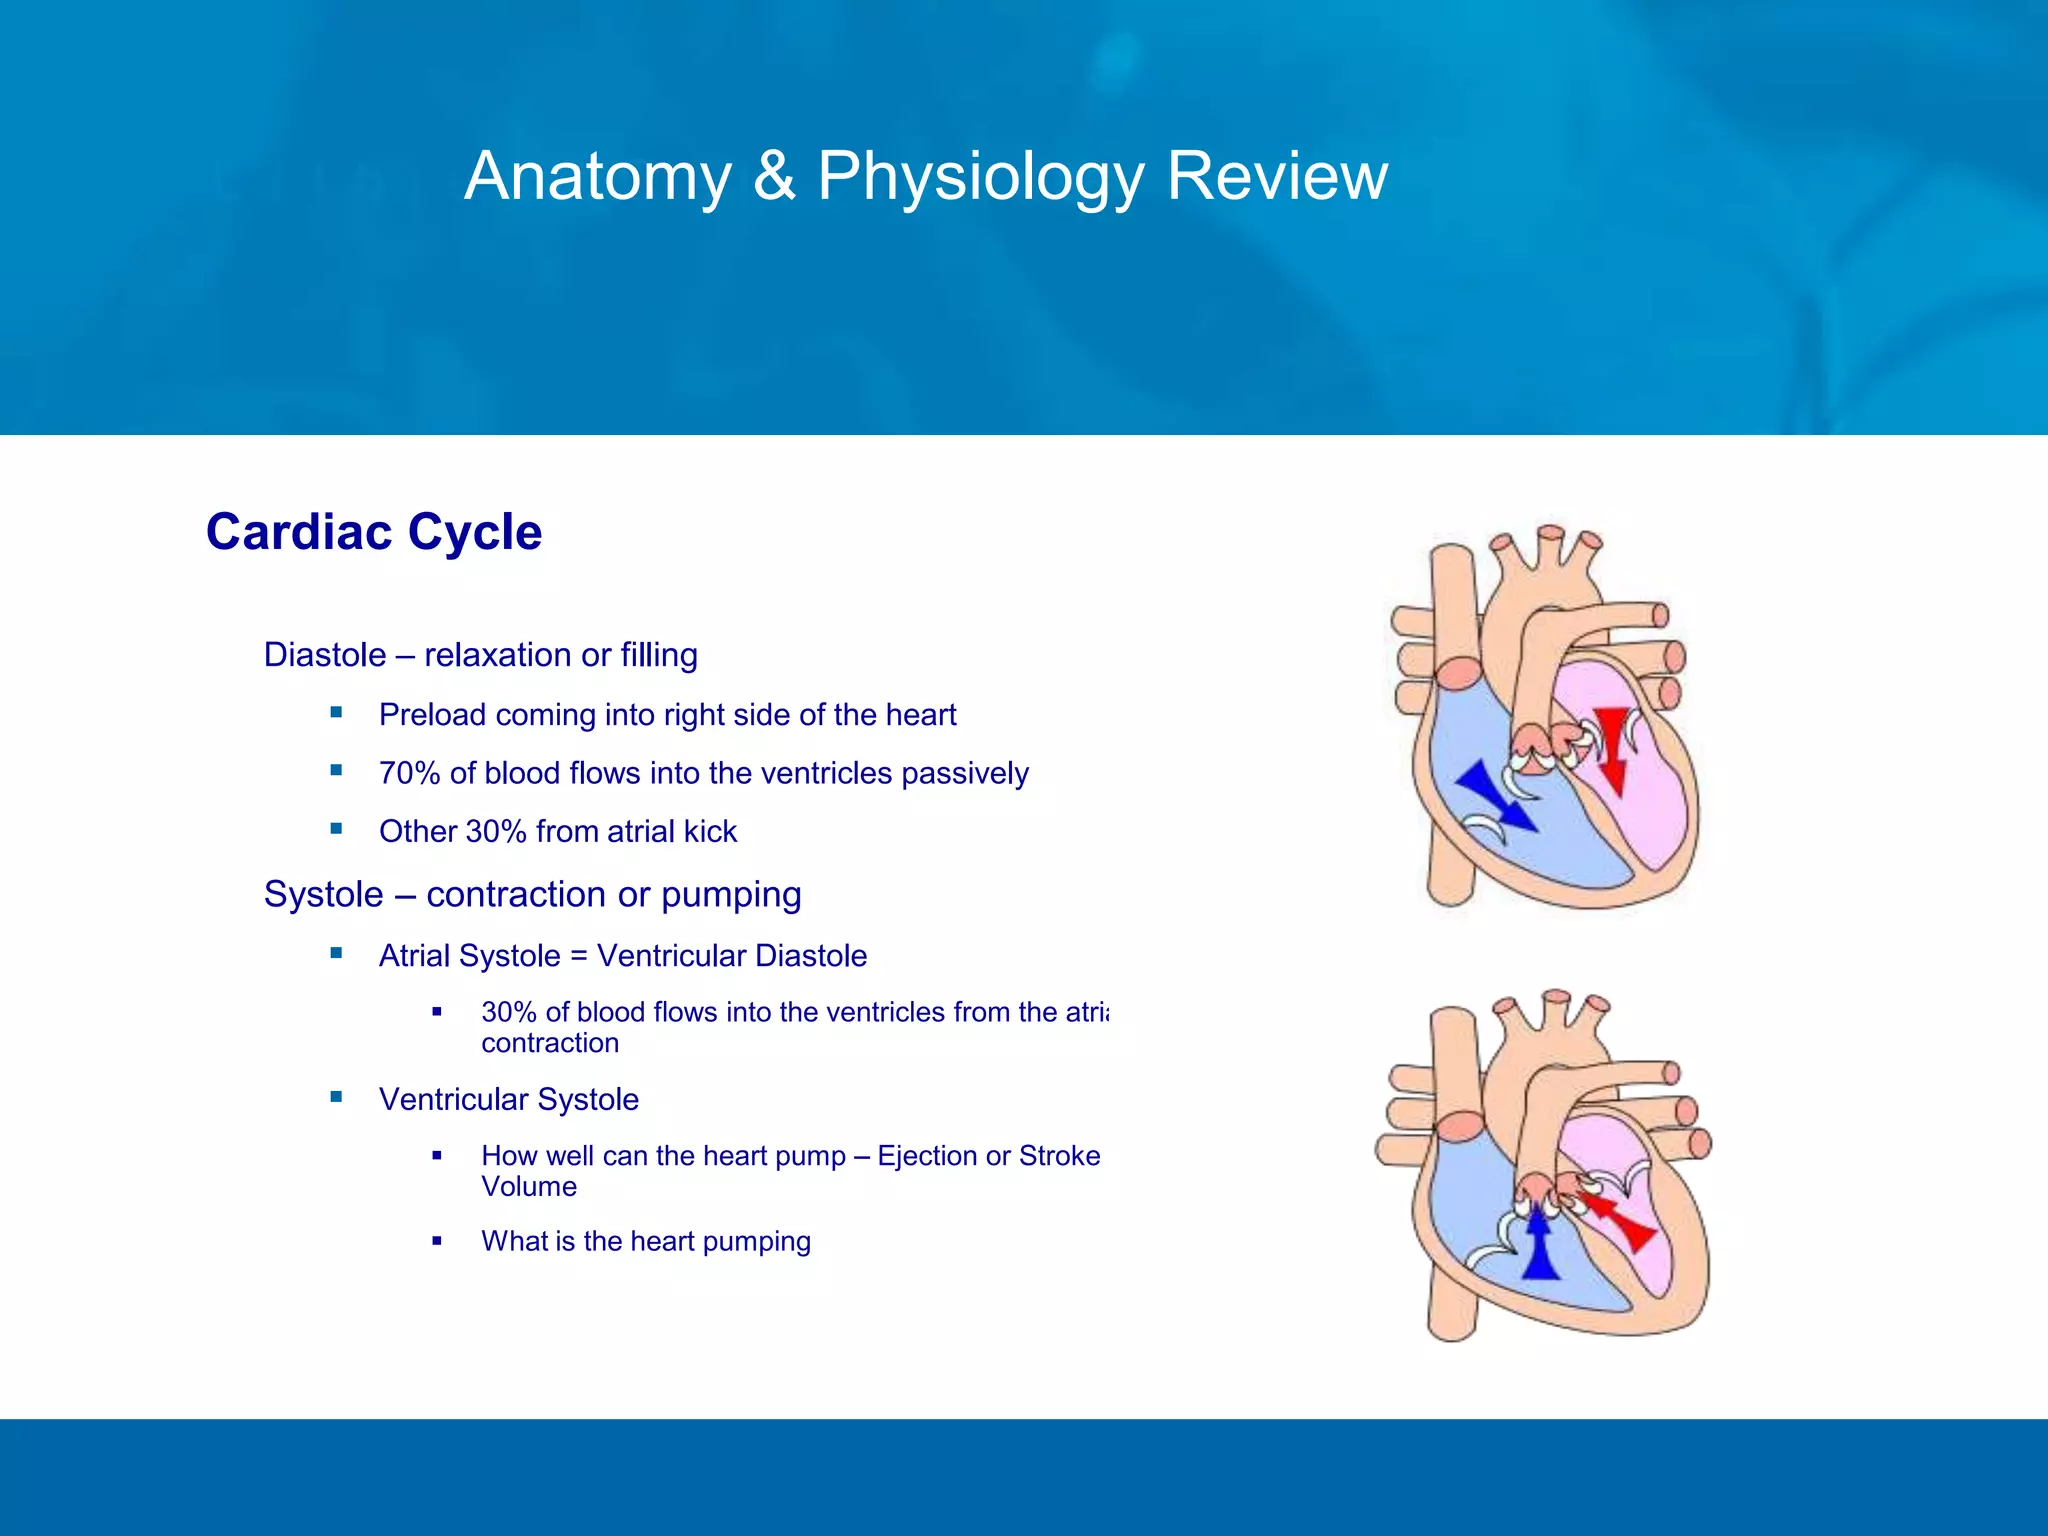
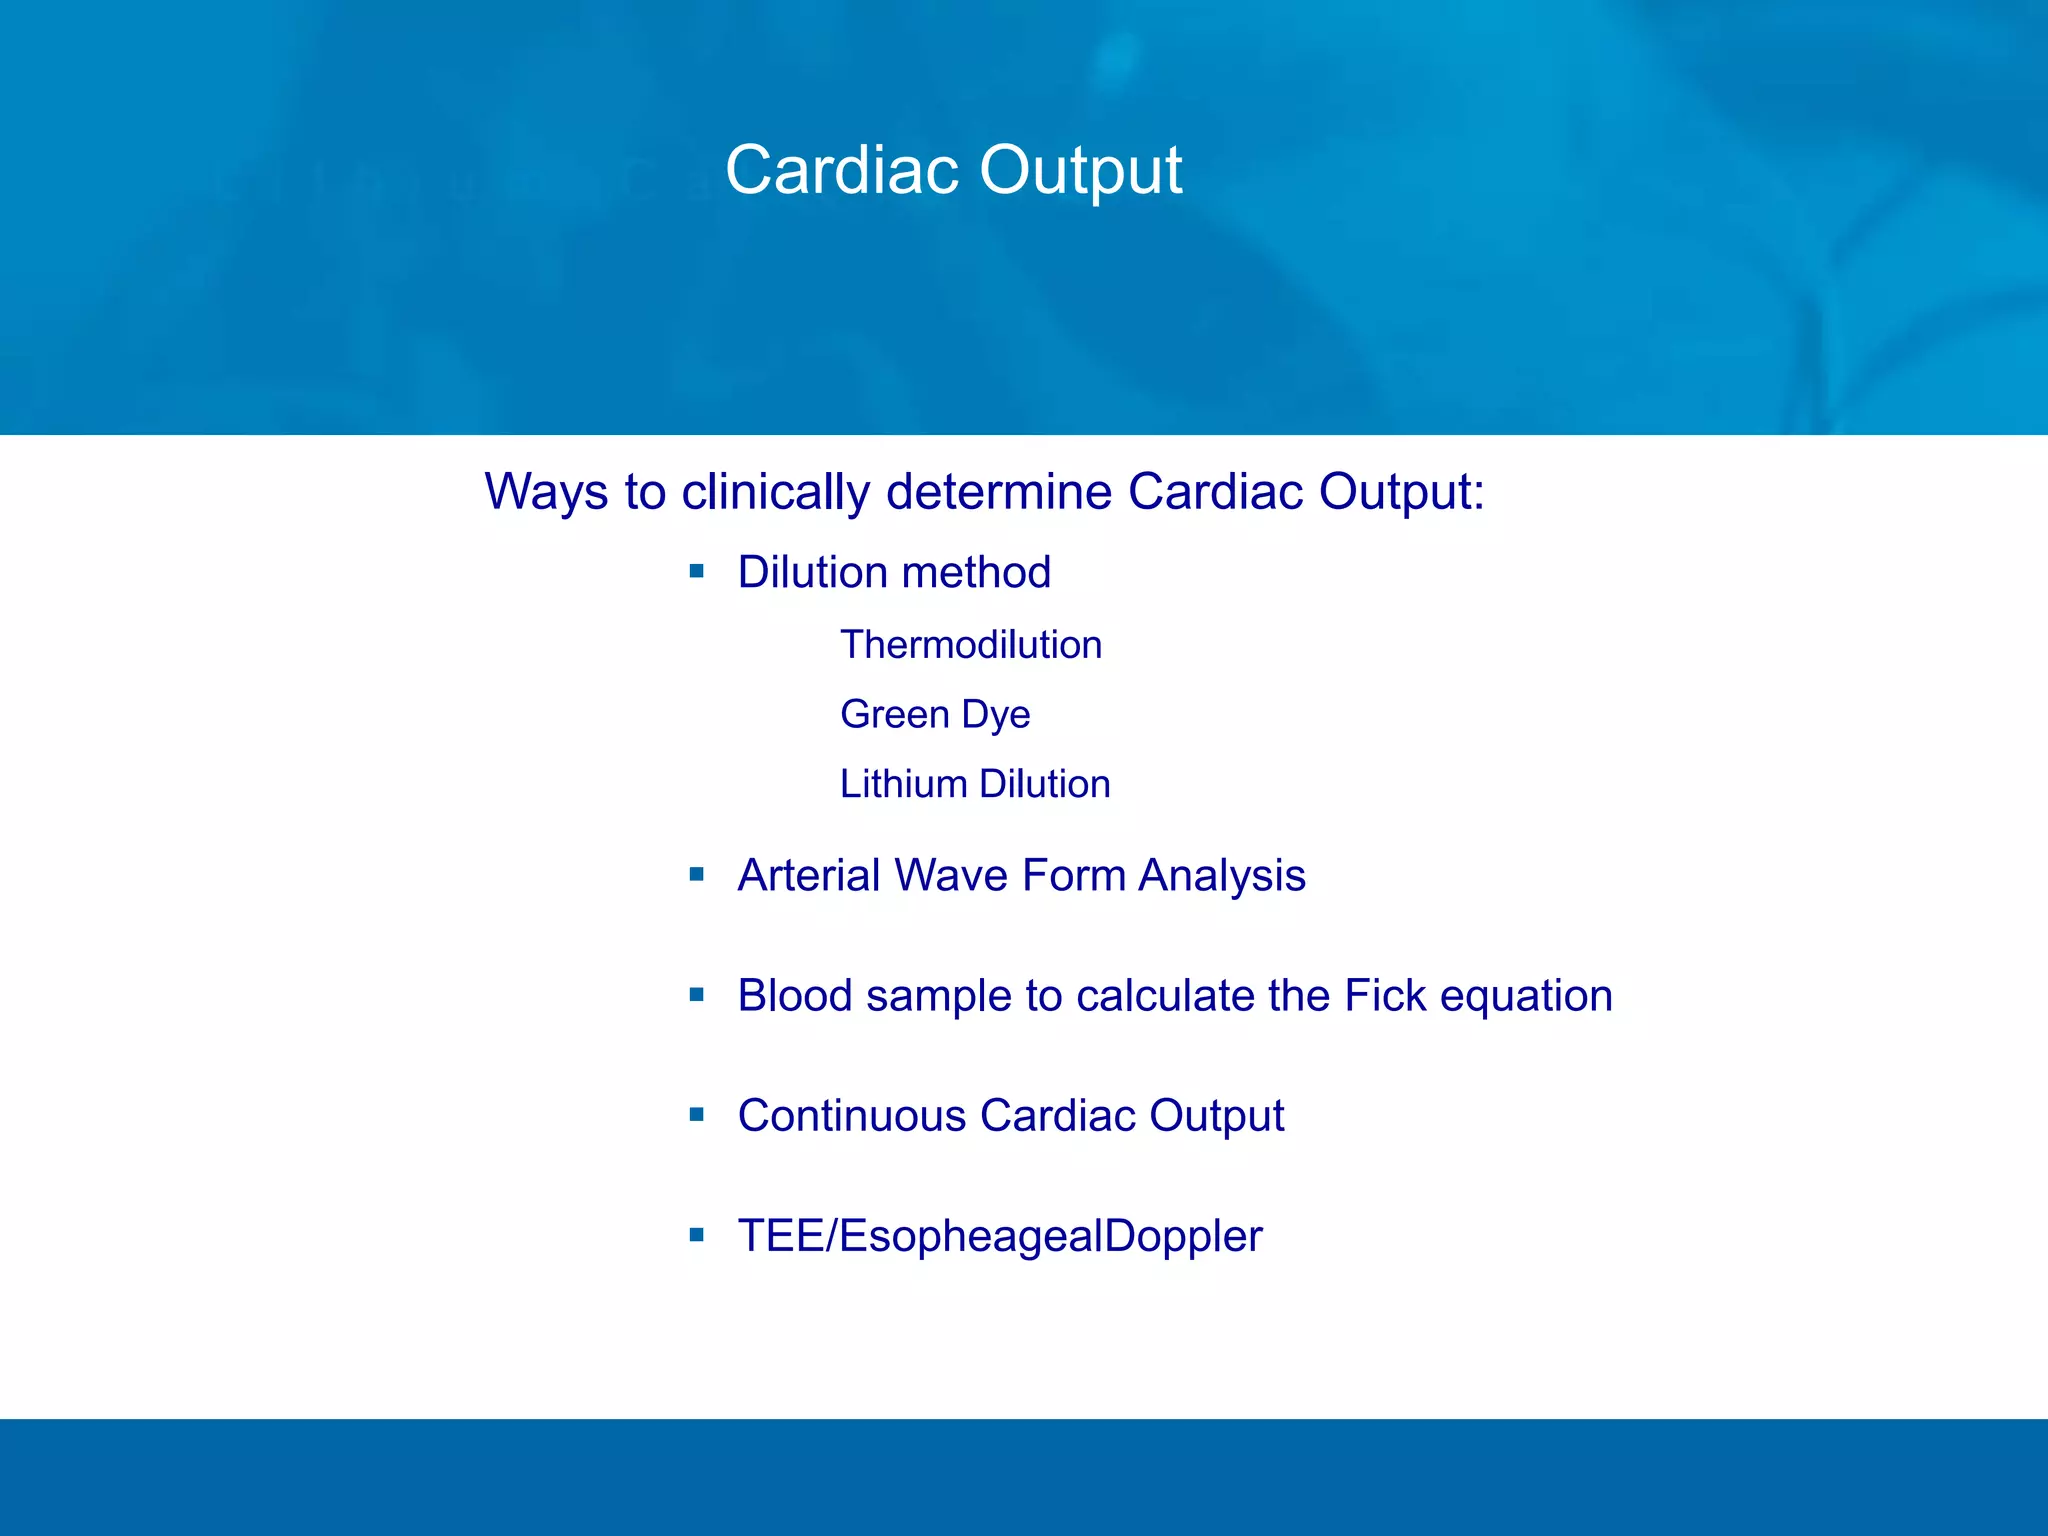
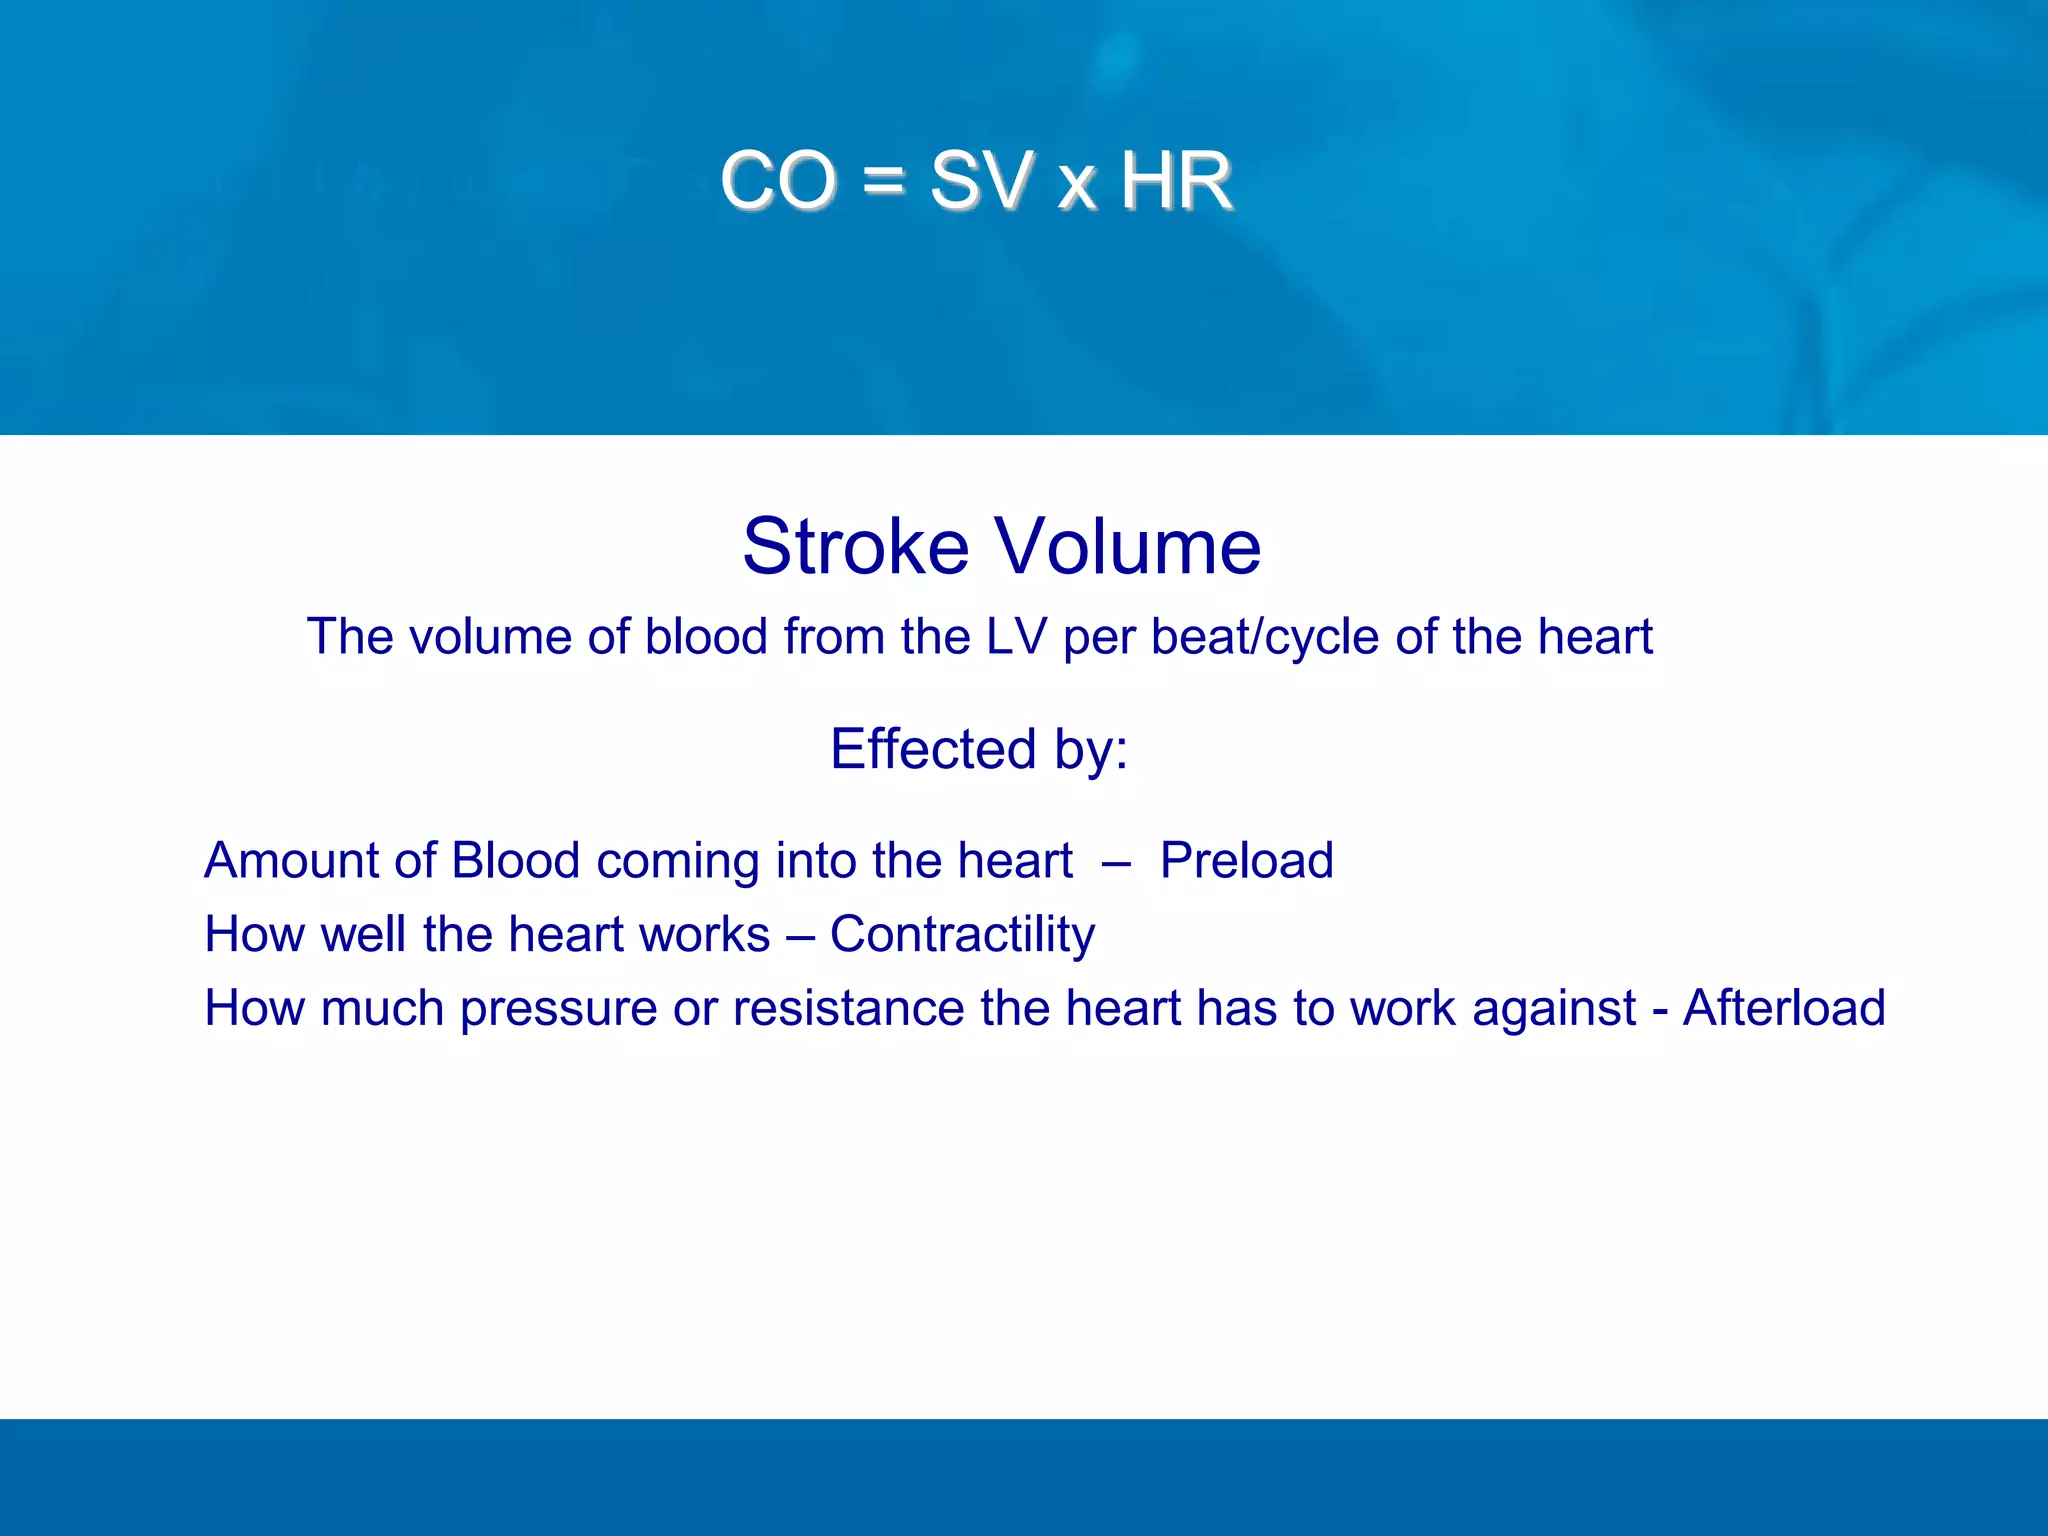
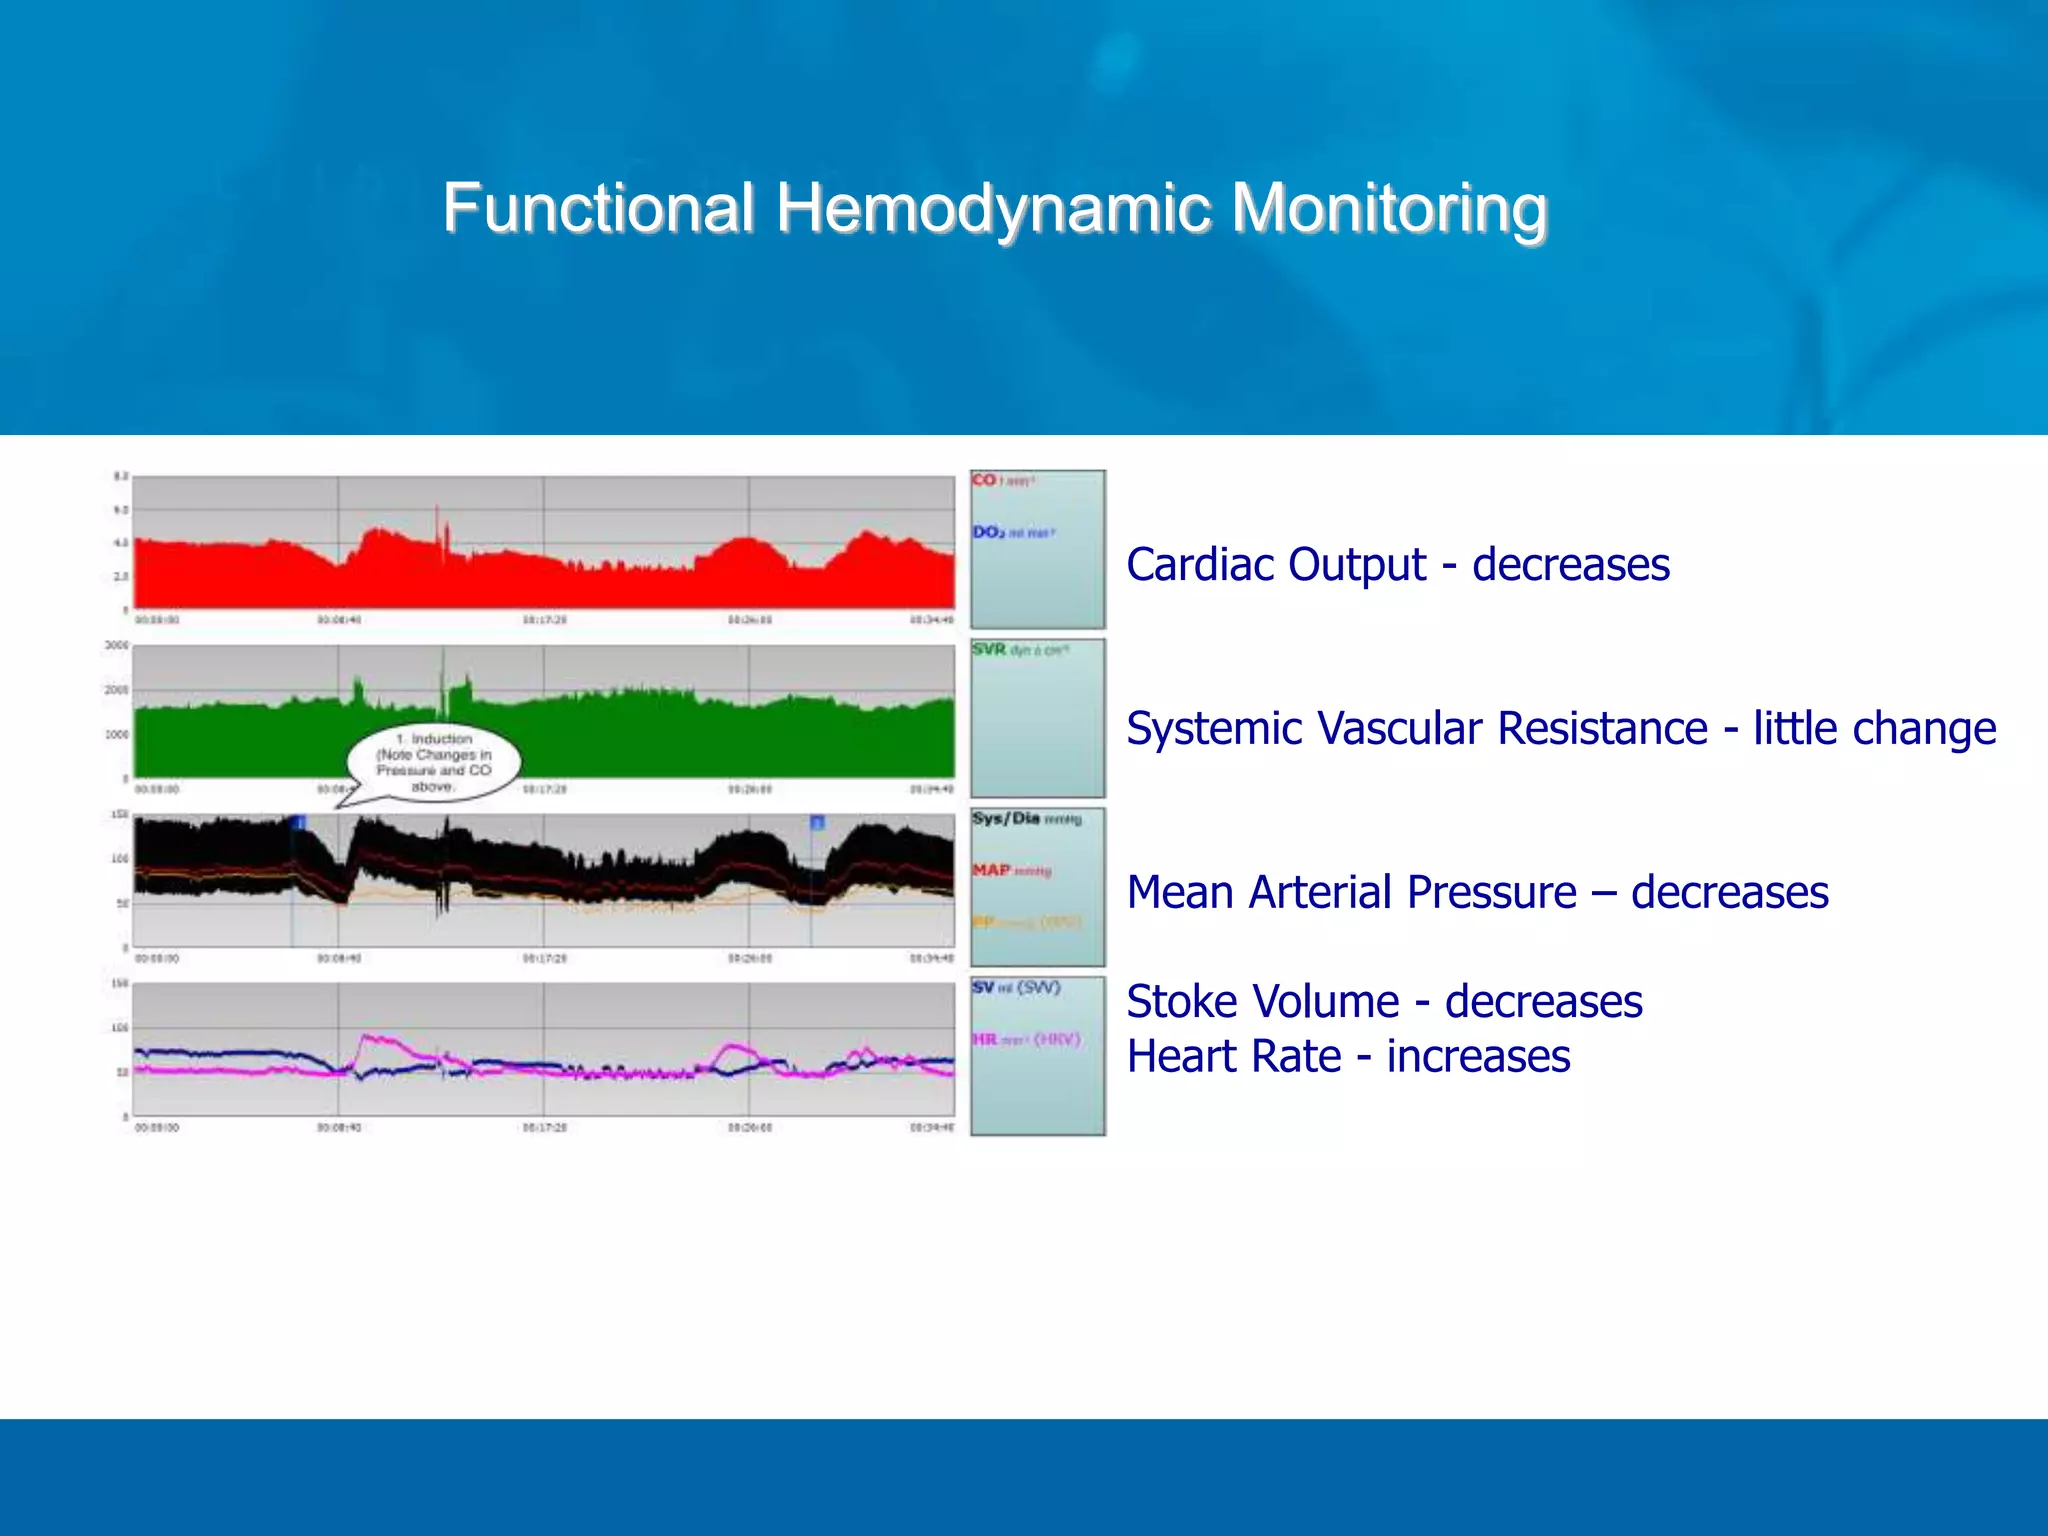
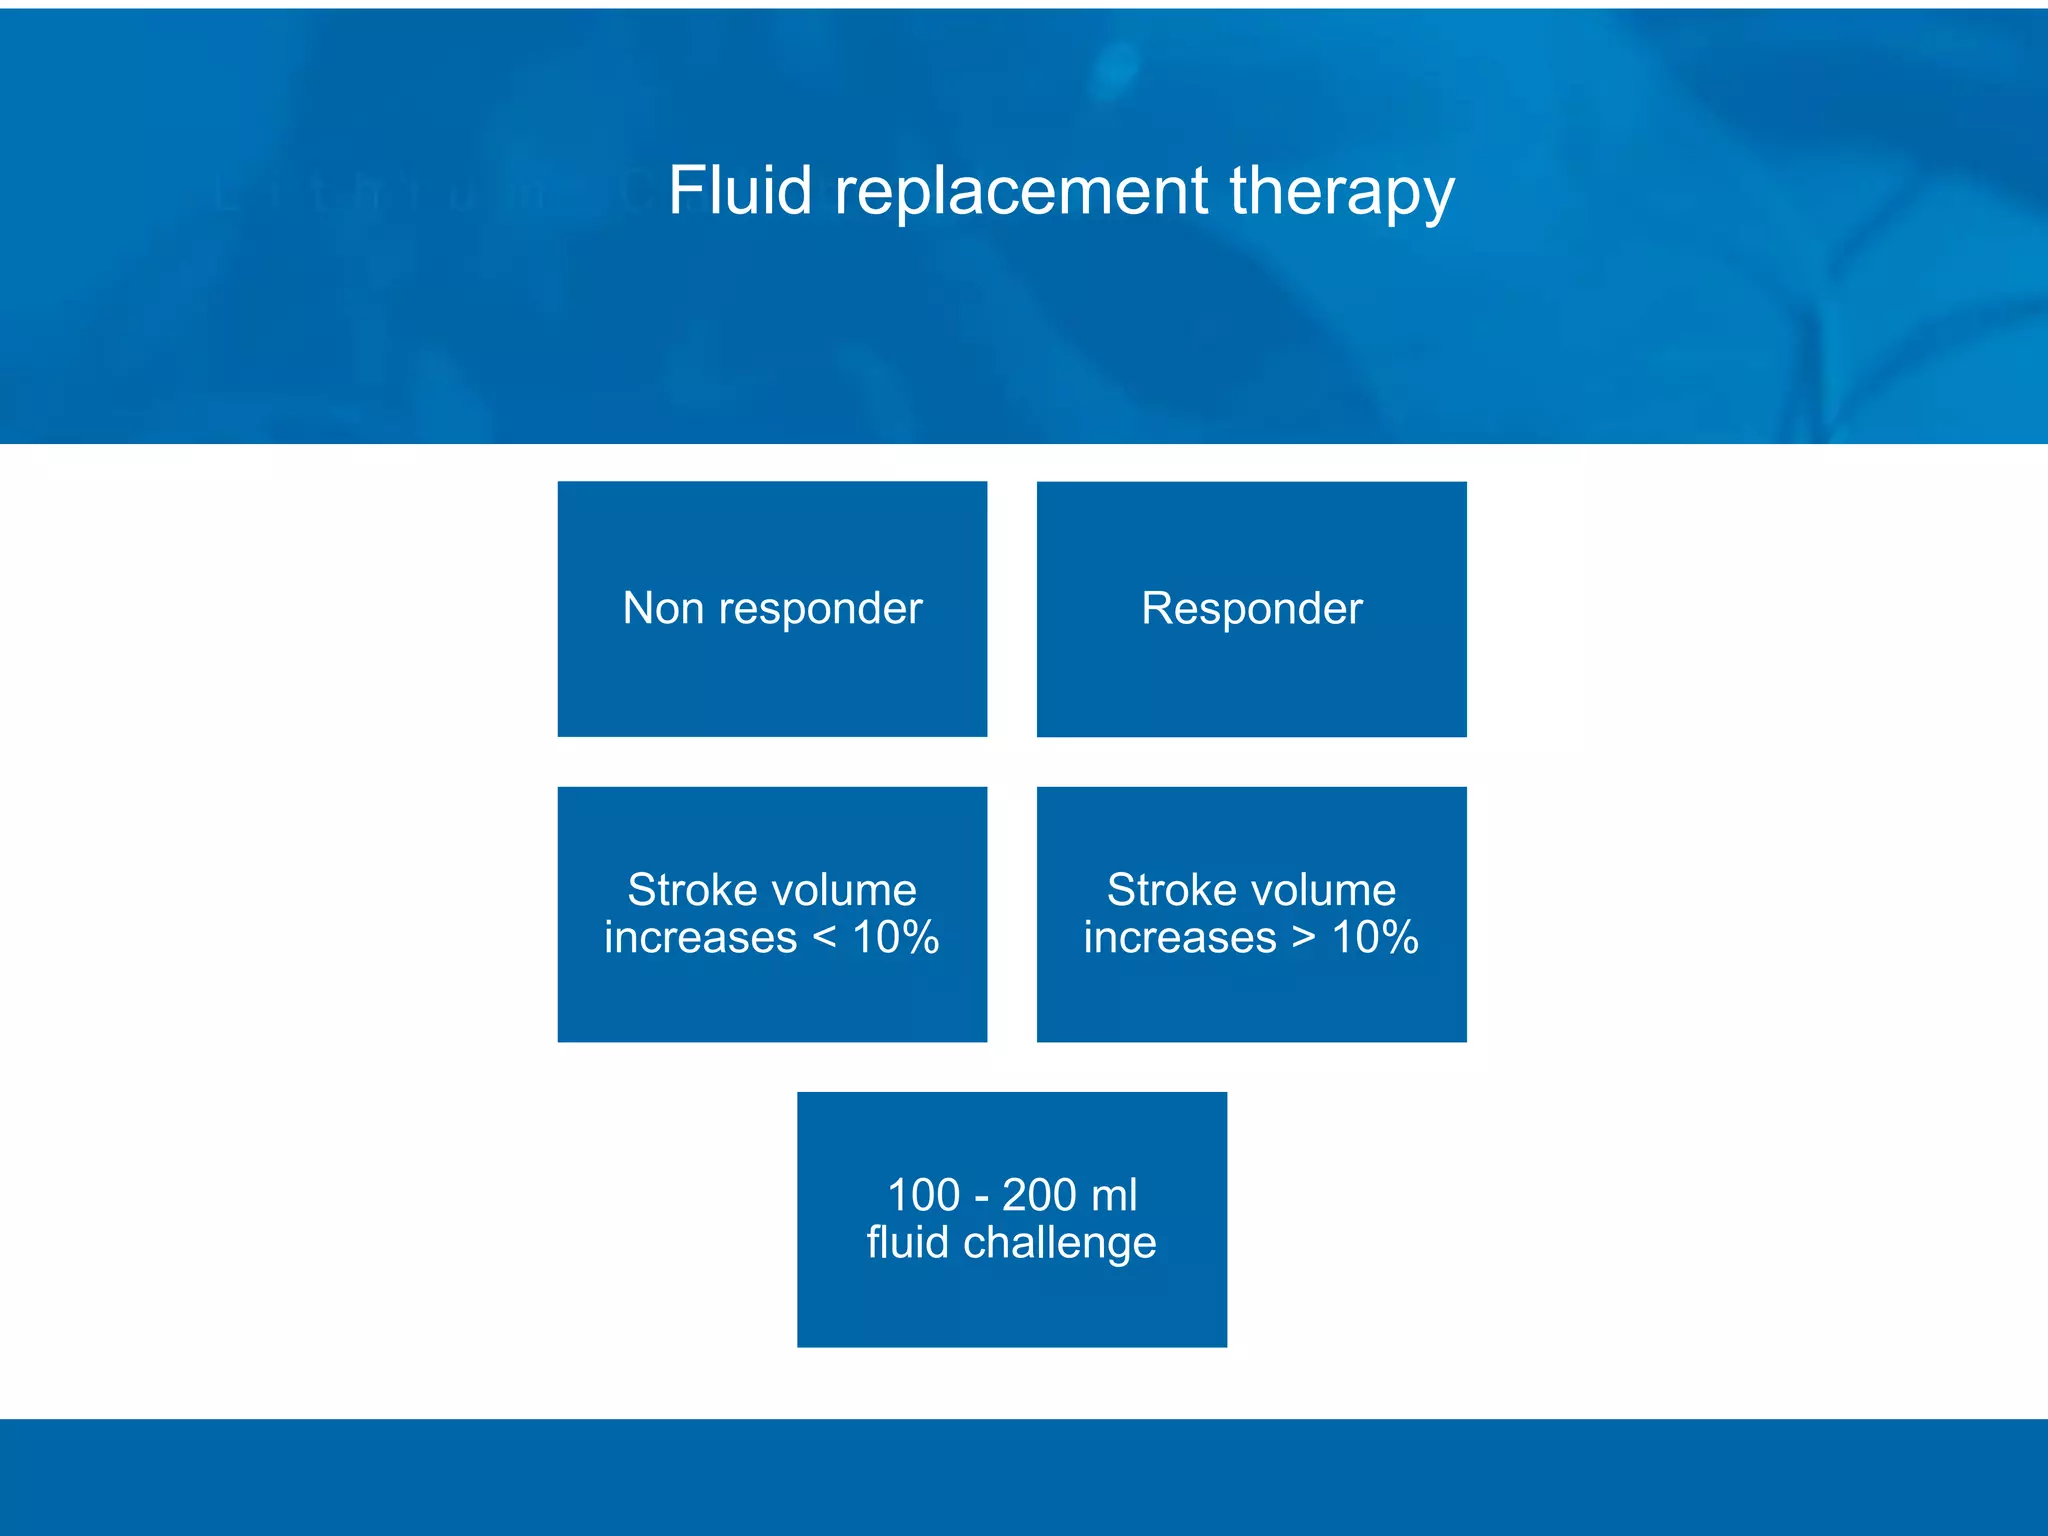
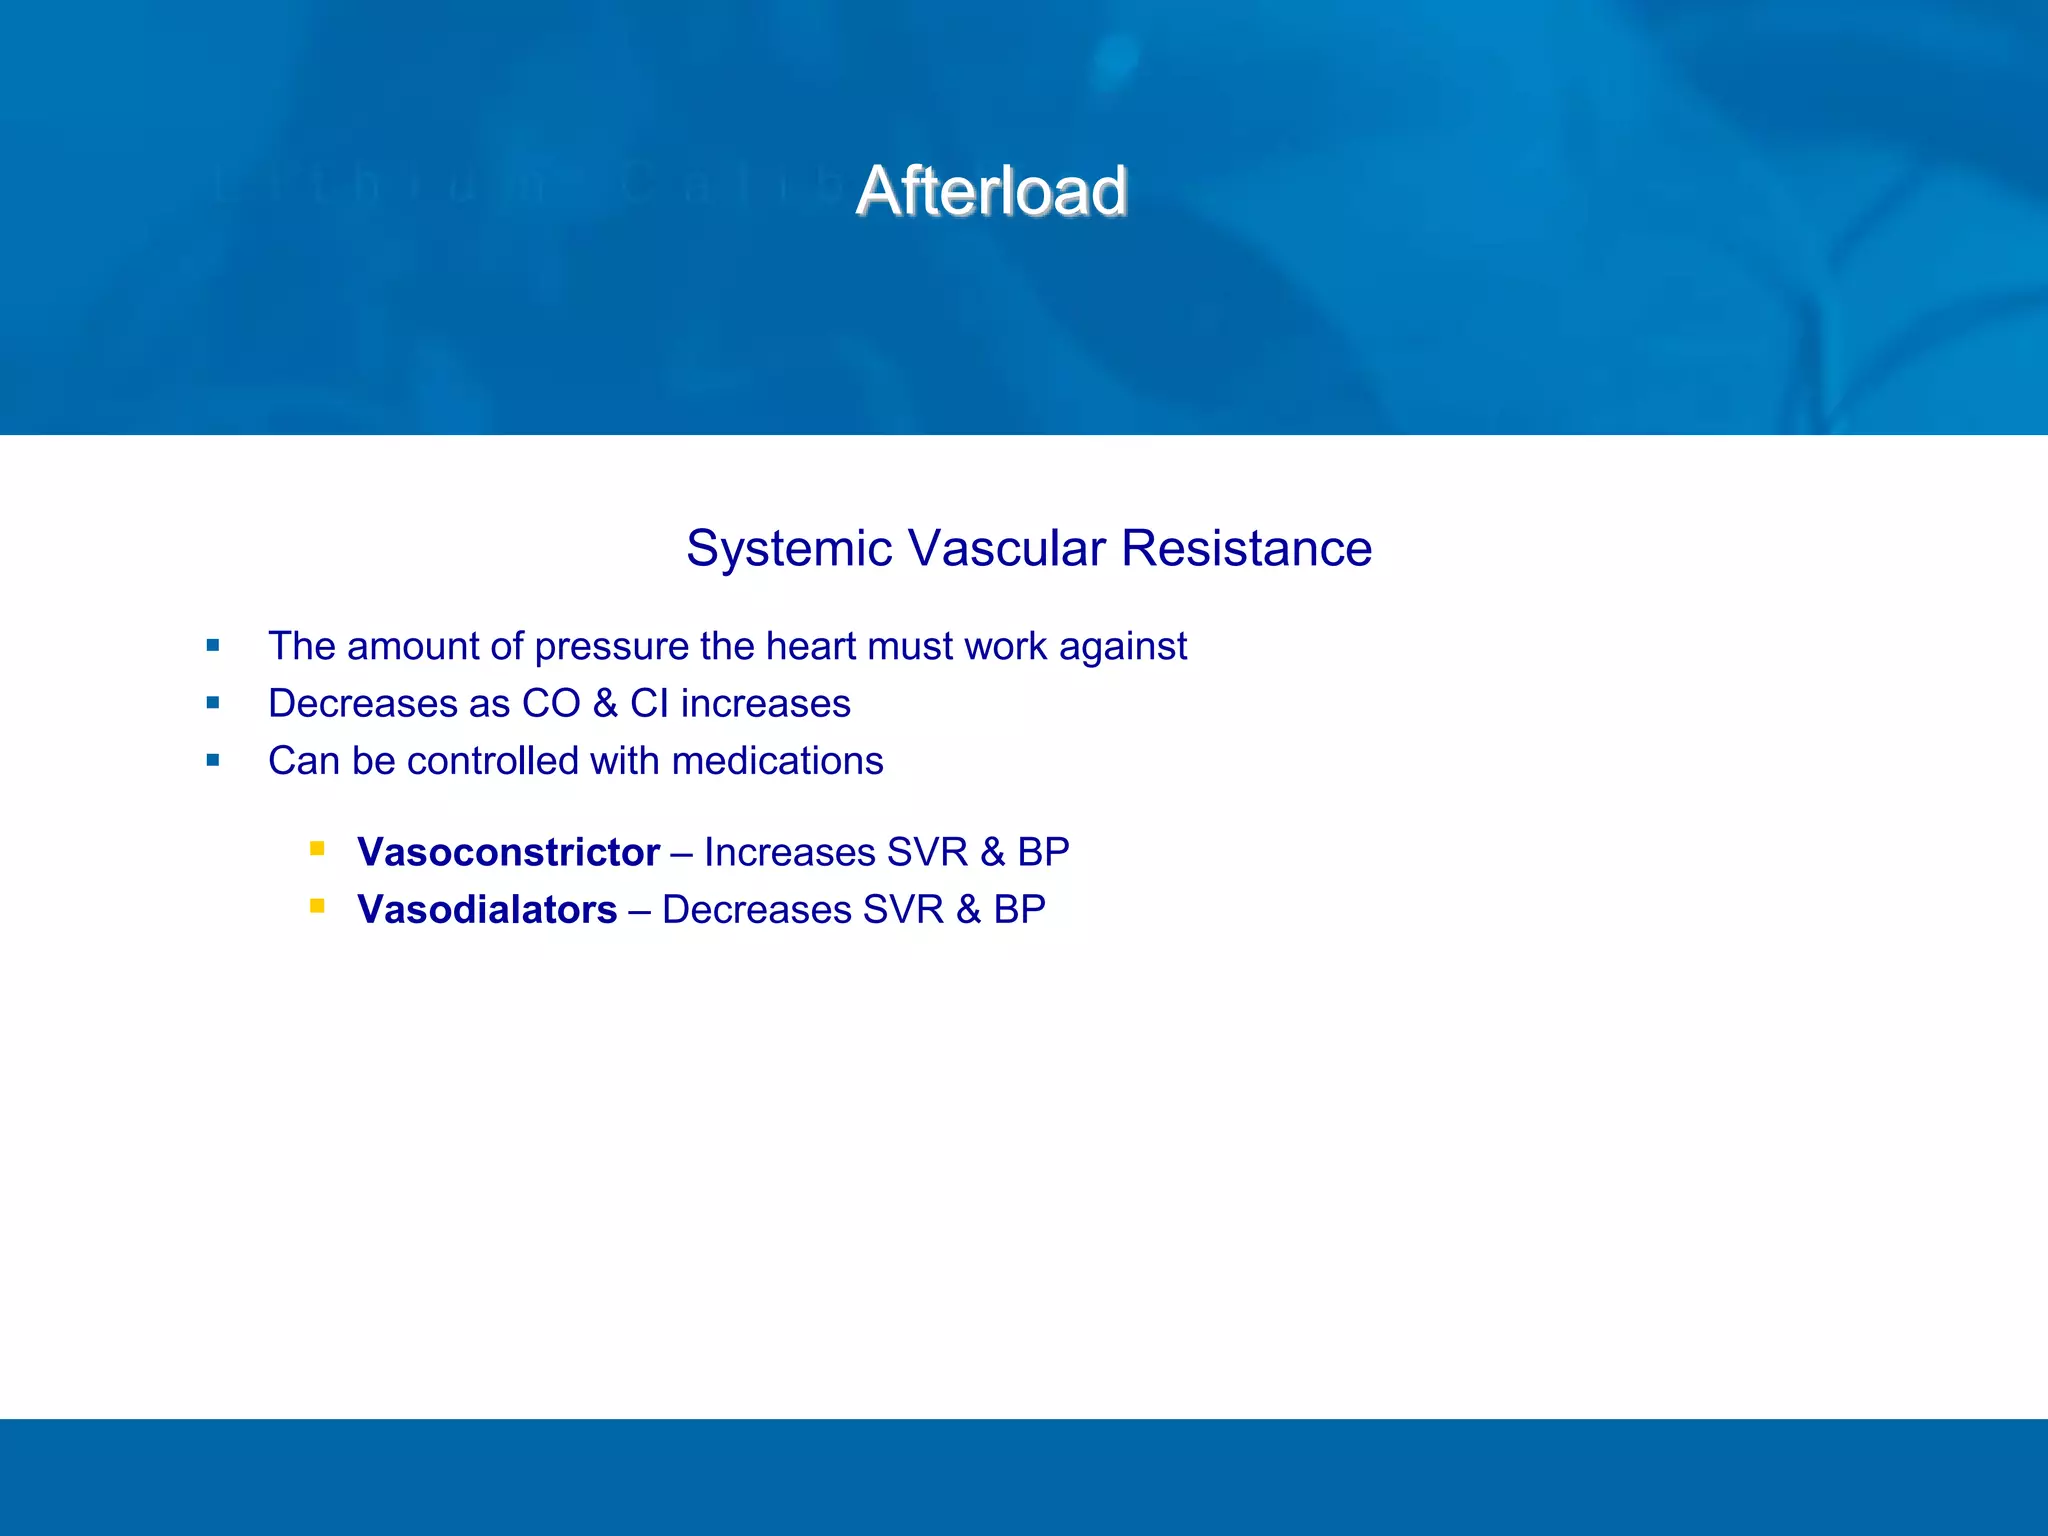
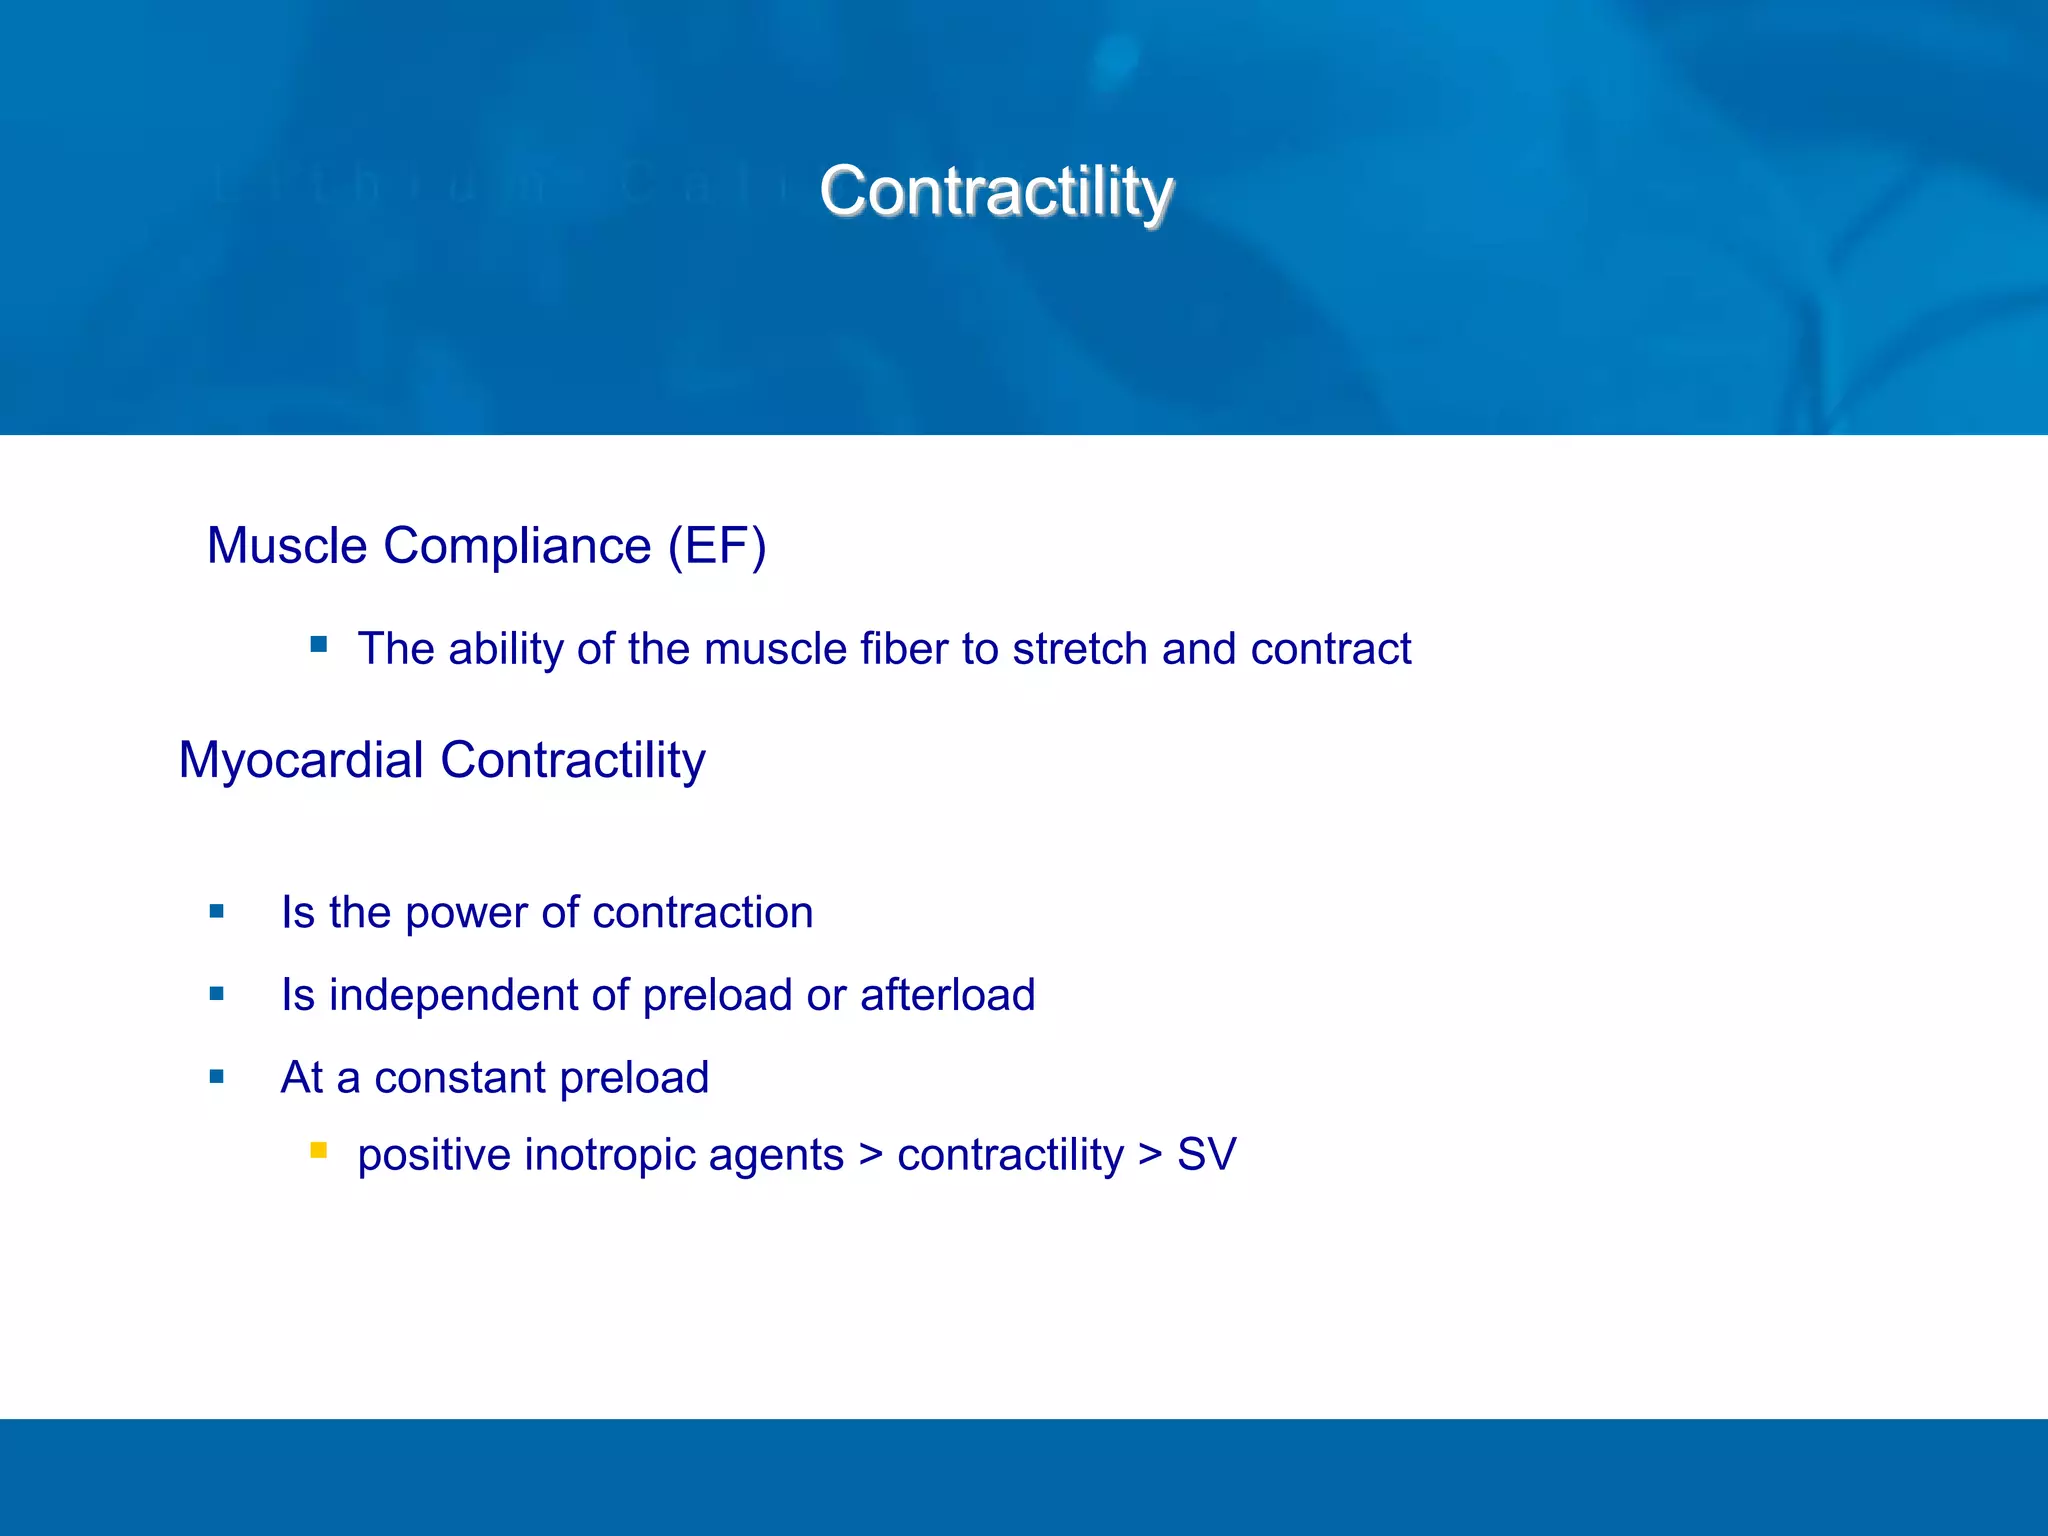
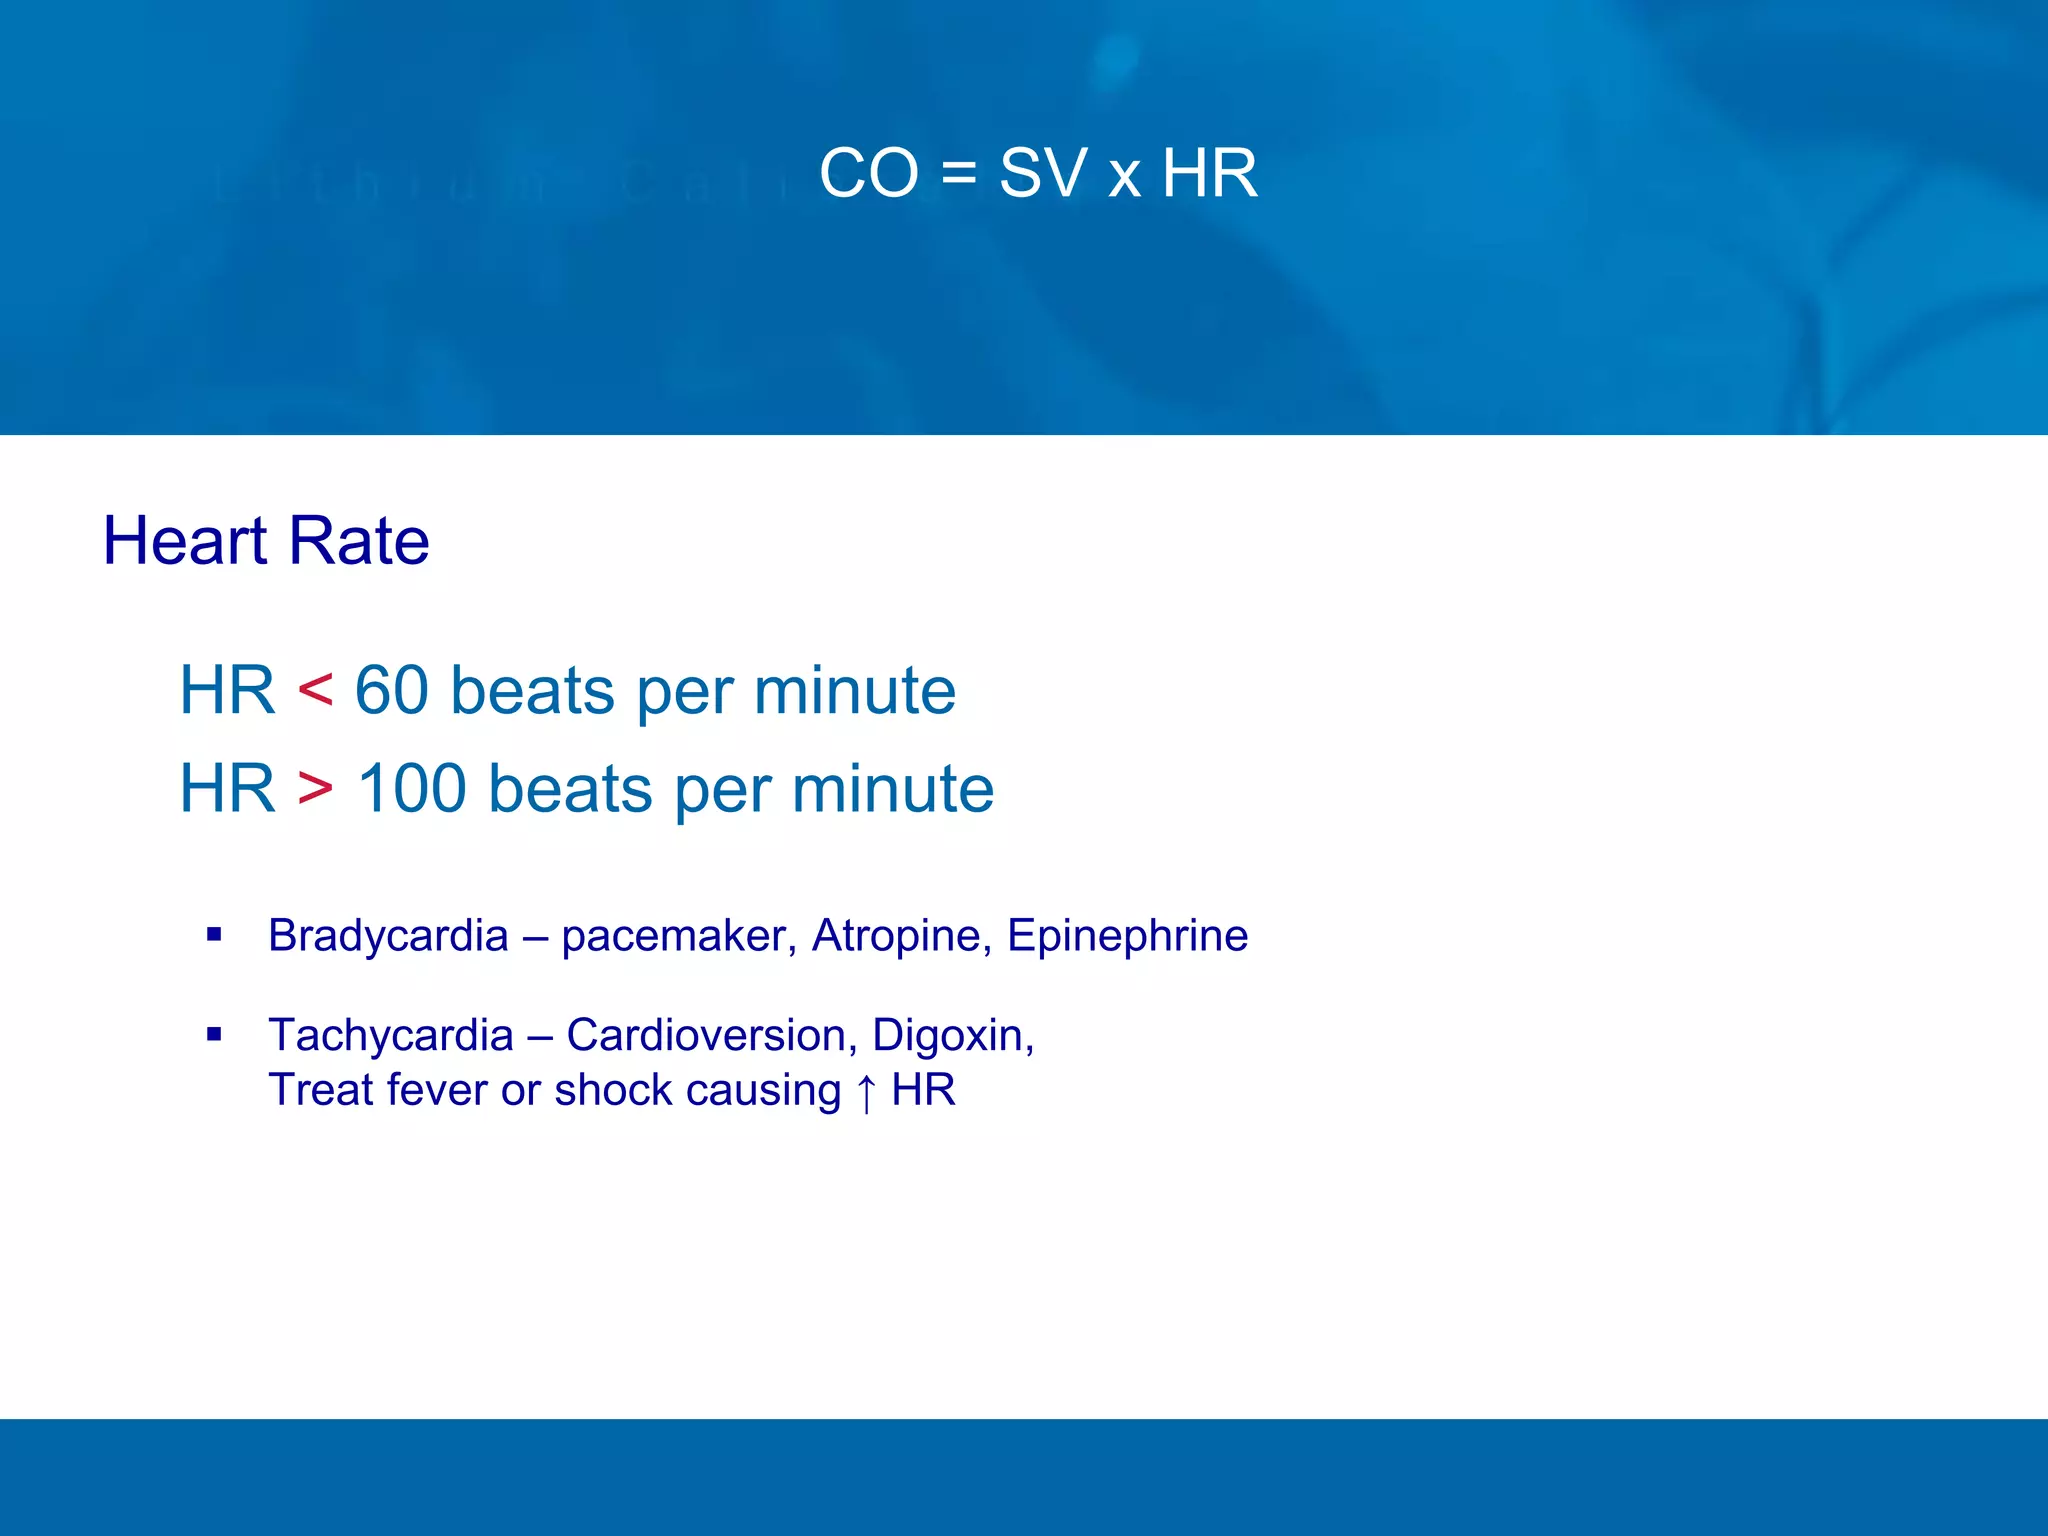
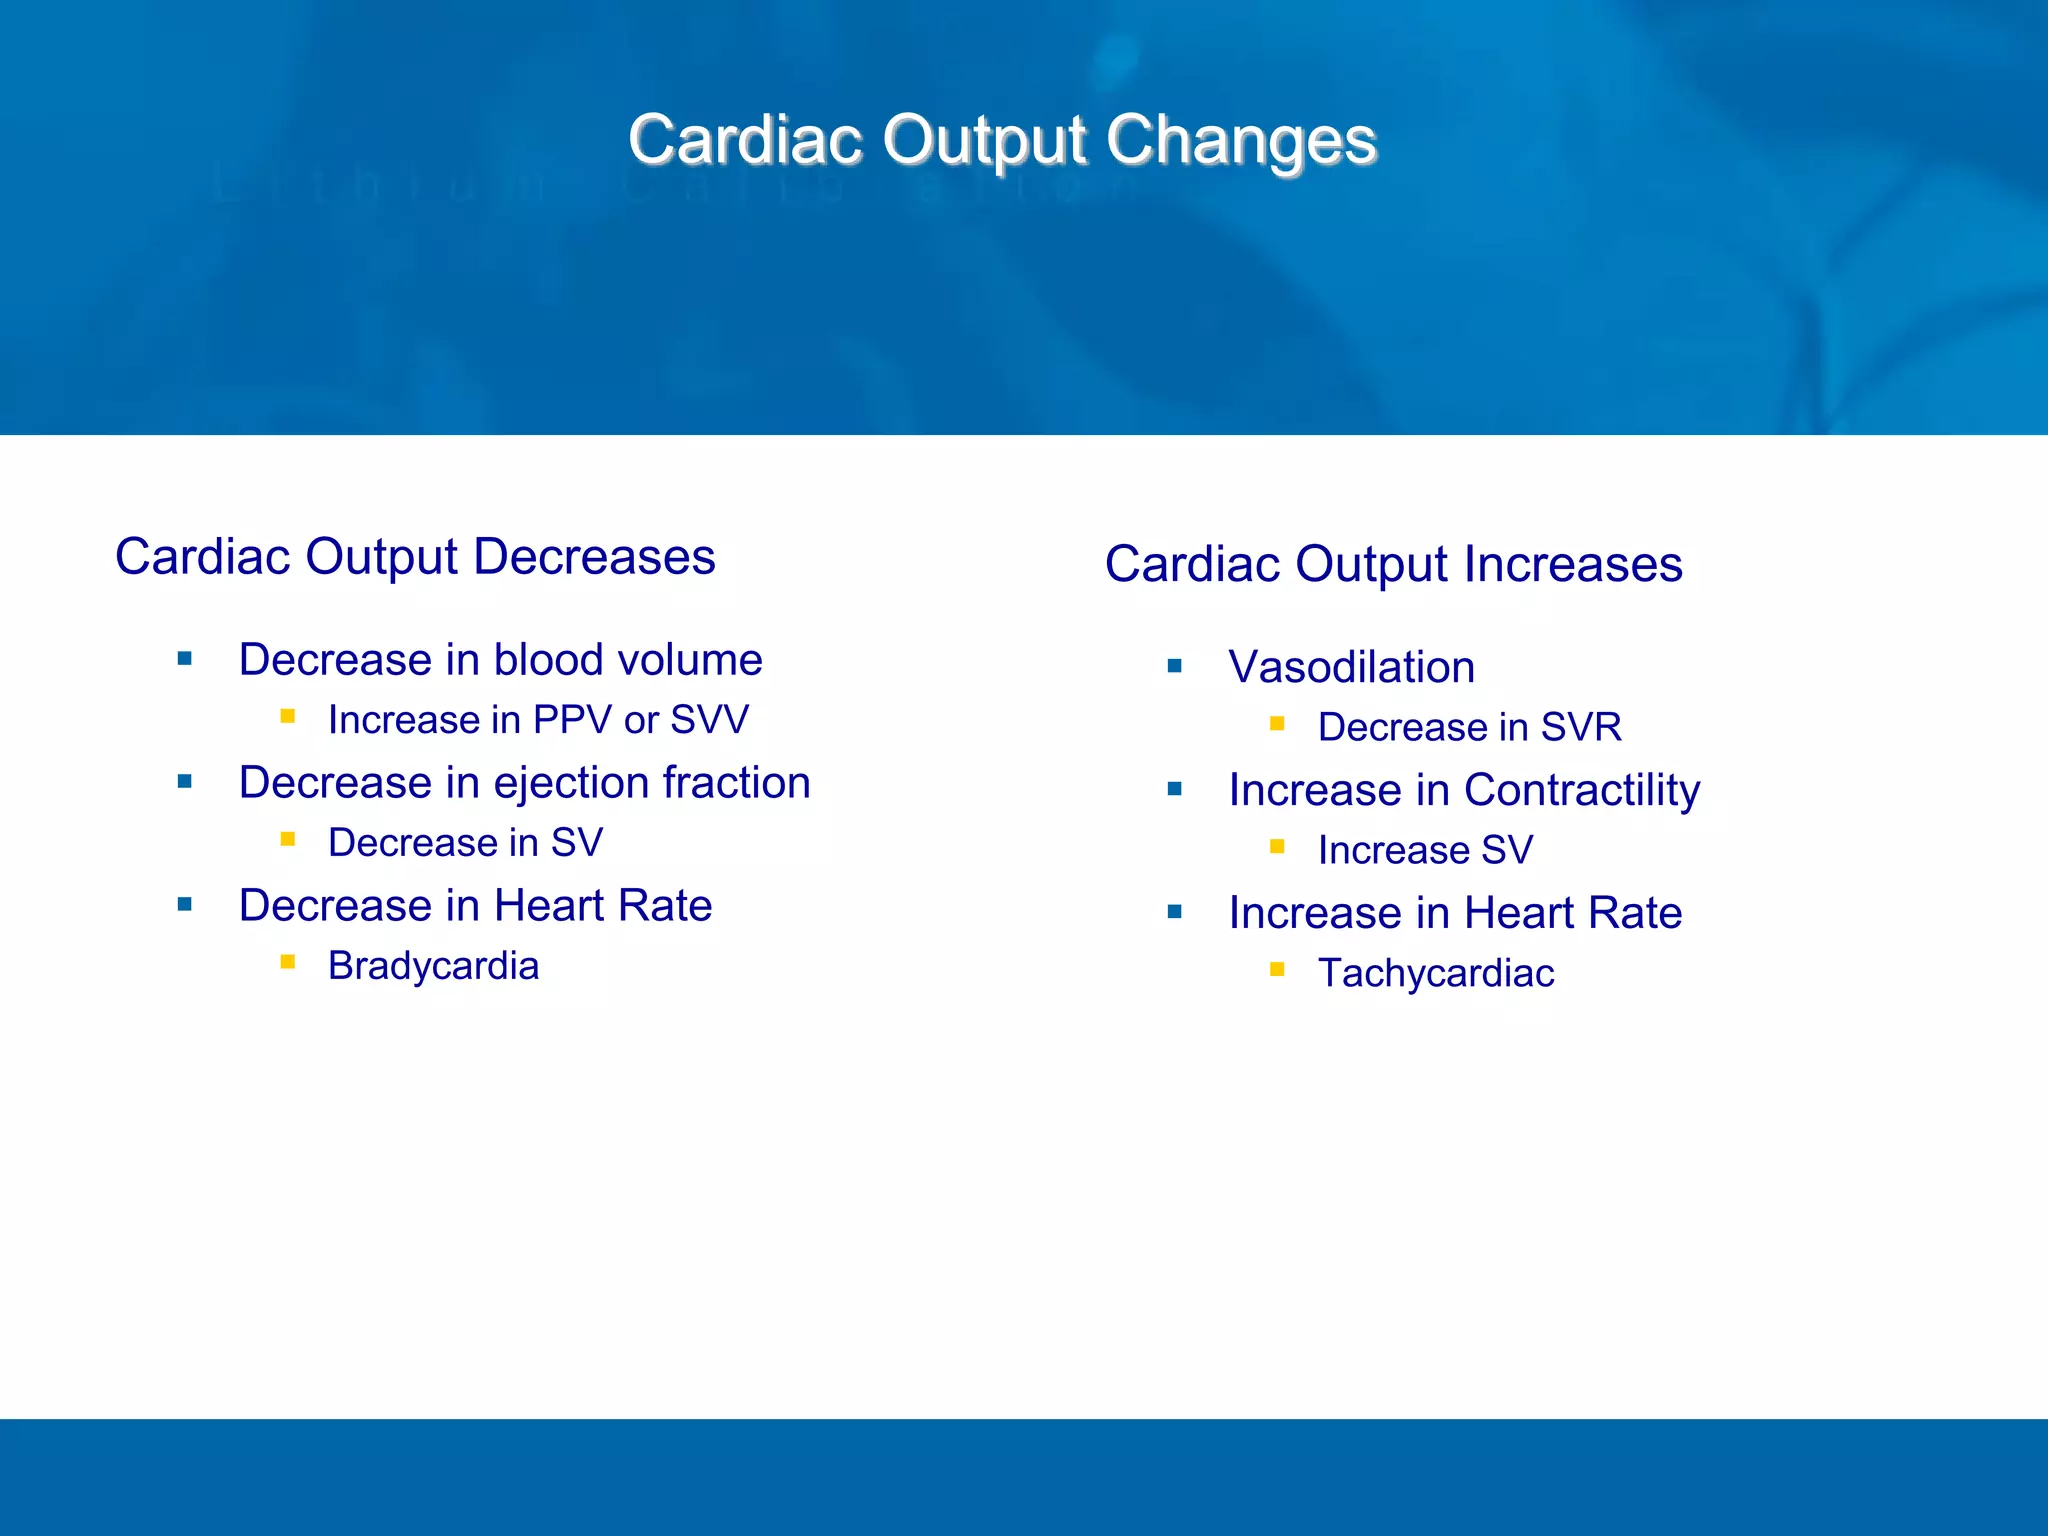
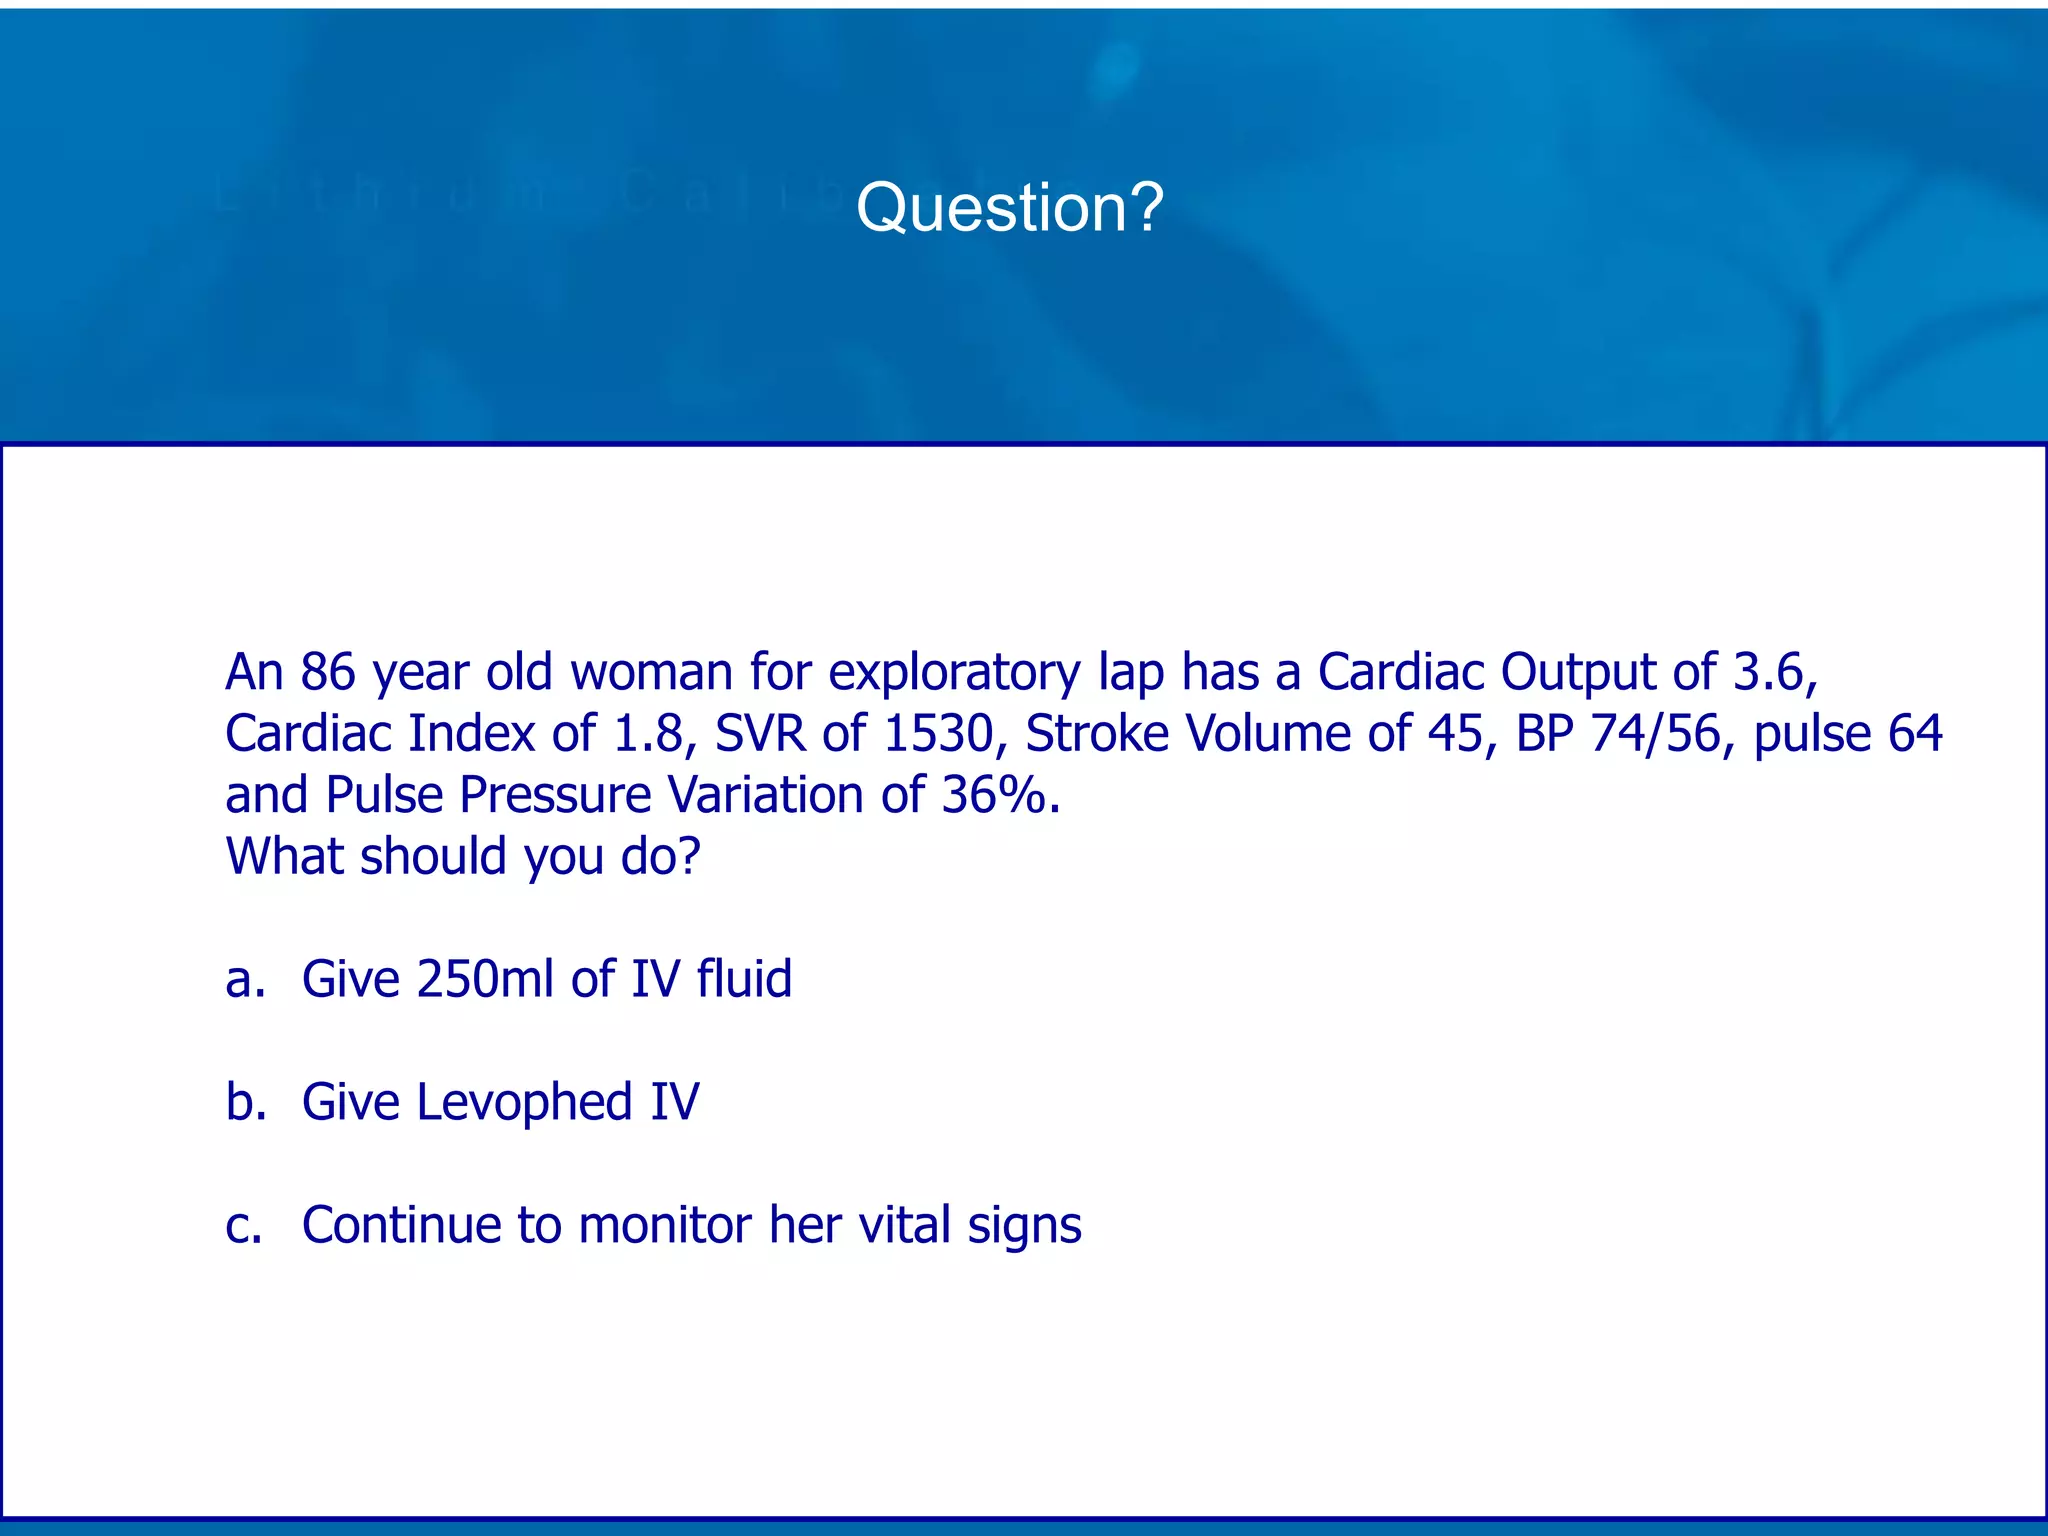
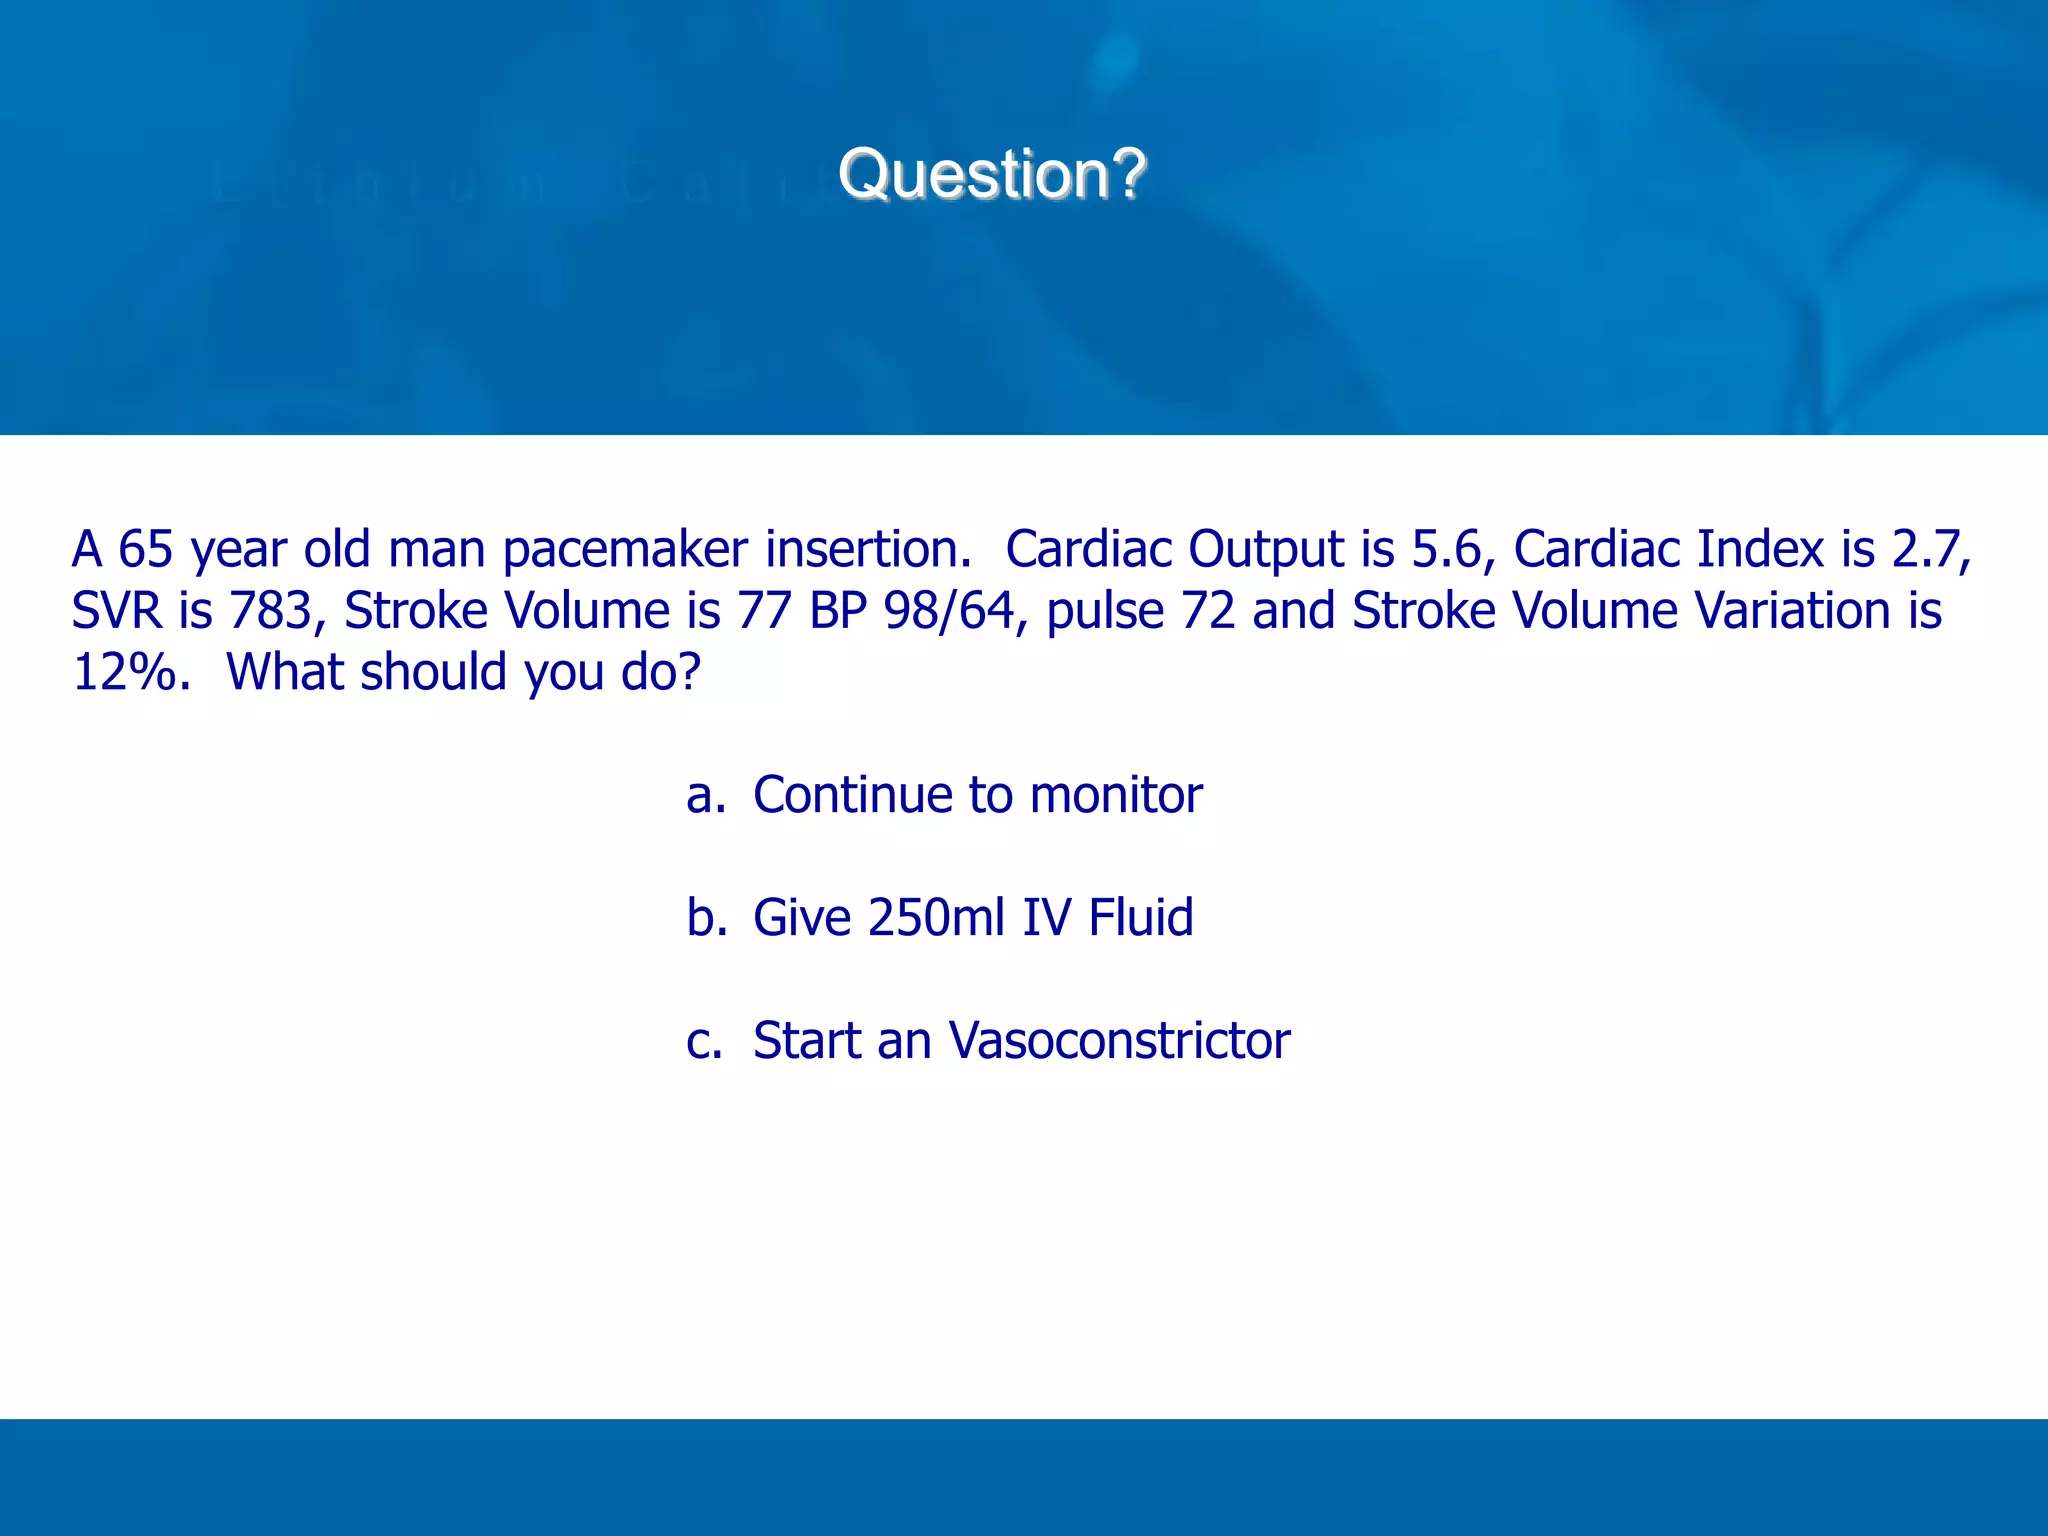
- It discusses cardiac output, stroke volume, preload, contractility, afterload and how they are impacted during procedures. Parameters like pulse pressure variation above 13% indicate fluid responsiveness.
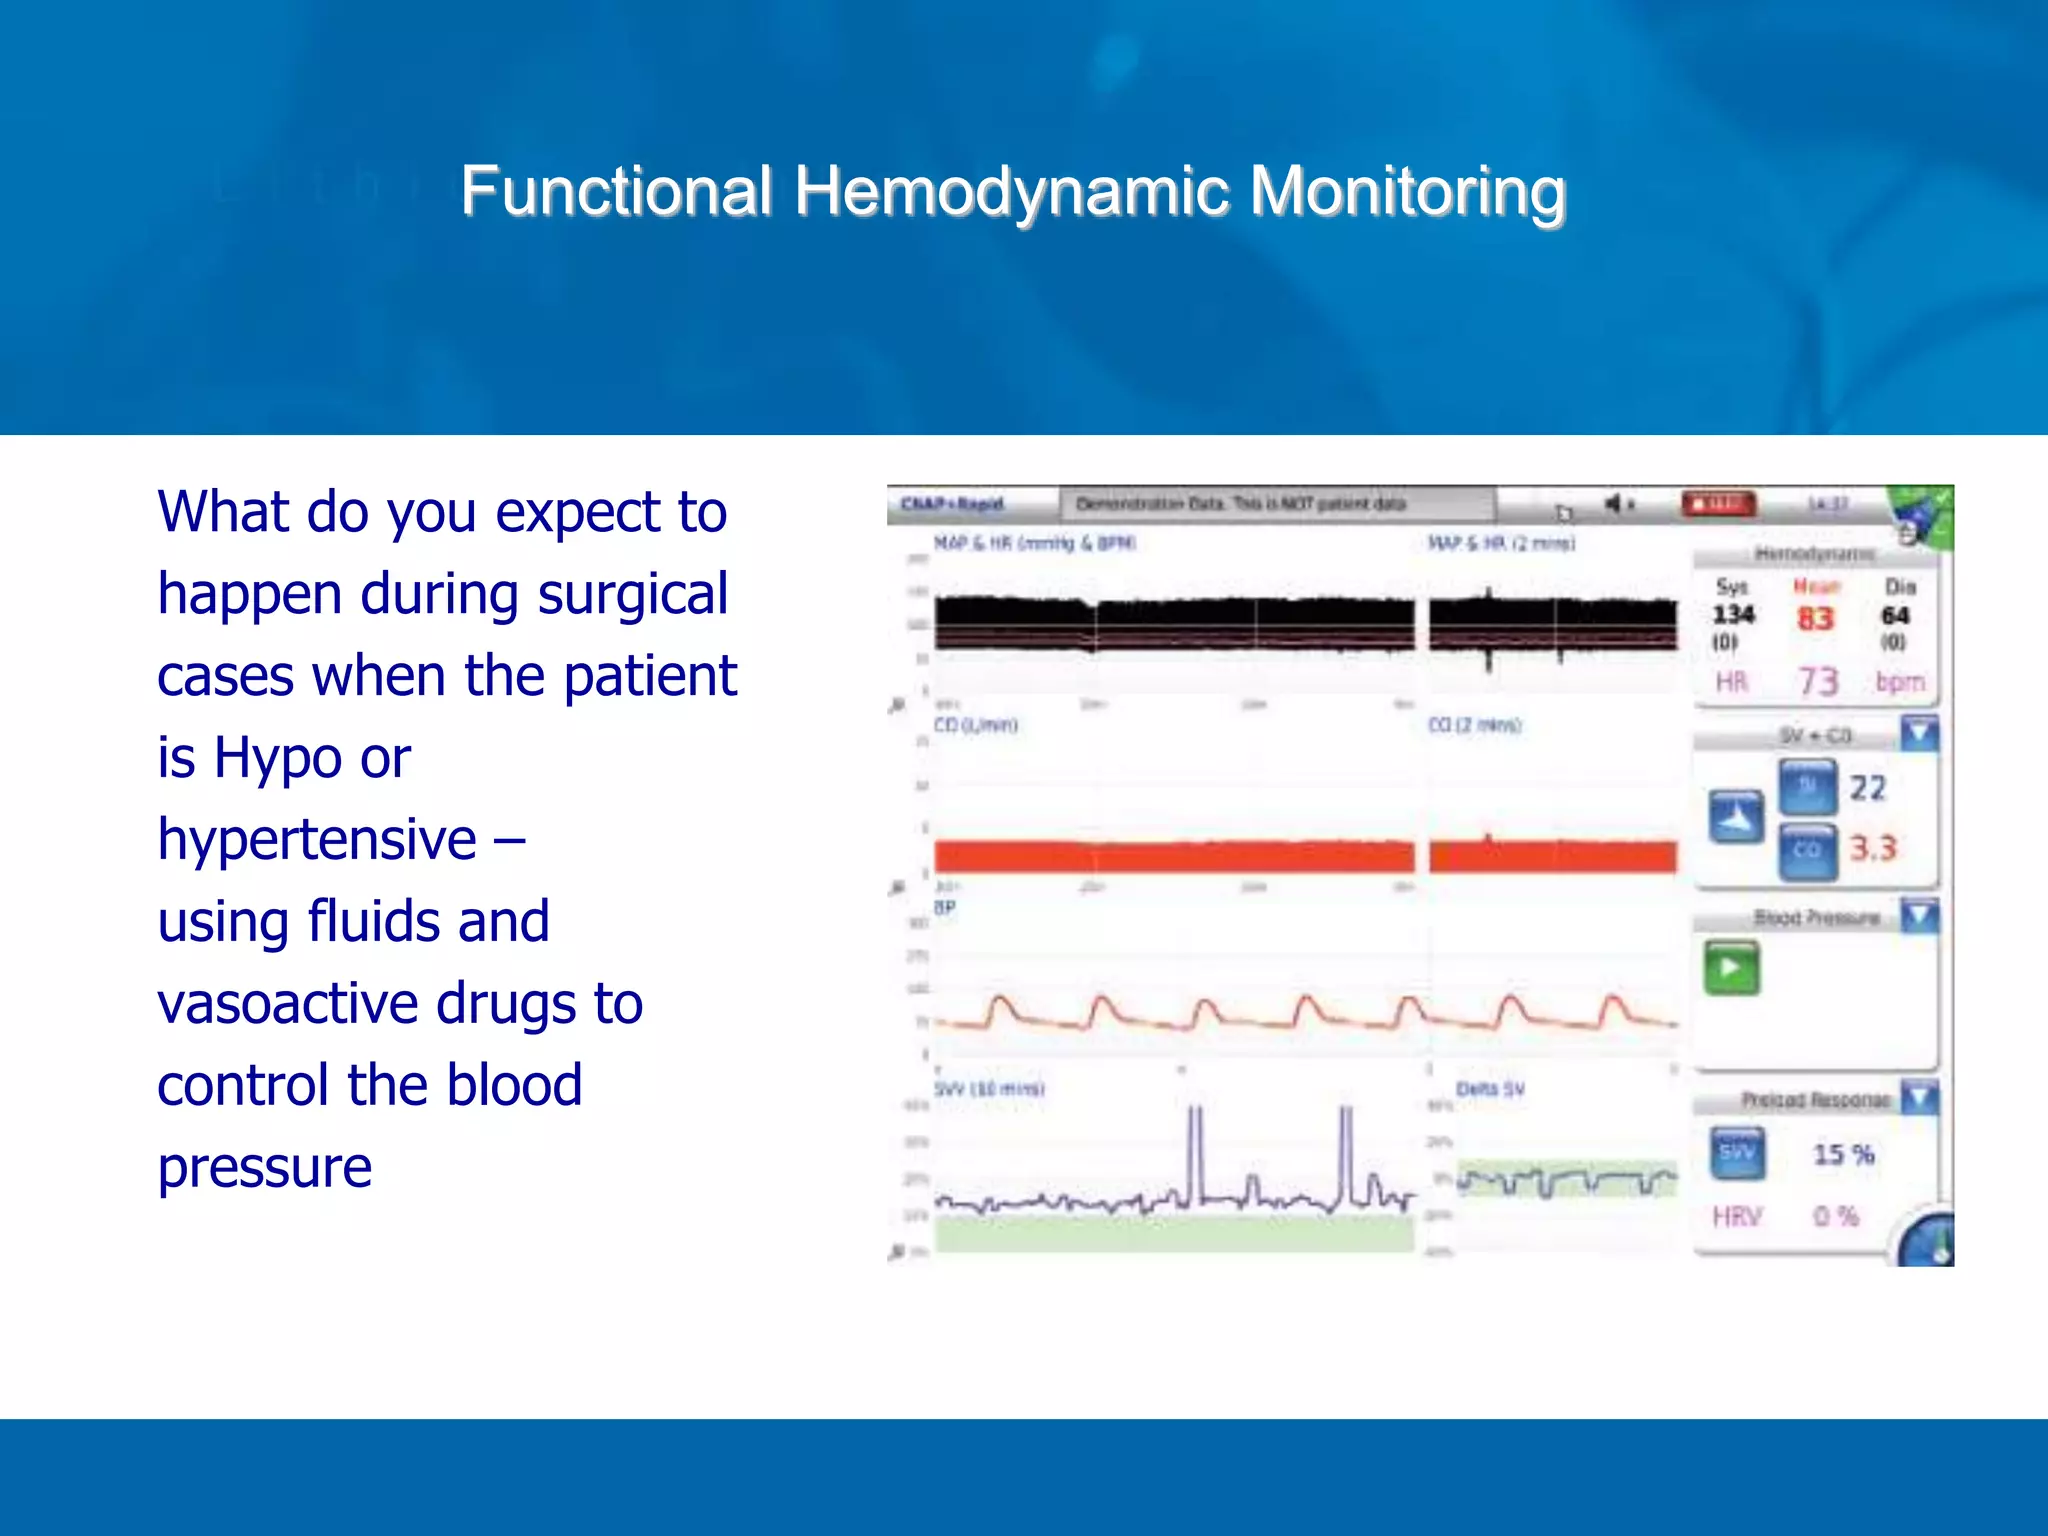
- Positioning and blood loss can significantly impact hemodynamics during surgery, and continuous monitoring can help guide fluid and vasoactive drug management to support cardiac output and blood pressure.