Downloaded 504 times


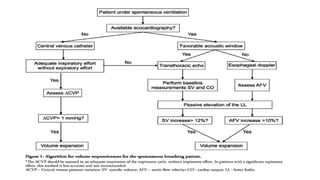
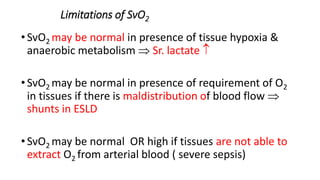
![Assessment of volume responsiveness
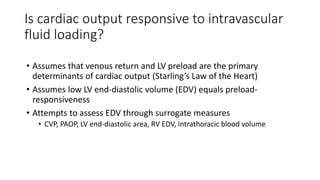
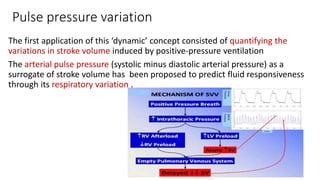
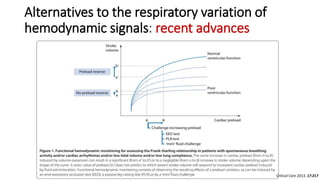
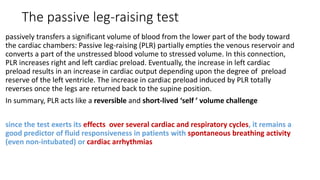
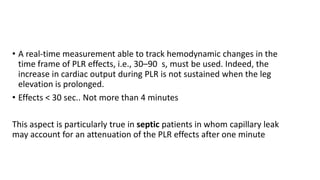
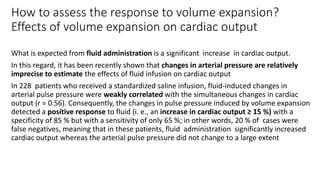
Fluid responsiveness should be detected before deciding to administer volume expansion,
especially in patients in whom fluid overload should be particularly avoided, i. e., patients
with septic shock and/or ARDS.
For this purpose, ‘static markers ’ of cardiac preload have been used for many years.
Nevertheless, a very large number of studies clearly demonstrate that neither pressure nor
volume markers of preload can predict fluid responsiveness
• -CVP and PAOP poor predictors of fluid status
• Cardiac filling pressures did not predict fluid responders from non-responders. [Osman, et
al. CCM 2007 ]](https://image.slidesharecdn.com/dynamichdmbydrsuri-150124145935-conversion-gate01/85/fluid-optimization-concept-based-on-dynamic-parameters-of-hemodynamic-monitoring-16-320.jpg)
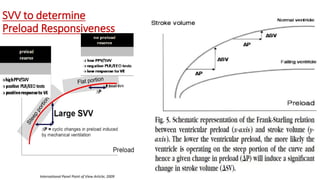
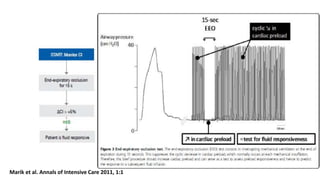
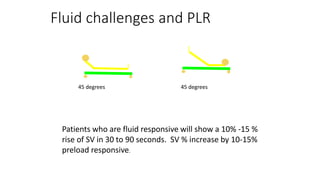
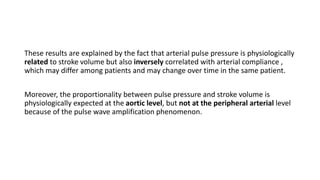
![Limitations of the respiratory variation in stroke
volume for predicting fluid responsiveness
1. Spontaneous Breathing Activity
2. Cardiac Arrhythmias
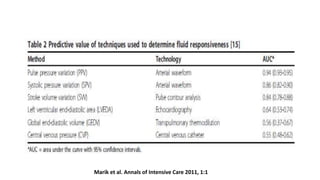
3. High Frequency Ventilation
4. Presence Of Increased Abdominal Pressure
5. Open-chest Surgery
6. Low Tidal Volume
7. Low Compliance Of The Respiratory System[ < 30 ml/cm H2O] ...........recent clinical
study](https://image.slidesharecdn.com/dynamichdmbydrsuri-150124145935-conversion-gate01/85/fluid-optimization-concept-based-on-dynamic-parameters-of-hemodynamic-monitoring-33-320.jpg)
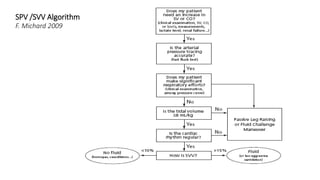
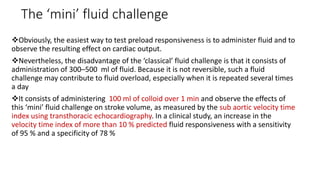
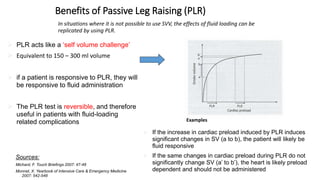
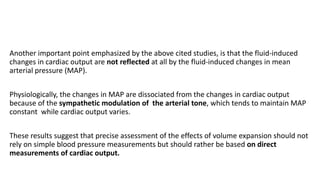
![The end-expiratory occlusion test[EEO]
it was demonstrated that if a 15-sec EEO test increased the arterial
pulse pressure or the pulse contour-derived cardiac output by more
than 5 %, the response of cardiac output to a 500 ml saline infusion
could be predicted with good sensitivity and specificity.
ADVANTAGE
is that it exerts its hemodynamic effects over several cardiac cycles and
thus remains valuable in case of cardiac arrhythmias. [main]
can be used in pts with spontaneous breathing activity, unless marked
triggering activity interrupts the test.](https://image.slidesharecdn.com/dynamichdmbydrsuri-150124145935-conversion-gate01/85/fluid-optimization-concept-based-on-dynamic-parameters-of-hemodynamic-monitoring-38-320.jpg)

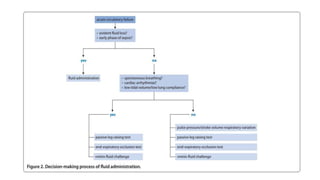


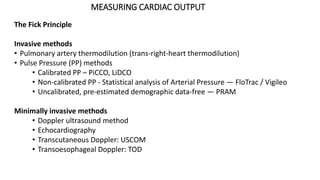


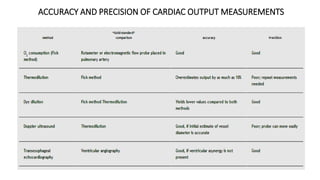


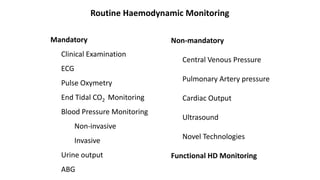
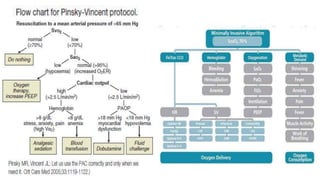
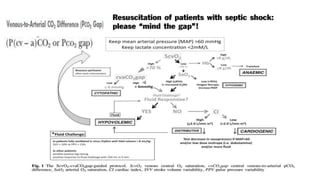
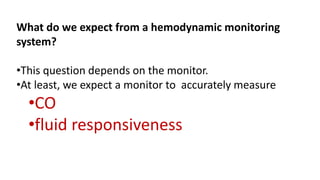
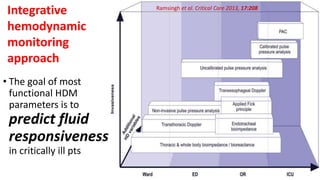
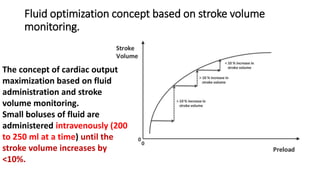
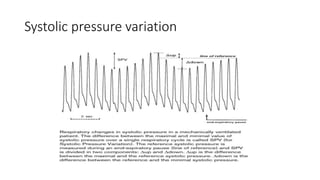
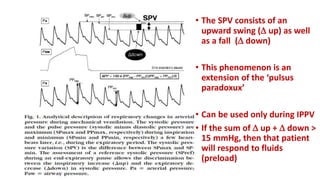
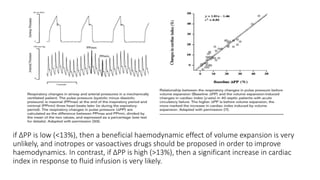
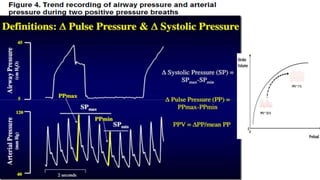
The document discusses fluid optimization concepts and dynamic parameters in hemodynamic monitoring, emphasizing the importance of accurate measurements for cardiac output and fluid responsiveness in critically ill patients. It explores various hemodynamic monitoring techniques and notes limitations of traditional methods that fail to predict fluid response accurately. The document also highlights alternative strategies, such as the passive leg-raising test and mini fluid challenges, for assessing volume responsiveness without inducing fluid overload.


