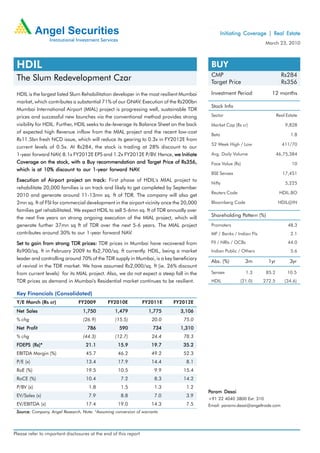
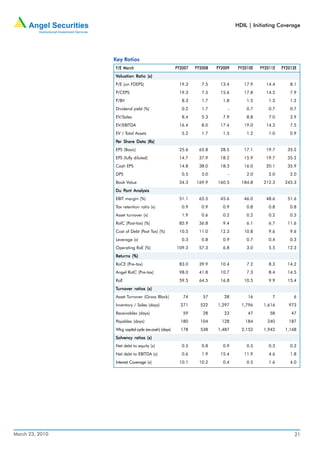
Initiating Coverage | Real Estate
                                                                                                                     March 23, 2010


 HDIL                                                                                     BUY
                                                                                          CMP                                 Rs284
 The Slum Redevelopment Czar                                                              Target Price                        Rs356

 HDIL is the largest listed Slum Rehabilitation developer in the most resilient Mumbai    Investment Period            12 months
 market, which contributes a substantial 71% of our GNAV. Execution of the Rs200bn
                                                                                          Stock Info
 Mumbai International Airport (MIAL) project is progressing well, sustainable TDR
 prices and successful new launches via the conventional method provides strong           Sector                            Real Estate

 visibility for HDIL. Further, HDIL seeks to de-leverage its Balance Sheet on the back    Market Cap (Rs cr)                    9,828
 of expected high Revenue inflow from the MIAL project and the recent low-cost
                                                                                          Beta                                     1.8
 Rs11.5bn fresh NCD issue, which will reduce its gearing to 0.3x in FY2012E from
                                                                                          52 Week High / Low                  411/70
 current levels of 0.5x. At Rs284, the stock is trading at 28% discount to our
 1-year forward NAV, 8.1x FY2012E EPS and 1.2x FY2012E P/BV. Hence, we Initiate           Avg. Daily Volume                 46,75,384
 Coverage on the stock, with a Buy recommendation and Target Price of Rs356,
                                                                Target Price              Face Value (Rs)                           10
 which is at 10% discount to our 1-year forward NAV.   NAV
                                                                                          BSE Sensex                           17,451
 Execution of Airport project on track: First phase of HDIL's MIAL project to
                                                                                          Nifty                                 5,225
 rehabilitate 20,000 families is on track and likely to get completed by September
                                                                                          Reuters Code                       HDIL.BO
 2010 and generate around 11-13mn sq. ft of TDR. The company will also get
 2mn sq. ft of FSI for commercial development in the airport vicinity once the 20,000     Bloomberg Code                    HDIL@IN
 families get rehabilitated. We expect HDIL to sell 5-6mn sq. ft of TDR annually over
 the next five years on strong ongoing execution of the MIAL project, which will          Shareholding Pattern (%)
 generate further 37mn sq ft of TDR over the next 5-6 years. The MIAL project             Promoters                               48.3
 contributes around 30% to our 1-year forward NAV.                                        MF / Banks / Indian FIs                  2.1

 Set to gain from strong TDR prices: TDR prices in Mumbai have recovered from             FII / NRIs / OCBs                       44.0
 Rs900/sq. ft in February 2009 to Rs2,700/sq. ft currently. HDIL, being a market          Indian Public / Others                   5.6
 leader and controlling around 70% of the TDR supply in Mumbai, is a key beneficiary
                                                                                          Abs. (%)          3m        1yr          3yr
 of revival in the TDR market. We have assumed Rs2,000/sq. ft (ie. 26% discount
 from current levels) for its MIAL project. Also, we do not expect a steep fall in the    Sensex              1.3    85.2        10.5
 TDR prices as demand in Mumbai's Residential market continues to be resilient.           HDIL           (21.0)     272.5       (34.6)

 Key Financials (Consolidated)
 Y/E March (Rs cr)              FY2009         FY2010E            FY2011E   FY2012E
 Net Sales                        1,750           1,479             1,775     3,106
 % chg                            (26.9)          (15.5)             20.0      75.0
     Profit
 Net Profit                         786             590              734      1,310
 % chg                            (44.3)          (12.7)             24.4      78.3
 FDEPS (Rs)*                        21.1            15.9             19.7      35.2
 EBITDA Margin (%)                  45.7            46.2             49.2      52.3
 P/E (x)                            13.4            17.9             14.4        8.1
 RoE (%)                            19.5            10.5              9.9      15.4
 RoCE (%)                           10.4             7.2              8.3      14.2
 P/BV (x)                            1.8             1.5              1.3        1.2
                                                                                         Param Desai
 EV/Sales (x)                        7.9             8.8              7.0        3.9
                                                                                         +91 22 4040 3800 Ext: 310
 EV/EBITDA (x)                      17.4            19.0             14.3        7.5     Email: paramv.desai@angeltrade.com
 Source: Company, Angel Research, Note: *Assuming conversion of warrants


Please refer to important disclosures at the end of this report
HDIL | Initiating Coverage


                 HDIL is trading at 28% discount to our 1-year Forward NAV
                 Valuation
                 MIAL project valued at Rs178/share

                 Phase I of the MIAL project is on track and is expected to get completed by September
                 2010. Phase II is expected to start from 1QFY2011E for which the land acquisition
                 process is complete. For the project, we have assumed TDR prices of Rs2,000/sq. ft
                 ie. at 26% discount from current the TDR prices. Further, we have assumed FSI
                 from the airport site to start generating Revenues from FY2015E onwards, wherein we
                 have assumed 5% escalation in prices from current levels. As per our sensitivity
                 analysis to TDR prices, a decline or rise by 5% will impact our MIAL NAV by 4%.
                 Consequently,
                 Consequently, we have valued HDIL's MIAL project at Rs6,607cr,            Rs6,607cr,
                 translating into Rs178/share.

                 Residential Segment valued at Rs160/share

                 HDIL has launched Residential projects of 3.3mn sq. ft since March 2009 and
                 successfully sold more than 90% of apartments in three of the four projects launched.
                 These projects have met with success on account of being launched at 10-20%
                 discount to the prevailing market prices. Further, since the company follows the project
                 completion method for its Revenue recognition, substantial portion of the Revenue
                 will flow in FY2012E as the company achieves threshold for the ongoing projects. We
                 have factored in 5% price escalation from FY2011E onwards in construction and
                 capital value for all its projects. Consequently, we have valued HDIL's Residential
                                                     Consequently,
                 projects at Rs5,938cr, translating into Rs160/share.
                               Rs5,938cr,

                 Commercial Segment valued at Rs113/share

                 HDIL recently launched 3mn sq. ft of commercial projects at Andheri and Kurla where
                 it has already pre-leased 10-15% of office space. We have factored in 5% correction
                 in rentals and capital values in FY2011E, but 5% increase from FY2012E onwards.
                                                                          Rs4199cr,
                 Thus, we have valued HDIL's Commercial projects at Rs4199cr, translating into
                 Rs113/share.

                 Non-MIAL SRS projects valued at Rs109/share

                 HDIL recently won the slum rehabilitation project at Vile Parle near the Milan Subway,
                 Link Road in Mumbai. This project entails rehabilitation of 2,000 families and the
                 company would get FSI of 1.2. The prevailing rates are at Rs13-15,000/ sq. ft. The
                 company expects to launch the project in 2QFY2011E. It also plans to shortly launch
                 Phase I of the Siddharth SRS project in Goregaon of around 1mn sq. ft. We have
                 factored in 5% price escalation from FY2011E onwards in construction and capital
                 value for all its projects. Consequently, we have valued HDIL's Non-MIAL Slum
                                             Consequently,
                 Rehabiliation Scheme (SRS) projects at Rs4,049cr, translating into Rs109/share.
                                                           Rs4,049cr,

                 Retail Segment has been valued at Rs35/share

                 Retail Segment comprises of 9% of HDIL's total saleable area. We have factored in 5%
                 correction in rentals and capital values in FY2011E, but 5% increase FY2012E
                 onwards. Consequently, we have valued HDIL's Retail project at Rs1,298cr,
                            Consequently,                                                 Rs1,298cr,
                 translating into Rs35/share.


March 23, 2010                                                                                         2
HDIL | Initiating Coverage


                 Assumptions

                     We have assigned 15% Cost of Equity and 10% Capitalisation rate.

                     We have assumed Tax rate of 20% from FY2011E onwards owing to increase in MAT.

                     We have assumed conversion of Warrants issued to promoters at Rs240/share.

                 Exhibit 1: Valuation Summary
                       Forward NAV
                  1-yr Forward NAV                                                                 (Rs/share)
                  MIAL (Airport FSI & TDR)                                                               178
                  Residential                                                                            160
                  Commercial                                                                             113
                  Other SRS Projects                                                                     109
                  Retail                                                                                  35
                        NAV
                  Gross NAV                                                                              594
                  Less
                  Net Debt                                                                               (86)
                  Unpaid land cost & Customer advances                                                   (31)
                  Tax                                                                                    (87)
                  NAV/share
                  NAV/share                                                                              395
                  Target Price at 10% discount to NAV
                         Price                    NAV                                                    356
                 Source: Angel Research

                 Exhibit 2: Location-wise Break-down of GNAV
                                                                  0.4
                                                      4.4   3.4


                                               20.8
                                                                                    Mumbai contributes
                                                                                    71% of GNAV

                                                                        71.0


                                Mumbai       MMR excluding Mumbai       Kochi   Hyderabad   Pune

                 Source: Angel Research


March 23, 2010                                                                                                  3
HDIL | Initiating Coverage


Exhibit 3: HDIL Sales & Realisation Assumptions
 Particulars                   FY11E   FY12E                        FY13E       FY14E    FY15E          FY16E         FY17E      FY18E         FY19E
 Saleable area (mn sq ft)
 Residential                     1.1      1.8                          2.4         3.2      3.3            3.6           4.1           4.6         4.9
 Commercial                      0.2      0.3                          0.6         1.1      1.3            1.3           1.4           1.9         1.9
 Retail                          0.1      0.2                          0.3         0.6      1.3            1.5           1.2           1.1         1.0
         Project
 Airport Project
     TDR                         5.7      5.7                          6.1         6.1      6.3            6.5
     FSI                                                                                    1.1            0.8           1.1           1.7         2.0
 FSI from other SRS projects     0.4      0.4                          0.9         0.6      0.4            0.4           0.4           0.2
 Leasable area (mn sq ft)
 Commercial                                                            0.5         3.0      3.7            3.7           3.7           5.2         5.4
 Retail                         0.02     0.02                         0.02        0.02     0.02           0.02          0.02          0.02        0.02
 Realisation (Rs /sq ft)
 Residential                   6,690    6,141                        5,648       5,706    5,201          4,589         4,677         4,458      4,163
 Commercial                    2,073    2,176                        2,923       3,173    3,486          3,968         4,166         4,375      4,594
 Retail                        7,164    7,082                        6,546       4,695    4,354          4,370         4,233         3,645      3,989
 Airport Project
         Project
     TDR                       2,000    2,000                        2,000       2,000    2,000          2,000
     FSI                                                                                 12,763         13,401       14,071      14,775        15,513
 FSI from other SRS projects   7,107   12,281                       16,878   17,798
 Lease rentals (Rs/sq ft/m)
 Commercial                                                           105          97      101            106            112          114         120
 Retail                          57       60                           63          66       69             73             76           80           84
Source: Angel Research
                                          Exhibit 4: Pricing Assumptions
                                           Project                                        Location                  Segment           Price (Rs/ sq ft)
                                           Metropolis                                      Andheri                 Residential                  8,200
                                           Kukatpally                                    Hyderabad                 Residential                  3,000
                                           Dongre                                               Virar              Residential                  2,000
                                           Ektanagar                                      Kandivali                Residential                  5,000
                                           Milan Subway                                   Vile Parle                      FSI                 13,000
                                           Bandra (E) SRS Scheme                                 BKC                      FSI                 15,000
                                           Siddarth Nagar                                Goregaon                         Res                   6,000
                                           Kalamsarry                                           Kochi            Commercial                     3,200
                                           Kukatpally                                    Hyderabad                      Retail                  5,500
                                           Bombay Oxygen                                   Mulund                       Retail                  6,000
                                           MIAL TDR                                                                       SRA                   2,000
                                           MIAL FSI                                       Santacruz              Commercial                   10,000
                                         Source: Angel Research

                                         Exhibit 5: Sensitivity analysis to our 1-year forward NAV
                                                                                                                Cost of Equity (%)
                                                                                           13              14             15            16          17
                                                                         1,300            410             383           357            337         314
                                              Prices
                                          TDR Prices
                                                       (Rs/sq ft)


                                                                        1,650             429             402           376            352         330
                                                                        2,000             449             421           395            371         348
                                                                        2,350             468             440           414            389         366
                                                                        2,700             488             459           433            408         384
                                         Source: Angel Research


March 23, 2010                                                                                                                                            4
HDIL | Initiating Coverage


                                         Investment Argument
                                         High-Margin Slum Re-development projects
                                         Slum re-development (SRA) does not involve upfront investment in land compared to
SRA requirement would be of around
                                         the conventional real estate projects. The cost per sq. ft in the slum re-development
644mn sq ft, which translates into
                                         projects is around Rs3,000/sq. ft v/s Rs5,000-6,000/sq. ft (including land cost) on
Revenue potential of Rs2,000bn for the
                                         freehold land due to the high property prices in Mumbai. Slum re-development also
Re-
Re - developers
                                         has high entry barriers, as it requires expertise and experience as it entails dealing
                                         with the government agencies and slum dwellers regularly until project completion.

                                         In Mumbai, more than 54% of the population lives in slums clusters situated in
                                         certain pockets of the city. A slum population of 7.5 million could translate into
                                         1.5mn families with average household size of five. This could translate into SRA
                                         potential of 644mn sq. ft and Revenue potential of Rs2,000bn for the re-developers.

                                         Exhibit 6: SRA - Rs2,000bn Revenue Potential for Redevlopers
                                          Partciluars                                       Fig Remarks
                                          Total slum population in Mumbai (mn) ~7.5
                                          Total hutments (mn)                               1.5 Assuming five person per hutment
                                          Redevlopment Industry size (mn sq ft)            644 (1.5mn*269sq ft*1.2 loading*1.33 FSI)
                                          Investment potential (Rs bn )                    772 Assuming construction cost of Rs1200/ sq
                                                                                                 ft for rehab
                                          Revenue potential (Rs bn )                      2,000 Assuming 50% sold through TDR and FSI
                                         Source: Angel Research

                                         Exhibit 7: Slum population high in Mumbai
                                                60.0    54.1

                                                50.0

                                                40.0
                                                                    32.5
                                          (%)


                                                30.0
                                                                               18.9            18.7        17.2
                                                20.0
                                                                                                                        13.5
                                                                                                                                     10.0
                                                10.0

                                                 0.0
                                                                                                 Delhi
                                                                     Kolkata


                                                                                                                                      Bangalore
                                                                                Chennai


                                                                                                                         Ahmedabad
                                                         Mumbai


                                                                                                            Hyderabad


                                         Source: Census Data 2001

                                         Strong presence in Mumbai Metropolitan Region (MMR)

                                         Mumbai's Real Estate market has been quite resilient being the last one to decline in
                                         the recent meltdown and the first to show signs of recovery on improving sentiment.
                                         Property prices in Mumbai have been rising on the back of reviving financial markets
                                         and overall improvement in the economic environment. We believe that the new
                                         project launches, both high-end and mid-range, would register an increase in prices.
                                         Against this backdrop, HDIL, being the largest listed developer in the attractive Mumbai
                                         market, with expertise and experience in re-development projects, will be a key
                                         beneficiary. Mumbai and the MMR (excluding Mumbai) contribute 39% and 49%
                                         respectively, of HDIL's overall saleable area (194.4mn sq. ft).


March 23, 2010                                                                                                                                    5
HDIL | Initiating Coverage


                                                   Exhibit 8: Land reserves concentrated in MMR (mn sq. ft / % to Saleable area)
                                                                                                   0.8 /0%

                                                                                             15.0 /8%
                                                                                   7.4 /4%


                                                                                                             73.3 /38%


                                                                                        98.0 /50%


                                                                    Mumbai     MMR (excluding Mumbai)        Hyderabad     Kochi    Pune

                                                   Source: Company, Angel Research


HDIL, being the market leader in slum
HDIL,                                              HDIL, the market leader in slum rehabilitation, is well-poised to cash in on the
rehabilitation, stands a good chance               immense opportunity in the SRS Segment. It stands a good chance to win large SRA
to win large SRA projects like Dharavi             projects like Dharavi where rehab families could be of similar size to MIAL. It may be
                                                   noted here that the company has executed around 10mn sq. ft of SRS projects in the
                                                   last 15 years, and is more competitive than other developers in the fray.

                                                   MIAL Project provides strong visibility

The MIAL project is expected to                    HDIL was awarded the MIAL Slum Rehabilitation Project in October 2007 as part of
generate land and construction TDR of              the Mumbai Airport expansion and modernisation plan. Under the MIAL project,
around 44mn sq. ft and further FSI                 HDIL is required to rehabilitate 82,500 families spread over 276 acres of land in the
rights of 10mn sq. ft for commercial               vicinity of the Mumbai airport. The project has been granted FSI of 4 on account of
development at the airport site for HDIL           being in the high density zone. Consequently, HDIL requires around 160 acres of
                                                   land to rehab the 82,500 families over the next 5-6 years, while it currently has
                                                   around 110 acres of land largely in the Eastern suburbs, which would suffice Phase I,
                                                   II requirements. Pertinently, Phase I is nearing completion and Phase II is expected to
                                                   start in 1QFY2011E. On completion, the MIAL project would be one of the largest
                                                   slum rehabilitation to be executed this far in India.

                                                   The MIAL project is expected to generate land and construction TDR of around 44mn
                                                   sq. ft. Post the relocation of slum inhabitants from the encroached 276 acres, MIAL
                                                   will utilise 158 acres for airport modernisation and expansion. HDIL is to have the
                                                   rights to redevelop 55% (65 acres), while the remaining 45% (53 acres) would be
                                                   available to MIAL's partner, GVK. This will generate FSI rights of 10mn sq. ft
                                                   for HDIL.

Exhibit 9: HDIL’s Saleable interest from MIAL project
 Particulars               Saleable           Phase I          Phase II         Phase III           Remarks
 (mn sq. ft)                   Area
 Land TDR                       8.9                2.6              2.7              3.6            ((82,500 (families)*269 sq ft *1.2 (Laoding)) /4)
 Construction TDR              35.4              10.3              10.7             14.4            82,500 (families)*269 sq ft *1.2 (loading)*1.33 (FSI)
 FSI at Airport site*           9.9                                                  9.9            65 acres*2.5 (FSI)*1.4 (Loading)
 Total                         54.2              12.9              13.4             27.9
Source: Company, Angel Research, Note: * We have assumed FSI to be sold once relocation of entire 82,500 families is completed


March 23, 2010                                                                                                                                              6
HDIL | Initiating Coverage


                                          Phase I completion on track

The pace of construction work for         Phase I of the MIAL project is on track and likely to get completed by September 2010
Phase I is impressive. HDIL has already   and generate around 11-13mn sq. ft of TDR. HDIL will also get 2mn sq. ft of FSI for
generated 7mn sq. ft of TDR out of the    commercial development in the airport vicinity once rehabilitation of
total of 11-13mn sq. ft that would        18,000-20,000 families is completed. Phase I, spread over 53 acres (located at Kurla,
accrue from Phase 1                       off LBS Marg), is 1.5km away from BKC and 5-7 minutes from the closest railway
                                          station (Vidyavihar). The property was bought from IL&FS for Rs1,900cr. Out of the 53
                                          acres, 38 acres would be utilised to rehabilitate 18,000 families, while the balance
                                          would go for commercial development. Construction work at the site commenced in
                                          June 2008 and the pace of construction work is impressive. HDIL has already generated
                                          7mn sq. ft of TDR from Phase I. Another 2,000 families will be rehabilitated in Kurla
                                          (E) and Bhandup for which work has been started. HDIL intends to start Phase II by
                                          April 2010 for which land has already been acquired in the Eastern suburbs. This
                                          provides strong Revenue visibility with steady Cash flows from sale of TDR.


Exhibit 10: 28 Buildings with G+11 Structures to rehab 18,000 families by September 2010


Source: Company, Angel Research


Exhibit 11: 3,000 labourers, 100 Engineers working on site       Exhibit 12: 270 sq. ft provided to each rehab family


Source: Company, Angel Research                                Source: Company, Angel Research


March 23, 2010                                                                                                               7
HDIL | Initiating Coverage


                                          Project valued at Rs178/share

                                          The MIAL project cost, including land cost for rehabilitation, will be around Rs6,300cr.
                                          In our opinion, HDIL could generate enough cash to complete the project by selling
                                          TDR and FSI at the site. While current TDR prices are quoting at Rs2,700/sq. ft, we
                                          have assumed Rs2,000/sq. ft for the project, which we expect HDIL will sell by FY2016E.
                                          Further, we expect HDIL to start generating Revenues from sale of FSI at its airport site
                                          from FY2015E onwards. We have assumed around 6mn sq. ft of TDR sale annually
                                          from the MIAL project upto FY2016E. Our sensitivity analysis indicates that a 5%
                                          decline in TDR prices leads to 4% fall in NAV from MIAL. Consequently, we have
                                          valued MIAL project at Rs178/share or 30% of GNAV.

                                          Exhibit 13: GNAV Break-up of MIAL project (GNAV/ % to MIAL GNAV)


                                                                                                                                                            43 /24.2%


                                                                                                                  135 /75.8%


                                                                                                                                 TDR                 FSI

                                          Source: Company, Angel Research

                                          To gain from strong TDR prices

We have assumed Rs2,000/sq. ft as         TDR prices in Mumbai have recovered from the bottom of Rs900/sq. ft in February
against the prevailing Rs2,700/sq. ft     2009 to Rs2,700/sq. ft currently. However, it is still lower by 40% from the peak of
for the MIAL project, which contributes   Rs4,200/sq. ft. Mumbai has been a more resilient market, as prices have risen by
                     GNAV
around 30% to our GNAV                    20-30% compared to the 10-15% increase in prices in the other metros. We expect
                                          demand for the Residential Segment in Mumbai to remain stable owing to employment
                                          stability and increasing disposable income levels. Hence, we believe that the new
                                          launches will continue to gain momentum going ahead and fuel demand for TDR
                                          and positively impact the TDR prices.

                                          Exhibit 14: TDR prices still 40% lower than Peak
                                                         4,500
                                                         4,000
                                                         3,500
                                           (Rs/.sq ft)


                                                         3,000
                                                         2,500
                                                         2,000
                                                         1,500
                                                         1,000
                                                          500
                                                            -
                                                                 Feb-08
                                                                          Mar-08
                                                                                   Apr-08
                                                                                            May-08


                                                                                                               Jul-08
                                                                                                              Aug-08
                                                                                                                        Sep-08
                                                                                                                                 Oct-08


                                                                                                                                                   Dec-08


                                                                                                                                                            Feb-09
                                                                                                                                                                     Mar-09
                                                                                                                                                                              Apr-09
                                                                                                                                                                                       May-09


                                                                                                                                                                                                 Jul-09
                                                                                                                                                                                                          Aug-09
                                                                                                                                                                                                                   Sep-09
                                                                                                                                                                                                                            Oct-09


                                                                                                                                                                                                                                     Dec-09


                                                                                                                                                                                                                                                       Feb-10
                                                                                                                                                                                                                                                                Mar-10
                                                                 Jan-08


                                                                                                     Jun-08


                                                                                                                                          Nov-08


                                                                                                                                                   Jan-09


                                                                                                                                                                                                Jun-09


                                                                                                                                                                                                                                     Nov-09


                                                                                                                                                                                                                                              Jan-10


                                          Source: Company, Angel Research


March 23, 2010                                                                                                                                                                                                                                                       8
HDIL | Initiating Coverage


                                        HDIL controls 70% of TDR supply in Mumbai and is a key player in the revival of the
                                        TDR market. We have assumed Rs2,000/sq. ft as against the prevailing Rs2,700/sq.
                                        ft for its MIAL project. With our and street's TDR assumption 20-25% below the prevailing
                                        price, there exists further room for appreciation in NAV.

                                        New launches have been rewarding
The company's recent new projects       HDIL has strategically de-leveraged its business model by launching various projects
have been successful on account of      through the conventional route since March 2009 thereby reducing its overdependence
being launched at 10-20% discount to    on the TDR market. It has launched 3.3mn sq. ft of Residential and 3.0mn sq. ft of
the prevailing market prices. In        Commercial, and has managed to successfully sell more than 90% of the apartments
FY2011E , HDIL plans to launch new
FY2011E,                                in three out of its four projects. It has even managed to pre-lease 10-15% of its
projects constituting another 6-7mn     commercial launches at Rs100-120/sq. ft at its Andheri and Kurla projects. The
sq.ft                                   company's recent projects have been successful on account of being launched at
                                        10-20% discount to the prevailing market prices. Management has indicated that it
                                        would be adopting the same strategy for its forthcoming launches as well. In FY2011E,
                                        HDIL plans to launch new projects constituting another 6-7mn sq.ft.

                                        Exhibit 15: Launching projects through conventional route
                                         Project             Location     Saleable Area         Sold/ Lease Launching Rate
                                                                                                      Lease
                                                                             (mn sq. ft)                            (Rs/ sq. ft)
                                         Residential
                                         Galaxy              Kurla (E)              0.4              > 90%               4,251
                                         Premier             Kurla (W)              0.9              > 95%               5,251
                                         Metropolis          Andheri (W)            0.7              > 95%               7,651
                                         Kilburn                                    1.3              > 20%               5,751
                                         Commercial
                                         Premier             Kurla (W)              2.0                 15%        Rs 80/ sq ft
                                         Metropolis          Andheri (W)            1.0                 10%       Rs 120/ sq ft
                                         Total                                      6.3
                                        Source: Company, Angel Research


Exhibit 16: Premier Residential project (0.9mn sq ft)        Exhibit 17: Premier Phase I Commercial project (2mn sq. ft)


Source: Company, Angel Research                               Source: Company, Angel Research


March 23, 2010                                                                                                                     9
HDIL | Initiating Coverage


                                        Vasai- Virar belt in limelight - Monetisation of Rental housing
                                        projects; focus on upcoming SEZs

MMRDA has offered FSI of 4 for the
MMRDA                                   The 550 acre MMRDA rental township in Virar is likely to commence construction by
rental housing schemes in Virar         1QFY2011E as final clearances are awaited. MMRDA has offered FSI of 4 for the
comprising FSI of 3 for free sale       rental housing schemes comprising FSI of 3 for free sale area to HDIL and FSI of 1 for
area to HDIL and FSI of 1 for rental    rental housing. The project aims to provide affordable housing for the low-income
housing                                 groups and economically weaker sections, within close proximity to cities, towns and
                                        rural areas. HDIL will provide self-contained units of 160 sq. ft. carpet area with
                                        standard features in MMRDA managed apartment buildings.

                                        Besides the rental housing schemes, the company recently launched its first mass
                                        housing project in Virar of 1.5mn sq. ft as well where more than 35% has been
                                        pre-sold at Rs2,200/sq. ft.

                                        HDIL also plans to develop a multi-product SEZ in Vasai-Virar of 2,500 acres and a
                                        multi-service SEZ in Bhayander of 600 acres. It has already acquired 2,300 acres for
                                        the Vasai-Virar SEZ at an average cost of Rs50/ sq. ft.

                                        De-leveraging Balance Sheet

The successful new launches and         At end of FY2009, HDIL's Gross Debt increased to Rs4,143cr from Rs376cr in FY2007
monetisation of the MIAL project will   resulting in Interest outflow of around Rs595cr, ie. 77% of PBT. However, in 2QFY2010
generate enough cash flows which will   HDIL raised Rs1,688cr through a QIP Issue and Rs156cr by issuing 2.6cr warrants to
reduce Net Debt from current levels     promoters, which will get converted by end FY2011E. The company partially utilised
of 0.5x to 0.3x in FY2012E              these funds to reduce its leverage to Rs3,393cr, translating into gearing of 0.4x in
                                        FY2010. In FY2011E, HDIL requires to repay Rs200cr of debt and will have interest
                                        outflow of around Rs450cr. We believe that the new launches and monetisation of the
                                        MIAL project will generate enough cash flows, which will help further reduce debt.
                                        HDIL has also raised Rs1,150cr from fresh NCD issue, following an improved CARE
                                        A+ rating. This will enable HDIL to repay its short-term debt and reduce overall cost
                                        of borrowing by 50-100bp to 12%. Consequently, we expect Net Debt to decline from
                                        current levels of 0.5x to 0.3x in FY2012E.

                                        Exhibit 18: Steady Cash flow from New launches and MIAL to reduce Debt
                                                   4,500                                                                            1.0
                                                   4,000                              0.9                                           0.9

                                                   3,500                                                                            0.8
                                                                       0.8
                                                                                                                                    0.7
                                                   3,000
                                         (Rs cr)


                                                                                                                                    0.6
                                                   2,500
                                                                                                                                          (x)


                                                              0.5                                                                   0.5
                                                   2,000                                            0.5
                                                                                                                    0.3             0.4
                                                   1,500
                                                                                                                              0.3   0.3
                                                   1,000                                                                            0.2
                                                    500                                                                             0.1
                                                      -                                                                             0.0
                                                           FY07     FY08          FY09      FY10E           FY11E         FY12E

                                                                           Net Debt (LHS)   Net D:E (RHS)

                                        Source: Company, Angel Research


March 23, 2010                                                                                                                            10
HDIL | Initiating Coverage


                 Concerns
                 Fall in TDR prices

                 Around 22% of HDIL's saleable area comes from TDR market ie. from MIAL project.
                 TDR prices have gone up from its low of Rs900 sq. ft in Feb 2009 to Rs2,700/ sq. ft
                 currently. This has boosted HDIL's cash flow and help to deleverage its balance sheet.
                 TDR prices are dependant on regulatory changes and new launches. We are quite
                 positive on continue flow of new launches in Mumbai property market given strong
                 demand, stability in employment outlook and higher disposable income. However
                 there is possibility of increasing FSI in suburbs from 1x to 1.33x which will impact TDR
                 volumes and thereby prices negatively. However, we have assumed Rs2,000/ sq ft
                 (25% lower from current level) for its MIAL project while calculating our 1 yr forward
                 NAV which gives enough margin of safety.

                 Over-dependence on MMR

                 Mumbai property prices have gone up by 20-30% from its low. With MMR accounting
                 for 87% of HDIL's saleable area, any decline in demand or prices could impact our
                 NAV.

                 Delay in execution

                 We have assumed construction of all its residential launches done in FY2010 to be
                 completed by FY2012E. As the company follows project completion method to book
                 revenues we expect substantial jump in Revenues in FY2012E. Any delay in execution
                 will impact our estimates and in turn our NAV.

                 Long gestation SRS projects

                 Around 31% of HDIL's its saleable area comes from long gestation SRS project
                 development, which involves getting consensus from slum dwellers, government
                 approvals, clearing slum encroachments, and rehabilitation. Any delay in above
                 processes could increase project costs and delay in sales from project FSI, creating a
                 cash trap.


March 23, 2010                                                                                        11
HDIL | Initiating Coverage


                                        Financial Outlook
                                        Strong Revenue visibility

We expect HDIL's Revenues to increase   HDIL is expected to report de-growth of 21.4% on compounded basis over
by 20.0% yoy in FY2011E to Rs1,775cr    FY2008-10E on account of lower TDR prices and minimal launches in FY2009.
and 75.0% yoy in FY2012E to             However, since March 2009 the company has launched 3.3mn sq. ft of Residential
Rs3,106cr driven by sale of the TDR     projects and more than 90% of the apartments have been sold out from three out of
generated from the MIAL project and     the four projects. As HDIL recognises Revenues on project completion method instead
ramp up in completion of its            of percentage completion method, most of the Revenues from the new launches will
Residential projects                    flow in FY2012E. Moreover, ongoing execution of the airport project will generate
                                        TDR of 6mn sq. ft annually which also provides strong Revenue visibility. We have
                                        assumed TDR price of Rs2,000/sq. ft for the project ie. at 25% discount to current
                                        prices. Hence, we expect HDIL's Revenues to increase by 20% yoy in FY2011E to
                                        Rs1,775cr and 75.0% yoy in FY2012E to Rs3,106cr driven by sale of the TDR generated
                                        from the MIAL project and ramp up in completion of its Residential projects.
                                        Consequently, we expect Revenues to record CAGR of 44.9% over FY2010-12E.

                                        Exhibit 19: Revenue Trend
                                                   3,500                                                                                 200
                                                               179.2
                                                   3,000
                                                                                                                                         150
                                                   2,500
                                         (Rs cr)


                                                   2,000                    97.2                                                75.0     100


                                                                                                                                                (x)
                                                   1,500                                                                                 50
                                                   1,000                                                                20.0
                                                                                                                                         0
                                                    500                                   (26.9)
                                                                                                             (15.5)
                                                      -                                                                                  (50)
                                                           FY2007      FY2008       FY2009         FY2010E        FY2011E      FY2012E
                                                                                Revenue (LHS)        yoy growth (RHS)
                                        Source: Company, Angel Research

                                        Operating Margins to increase

We expect EBIDTA Margins to increase
          EBIDTA                        The EBIDTA Margins had declined by 1,900bp over FY2008-10E owing to lower TDR
from 46.4% in FY2010E to 52.5% in       prices, which fell from Rs4,200/sq. ft to Rs900/sq. ft during the mentioned period.
FY2012E                                 However, TDR prices are on recovery path since February 2009. Further, the company
                                        launched new projects - 3.3mn sq. ft of Residential and 3mn sq. ft of Commercial - in
                                        FY2010. Consequently, we expect Margins to increase from 46.4% in FY2010E to
                                        52.5% in FY2012E mainly due to completion of the Revenue recognition threshold of
                                        the company's ongoing projects and sustainable TDR prices.


March 23, 2010                                                                                                                                  12
HDIL | Initiating Coverage


                                       Exhibit 20: Improving EBIDTA Margins
                                                  70                        65.5

                                                  60
                                                            51.1                                                                             52.3
                                                                                                                            49.2
                                                  50                                         45.7             46.2

                                                  40


                                          (%)
                                                  30

                                                  20

                                                  10

                                                   0
                                                           FY2007          FY2008          FY2009           FY2010E        FY2011E       FY2012E

                                       Source: Company, Angel Research


                                       Low gearing to boost Earnings

We expect HDIL's PAT to post CAGR of
                 PA          CAGR      The land purchases for MIAL project resulted in high gearing of 94% (Rs4,143cr) in
48.9% over FY2010-12E                  FY2009, with Interest outflow of Rs620cr. However, in FY2010, HDIL raised Rs1,854cr
                                       through a QIP Issue and Warrants to promoters, which helped reduce its leverage to
                                       Rs3,393cr and translating into gearing of 0.4x for the year. The company also raised
                                       Rs1,150cr through a NCD issue, following an improved CARE A+ rating. This will
                                       enable HDIL to repay short-term debt and reduce overall cost of borrowing by
                                       50-100bp to 12%. On the other hand, the company's Tax rate is likely to increase to
                                       20% owing to hike in MAT rate. Thus, we expect HDIL's PAT to post CAGR of 48.9%
                                       over FY2010-12E.

                                       Exhibit 21: Earnings Trend
                                                  1,600                                                                                        400
                                                                   367.2                                                                       350
                                                  1,400
                                                                                                                                               300
                                                  1,200
                                                                                                                                               250
                                        (Rs cr)


                                                  1,000                                                                                        200

                                                                                                                                                      (%)
                                                   800                         156.8                                                           150

                                                   600                                                                                         100
                                                                                                                                       78.3
                                                                                                                                               50
                                                   400                                                                     24.4
                                                                                                                                               0
                                                   200                                                       -24.9
                                                                                               -44.2                                           -50
                                                       -                                                                                       -100
                                                            FY2007         FY2008        FY2009        FY2010E        FY2011E      FY2012E

                                                                                       PAT (LHS)       yoy growth (RHS)
                                       Source: Company, Angel Research


March 23, 2010                                                                                                                                        13
HDIL | Initiating Coverage


                 Industry Outlook
                 The Real Estate Sector in India is currently on a gradual improvement curve. According
                 to Cushman and Wakefield, the demand forecast for pan-India commercial office
                 space is 196mn sq. ft, while Retail space demand stands at 43mn sq. ft for 2009-13.
                 Demand for Hospitality and Residential Segments is estimated at over 690,000 room
                 nights and 7.5mn units respectively, over the mentioned period. We expect demand
                 from Commercial and Retail Segments to pick up in 2HFY2011E owing to renewed
                 interest from the Corporates thereby catching up with the Residential Segment.

                 New projects are also getting launched with the liquidity position of the developers
                 improving on the back of QIPs and proposed public issue offers (IPOs). Over the last
                 six months, listed companies have raised US $3.5bn through QIPs and issuance of
                 Warrants. Further US $2.4bn is expected to be raised from the proposed IPOs hitting
                 the markets towards end 2010. The Sector has also been supported by the government
                 policies that allow housing loans to individuals carrying a risk weightage of 50% to
                 be increased from Rs20lakh to Rs3lakh along with allowing re-scheduling of bank
                 debt without it being classified as NPL.

                 Exhibit 22: QIP Proceeds ease Liquidity crunch
                  Company                                                                  (US $mn)
                  Ackruti City                                                                    65
                  DLF                                                                            830
                  HDIL                                                                           363
                  IBREL                                                                          570
                  Orbit Corp                                                                      30
                  Parsvnath                                                                       36
                  Sobha Developers                                                               115
                  Unitech                                                                        950
                  Total                                                                        2,959
                 Source: Company, Angel Research


                 Exhibit 23: Forthcoming IPOs in 2010
                  Company                                                                  (US $mn)
                  Ambience                                                                       200
                  Emaar MGF                                                                      750
                  Lodha Developers                                                               500
                  Nitesh Estates                                                                 100
                  Oberoi Constructions                                                           150
                  Sahara Prime City                                                              700
                  Total                                                                       2,400
                 Source: Company, Angel Research


March 23, 2010                                                                                      14
HDIL | Initiating Coverage


                                         Mumbai Property
                                         Residential Segment to continue to witness stability in demand

The Mumbai Residential market is         The Mumbai property prices have increased 20-30% from the lows, though still
expected to witness an increase in new   10-15% lower from their highs. Resurgence in demand and positive economic growth
project launches in mid-range            outlook has resulted in appreciation of capital values across most micro markets,
particularly over the next six months    both high-end and mid-range. The Mid-segment projects in the suburbs have witnessed
                                         higher increase in demand than the upscale South Mumbai market owing to increasing
                                         affordability. Thus, the overall Mumbai market is expected to witness increase in new
                                         project launches in the mid-range particularly over the next six months.

                                         Economic stability coupled with rising disposable income levels are expected to
                                         stimulate demand and result in some appreciation in the capital values in certain
                                         pockets in Mumbai in the short to medium term. However, further hike in Interest
                                         rates could dent the demand.
                                         Exhibit 24: Capital values across Mumbai
                                                                                    Price
                                                                         Achievable Price                               Change
                                          Location                          (INR/Month)                                 (% yoy)
                                                                   High End          Mid Segment            High End      Mid Segment
                                          South               42,500-58,000         28,000-37,000                   3                    7
                                          South Central       42,000-66,000         35,000-45,000                (4)                     4
                                          Central             34,000-55,000         15,000-26,000                   6                    0
                                          North               22,000-30,000         16,000-24,000                (4)                 21
                                          Far North           10,000-16,500          8,500-11,500                20                  25
                                          North East          10,000-16,000           6,400-8,500               (15)                 10
                                         Source: Cushman & Wakefield

                                         Commercial Segment - Rentals to stabilise
We expect Office rentals to bottom out   The supply in Mumbai increased marginally from 9.5mn sq. ft in CY2008 to 10.6mn
owing to renewed interest from           sq. ft in CY2009 owing to subdued demand, delays in execution and liquidity crunch
Corporates resulting from the ongoing    faced by the developers. Total absorption in 2009 (5.4mn sq. ft.) was approximately
recovery in the economy                  37% down compared to 2008. Consequently, vacancy rates were recorded in the
                                         range of 11-13% and rentals declined by 20-30% in CY2009. However, going ahead,
                                         we expect rental to bottom out owing to renewed interest from Corporates resulting
                                         from the ongoing recovery in the economy.

                                         Exhibit 25: Supply outpaced absorption in CY2009
                                          (mn sq ft)
                                            10

                                            9

                                            8

                                            7

                                            6

                                            5

                                            4

                                            3

                                            2

                                            1

                                            0
                                                    2003   2004   2005    2006     2007     2008    1Q09     2Q09       3Q09      4Q09

                                                                                 Supply        Absorption

                                         Source: Cushman & Wakefield


March 23, 2010                                                                                                                           15
HDIL | Initiating Coverage


                                           Company Background
HDIL is the largest listed player in the   HDIL is part of the Wadhawan Group, which has been involved in real estate
MMR with 87% land reserves. As of          development in the MMR since the last three decades. Prior to listing in July 2007, the
December 30, 2009, HDIL's total land       Wadhawan Group had developed around 73.2mn sq. ft of Saleable area, which
reserves comprised approximately           included 13.7mn sq. ft of Residential, 15.3mn sq. ft of Commercial, 0.7mn sq. ft of
194.4mn sq. ft. of Saleable area           Retail, 35.6mn sq. ft of land development and 7.9mn sq. ft of Saleable area under
                                           the SRS. The company has constructed approximately 5.5mn sq. ft of rehabilitation
                                           housing units under SRS.

                                           HDIL is the largest listed player in MMR with 87% of its land reserves. As of December
                                           30, 2009, HDIL's total land reserves comprised approximately 194.4mn sq. ft. of
                                           Saleable area.

                                           Exhibit 26: Break-up of Land Reserves (mn sq. ft / % to total saleable area)


                                                                                58.7 /30%


                                                                                                        91.0 /47%


                                                                                17.3 /9%


                                                                                            27.3 /14%


                                                                         Residential        Commercial         Retail      SRS

                                           Source: Company, Angel Research

                                           Major in Slum Rehabilitation

Under SRS, HDIL gains access to prime
      SRS,                                 HDIL is an established developer in slum rehabilitation, which primarily involves
Mumbai land at a reasonable cost           constructing residential buildings for the slum dwellers and clearing public and private
                                           land for development of residential, commercial, retail and infrastructure purposes.
                                           Under SRS, rehabilitation flats are built free of cost for the slum dwellers and in return
                                           the developer is granted by the relevant authority rights to develop certain saleable
                                           area equal to or greater than the surface area of rehabilitation housing built for the
                                           slum dwellers. It may be noted here that by executing projects under SRS, the company
                                           gains access to prime Mumbai land at a reasonable cost. Pertinently, HDIL has bagged
                                           the prestigious MIAL, which involves rehabilitation of 85,000 families.

                                           Exhibit 27: Leader in SRS

                                            SRS              Low cost                            Long
                                                                                                                                   High entry
                                                             of land                             Gestation
                                                                                                                                   barriers
                                                             High cost                           Short                             Low entry
                                            Non-SRS          of land                             Gestation                         barriers


                                           Source: Company, Angel Research


March 23, 2010                                                                                                                                  16
HDIL | Initiating Coverage


                 Annexure I
                 Slum Rehabilitation Scheme

                 The Slum Redevelopment Authority (SRA) is the nodal agency, which identifies slum
                 pockets for redevelopment. SRS projects with low slum density can avail FSI up to
                 3.0x, while high density projects can avail FSI of 4.0x (only for select large projects
                 like the airport SRS and proposed Dharavi redevelopment).

                 Developers can execute SRS schemes only on getting consent from at least 70% of the
                 slum owners. Moreover, only those slum dwellers are eligible to avail of the scheme
                 whose names appear in the voters' list as on 01.01.1995 along with being the actual
                 occupant of the hut. A slum dweller has to also figure in Annexure II, which lists the
                 slum dwellers entitled to benefit from the SRS. Annexure II also mentions the
                 measurement of the land. During the course of the construction work, the developers
                 bear the rent for the transit tenements, while other expenses incurred towards water,
                 electricity and telephone charges is borne by the slum dwellers themselves. During
                 the slum rehabilitation period, the developer can construct and sell free sale area
                 available to him as part of the SRS scheme with a cap of 90%. The balance can be
                 sold only after completion of the project.

                 Exhibit 28: SRA flow chart


                 Source: SRA


March 23, 2010                                                                                       17
HDIL | Initiating Coverage


                 Profit & Loss Statement (Consolidated)                                              Rs crore
                  Y/E March                      FY2007    FY2008     FY2009     FY2010E   FY2011E   FY2012E
                  Gross sales                    1,214      2,395      1,750      1,479     1,775      3,106
                  Less: Excise duty                   -          -          -          -         -          -

                  Net Sales                      1,214      2,395      1,750      1,479     1,775      3,106
                  Other operating income              -          -          -          -         -          -

                  Total operating income         1,214      2,395      1,750      1,479     1,775      3,106
                  % chg                          179.2       97.2      (26.9)     (15.5)     20.0       75.0

                  Total Expenditure               (593)      (825)      (950)      (795)     (901)    (1,481)

                  Cost of cosntruction            (513)      (633)      (299)      (286)     (488)    (1,056)

                  Other operating expenditure      (51)      (136)      (537)      (420)     (299)     (274)

                  Personnel                         (8)       (12)       (22)       (27)      (34)       (45)

                  Administartive exps              (22)       (44)       (92)       (63)      (80)     (105)

                  EBITDA
                  EBITDA                           621      1,570        800        684       873      1,626
                  % chg                          362.8      152.8      (49.0)     (14.5)     27.7       86.1

                  (% of Net Sales)                51.1       65.5       45.7       46.2      49.2       52.3

                  Depreciation& Amortisation        (1)        (1)        (3)        (4)      (11)       (24)

                  EBIT                             620      1,568        798        680       862      1,602
                  % chg                          364.4      152.9      (49.1)     (14.8)     26.8       85.8

                  (% of Net Sales)                51.1       65.5       45.6       46.0      48.6       51.6

                  Interest & other Charges          (5)        (4)       (58)       (71)      (57)       (55)

                  Other Income                      10         38         32        102       113         90

                  (% of PBT)                         2           2         4         14        12          6

                  Recurring PBT                    625      1,602        771        711       918      1,637
                  % chg                                     156.3      (51.8)      (7.8)     29.0       78.3

                  Extraordinary Expense/(Inc.)        -          -          -          -         -          -

                  PBT (reported)                   625      1,602        771        711       918      1,637
                  Tax                              (77)      (192)       (94)      (121)     (184)     (327)

                  (% of PBT)                      12.3       12.0       12.2       17.0      20.0       20.0

                  PAT (reported)                   548      1,410        677        590       734      1,310
                  Add: Share of earnings of associate -          -          -          -         -          -

                  Less: Minority interest (MI)       0         (0)        (1)          -         -          -

                  Prior period items & others         -        (0)       109           -         -          -

                  PAT after MI (reported)          548      1,410        786        590       734      1,310

                  ADJ. PAT
                  ADJ. PA                          548      1,410        677        590       734      1,310
                  % chg                          367.2      157.3      (52.0)     (12.8)     24.4       78.3

                  (% of Net Sales)                45.1       58.9       38.7       39.9      41.4       42.2
                  Basic EPS (Rs)                  25.6       65.8       28.5       17.1      19.7       35.2

                  Fully Diluted EPS (Rs)          14.7       37.9       21.1       15.9      19.7       35.2
                  % chg                          367.2      157.3      (44.2)     (24.9)     24.4       78.3
                 Source: Company, Angel Research; Note: *Assuming conversion of warrants


March 23, 2010                                                                                              18
HDIL | Initiating Coverage


                 Balance Sheet (Consolidated)                                                Rs crore
                 Y/E March                   FY2007   FY2008   FY2009    FY2010E   FY2011E   FY2012E
                 SOURCES OF FUNDS

                 Equity Share Capital          180      214      275        346       372       372

                 Preference Capital               -        -        -          -         -         -

                 Reserves& Surplus             554    3,427    4,146      6,526     7,524      8,748

                              Funds
                 Shareholders Funds            734    3,642    4,422      6,871     7,895     9,120

                 Minority Interest                -       0        0          0         0         0

                 Total Loans                   376    3,113    4,143      3,343     2,743      2,743

                 Deferred Tax Liability          1        2        2          2         2         2

                 Total Liabilities           1,111    6,756    8,568     10,217    10,641    11,866

                 APPLICATION OF FUNDS
                 APPLICATION

                 Gross Block                    27       58       65        115       374       656

                 Less: Acc. Depreciation         2        3        6         10        21        45

                 Net Block                      25       54       60        105       353       612

                 Capital Work-in-Progress        0        5       15         45        45        45

                 Goodwill                        2        9       48         48        48        48

                 Investments                   158      191      249        503       503       503

                 Current Assets              1,782    7,241    8,865     10,452    11,290     12,446

                    Cash                         6      351       75        198       125       343

                    Loans & Advances           141    1,311    1,710      2,394     2,753      3,166

                    Other                    1,636    5,580    7,080      7,860     8,413      8,937

                 Current liabilities           859      748      669        936     1,598      1,788

                 Net Current Assets            923    6,493    8,196      9,515     9,692    10,658

                 Mis. Exp. not written off       2        2       (0)          -         -         -

                 Total Assets                1,111    6,756    8,568     10,217    10,641    11,866


March 23, 2010                                                                                     19
HDIL | Initiating Coverage


                 Cash Flow Statement (Consolidated)                                               Rs crore
                 Y/E March                      FY2007   FY2008    FY2009     FY2010E   FY2011E    FY2012E

                 Profit before tax                625     1,602       771        711       918      1,637

                 Depreciation & others             (2)      (46)       15         75        68         79

                 Change in Working Capital       (754)   (5,345)   (1,823)    (1,276)     (256)      (747)

                 Less: Other income                10        38        32        102       113         90

                 Direct taxes paid                (20)     (164)      (63)      (121)     (184)      (327)

                 Cash Flow from Operations       (161)   (3,991)   (1,132)      (713)      434        551

                 Inc./ (Dec.) in Fixed Assets     (62)      (45)      (62)       (80)     (259)      (283)

                 Inc./ (Dec.) in Investments         -      (23)      (57)      (254)         -          -

                 Other income                      10        38        32        102       113         90

                 Cash Flow from Investing         (51)      (30)      (88)      (232)     (146)      (193)

                 Issue of Equity                   (1)    1,712          -     1,938       374           -

                 Inc./(Dec.) in loans             179     2,737     1,031       (800)     (600)          -

                 Dividend Paid (Incl. Tax)           -      (49)      (75)          -      (79)       (85)

                 Others                            (4)      (35)      (11)       (71)      (57)       (55)

                                Financing
                 Cash Flow from Financing         174     4,365       944      1,067      (361)      (140)

                 Inc./(Dec.) in Cash              (39)      344      (275)       123       (74)       219

                 Opening Cash balances             44         6       351         75       198        125

                 Closing Cash balances              5       350        75        198       125        343


March 23, 2010                                                                                           20
HDIL | Initiating Coverage


                 Key Ratios
                 Y/E March                            FY2007   FY2008   FY2009    FY2010E   FY2011E   FY2012E
                 Valuation Ratio (x)
                 P/E (on FDEPS)                        19.3       7.5    13.4       17.9      14.4        8.1
                 P/CEPS                                19.3       7.5    15.6       17.8      14.2        7.9
                 P/BV                                    8.3      1.7      1.8        1.5       1.3       1.2
                 Dividend yield (%)                      0.2      1.7        -        0.7       0.7       0.7
                 EV/Sales                                8.4      5.3      7.9        8.8       7.0       3.9
                 EV/EBITDA                             16.4       8.0    17.4       19.0      14.3        7.5
                 EV / Total Assets                       5.2      1.7      1.5        1.2       1.0       0.9
                 Per Share Data (Rs)
                 EPS (Basic)                           25.6     65.8     28.5       17.1      19.7      35.2
                 EPS (fully diluted)                   14.7     37.9     18.2       15.9      19.7      35.2
                 Cash EPS                              14.8     38.0     18.3       16.0      20.1      35.9
                 DPS                                     0.5      5.0        -        2.0       2.0       2.0
                 Book Value                            34.3    169.9    160.5      184.8     212.3     245.3
                 Du Pont Analysis
                    Pont
                 EBIT margin (%)                       51.1     65.5     45.6       46.0      48.6      51.6
                 Tax retention ratio (x)                 0.9      0.9      0.9        0.8      0.8       0.8
                 Asset turnover (x)                      1.9      0.6      0.2        0.2       0.2       0.3
                 RoIC (Post-tax) (%)                   85.9     36.8       9.4        6.1       6.7     11.6
                 Cost of Debt (Post Tax) (%)           10.5     11.0     12.3       10.8        9.6       9.6
                 Leverage (x)                            0.3      0.8      0.9        0.7       0.4       0.3
                 Operating RoE (%)                    109.3     57.3       6.8        3.0       5.5     12.3
                 Returns (%)
                 RoCE (Pre-tax)                        83.0     39.9     10.4         7.2       8.3     14.2
                 Angel RoIC (Pre-tax)                  98.0     41.8     10.7         7.3       8.4     14.5
                 RoE                                   59.5     64.5     16.8       10.5        9.9     15.4
                 Turnover ratios (x)
                 Asset Turnover (Gross Block)            74       57       28         16         7         6
                 Inventory / Sales (days)               271      522    1,297      1,796     1,616       973
                 Receivables (days)                      59       28       23         47        58        47
                 Payables (days)                        180      104      128        184       240       187
                 Wkg capital cycle (ex-cash) (days)     178      538    1,487      2,152     1,942     1,168
                 Solvency ratios (x)
                 Net debt to equity (x)                  0.5      0.8      0.9        0.5       0.3       0.3
                 Net debt to EBITDA (x)                  0.6      1.9    15.4       11.9        4.6       1.8
                 Interest Coverage (x)                 10.1     10.2       0.4        0.5       1.6       4.0


March 23, 2010                                                                                              21
HDIL


DISCLAIMER
This document is not for public distribution and has been furnished to you solely for your information and must not be reproduced or
redistributed to any other person. Persons into whose possession this document may come are required to observe these restrictions.

Opinion expressed is our current opinion as of the date appearing on this material only. While we endeavor to update on a reasonable basis
the information discussed in this material, there may be regulatory, compliance, or other reasons that prevent us from doing so. Prospective
investors and others are cautioned that any forward-looking statements are not predictions and may be subject to change without notice.
Our proprietary trading and investment businesses may make investment decisions that are inconsistent with the recommendations expressed
herein.

The information in this document has been printed on the basis of publicly available information, internal data and other reliable sources
believed to be true and are for general guidance only. While every effort is made to ensure the accuracy and completeness of information
contained, the company takes no guarantee and assumes no liability for any errors or omissions of the information. No one can use the
information as the basis for any claim, demand or cause of action.

Recipients of this material should rely on their own investigations and take their own professional advice. Each recipient of this document
should make such investigations as it deems necessary to arrive at an independent evaluation of an investment in the securities of companies
referred to in this document (including the merits and risks involved), and should consult their own advisors to determine the merits and risks
of such an investment. Price and value of the investments referred to in this material may go up or down. Past performance is not a guide
for future performance. Certain transactions - futures, options and other derivatives as well as non-investment grade securities - involve
substantial risks and are not suitable for all investors. Reports based on technical analysis centers on studying charts of a stock's price
movement and trading volume, as opposed to focusing on a company's fundamentals and as such, may not match with a report on a
company's fundamentals.

We do not undertake to advise you as to any change of our views expressed in this document. While we would endeavor to update the
information herein on a reasonable basis, Angel Securities, its subsidiaries and associated companies, their directors and employees are
under no obligation to update or keep the information current. Also there may be regulatory, compliance, or other reasons that may
prevent Angel Securities and affiliates from doing so. Prospective investors and others are cautioned that any forward-looking statements
are not predictions and may be subject to change without notice. Angel Securities Limited and affiliates, including the analyst who has
issued this report, may, on the date of this report, and from time to time, have long or short positions in, and buy or sell the securities of the
companies mentioned herein or engage in any other transaction involving such securities and earn brokerage or compensation or act as
advisor or have other potential conflict of interest with respect to company/ies mentioned herein or inconsistent with any recommendation
and related information and opinions.

Angel Securities Limited and affiliates may seek to provide or have engaged in providing corporate finance, investment banking or other
advisory services in a merger or specific transaction to the companies referred to in this report, as on the date of this report or in the past.

Note: Please refer important `Stock Holding Disclosure' report on Angel web-site (Research Section).


   Disclosure of Interest Statement                                            HDIL
   1. Analyst ownership of the stock                                            No
   2. Angel and its Group companies ownership of the stock                      No
   3. Angel and its Group companies' Directors ownership of the stock           No
   4. Broking relationship with company covered                                 No

   Note: We have not considered any Exposure below Rs 5 lakh for Angel, its Group companies and Directors.


  Ratings (Returns) :             Buy (> 15%)                               Accumulate (5% to 15%)                       Neutral (-5 to 5%)
                                  Reduce (-5% to -15%)                      Sell (< -15%)
HDIL


                            Address: Acme Plaza, ‘A’ Wing, 3rd Floor, M.V. Road, Opp. Sangam Cinema, Andheri (E), Mumbai - 400 059.
                                                                      Tel : (022) 3941 3940 / 4000 3600

Research Team
Fundamental:
Sarabjit Kour Nangra                                                                               VP-Research, Pharmaceutical                                                            sarabjit@angeltrade.com
Vaibhav Agrawal                                                                                    VP-Research, Banking                                                                   vaibhav.agrawal@angeltrade.com
Vaishali Jajoo                                                                                     Automobile                                                                             vaishali.jajoo@angeltrade.com
Shailesh Kanani                                                                                    Infrastructure, Real Estate                                                            shailesh.kanani@angeltrade.com
Anand Shah                                                                                         FMCG , Media                                                                           anand.shah@angeltrade.com
Deepak Pareek                                                                                      Oil & Gas                                                                              deepak.pareek@angeltrade.com
Puneet Bambha                                                                                      Capital Goods, Engineering                                                             puneet.bambha@angeltrade.com
Sushant Dalmia                                                                                     Pharmaceutical                                                                         sushant.dalmia@angeltrade.com
Rupesh Sankhe                                                                                      Cement, Power                                                                          rupeshd.sankhe@angeltrade.com
Param Desai                                                                                        Real Estate, Logistics, Shipping                                                       paramv.desai@angeltrade.com
Sageraj Bariya                                                                                     Fertiliser, Mid-cap                                                                    sageraj.bariya@angeltrade.com
Viraj Nadkarni                                                                                     Retail, Hotels, Mid-cap                                                                virajm.nadkarni@angeltrade.com
Paresh Jain                                                                                        Metals & Mining                                                                        pareshn.jain@angeltrade.com
Amit Rane                                                                                          Banking                                                                                amitn.rane@angeltrade.com
Rahul Jain                                                                                         IT                                                                                     rahul.j@angeltrade.com
Jai Sharda                                                                                         Mid-cap                                                                                jai.sharda@angeltrade.com
Sharan Lillaney                                                                                    Mid-cap                                                                                sharanb.lillaney@angeltrade.com

Amit Vora                                                                                          Research        Associate (Oil & Gas)                                                  amit.vora@angeltrade.com
V Srinivasan                                                                                       Research        Associate (Cement, Power)                                              v.srinivasan@angeltrade.com
Aniruddha Mate                                                                                     Research        Associate (Infra, Real Estate)                                         aniruddha.mate@angeltrade.com
Shreya Gaunekar                                                                                    Research        Associate (Automobile)                                                 shreyap.gaunekar@angeltrade.com
Mihir Salot                                                                                        Research        Associate (Logistics, Shipping)                                        mihirr.salot@angeltrade.com
Chitrangda Kapur                                                                                   Research        Associate (FMCG, Media)                                                chitrangdar.kapur@angeltrade.com
Vibha Salvi                                                                                        Research        Associate (IT, Telecom)                                                vibhas.salvi@angeltrade.com
Pooja Jain                                                                                         Research        Associate (Metals & Mining)                                            pooja.j@angeltrade.com

Technicals:
Shardul Kulkarni                                                                                   Sr. Technical Analyst                                                                  shardul.kulkarni@angeltrade.com
Mileen Vasudeo                                                                                     Technical Analyst                                                                      vasudeo.kamalakant@angeltrade.com

Derivatives:
Siddarth Bhamre                                                                                    Head - Derivatives                                                                     siddarth.bhamre@angeltrade.com
Jaya Agarwal                                                                                       Jr. Derivative Analyst                                                                 jaya.agarwal@angeltrade.com


Institutional Sales Team:
Mayuresh Joshi                                                                                     VP - Institutional Sales                                                               mayuresh.joshi@angeltrade.com
Abhimanyu Sofat                                                                                    AVP - Institutional Sales                                                              abhimanyu.sofat@angeltrade.com
Nitesh Jalan                                                                                       Sr. Manager                                                                            niteshk.jalan@angeltrade.com
Pranav Modi                                                                                        Sr. Manager                                                                            pranavs.modi@angeltrade.com
Sandeep Jangir                                                                                     Sr. Manager                                                                            sandeepp.jangir@angeltrade.com
Ganesh Iyer                                                                                        Sr. Manager                                                                            ganeshb.Iyer@angeltrade.com
Jay Harsora                                                                                        Sr. Dealer                                                                             jayr.harsora@angeltrade.com
Meenakshi Chavan                                                                                   Dealer                                                                                 meenakshis.chavan@angeltrade.com
Gaurang Tisani                                                                                     Dealer                                                                                 gaurangp.tisani@angeltrade.com


Production Team:
Bharathi Shetty                                                                                    Research Editor                                                                        bharathi.shetty@angeltrade.com
Dharmil Adhyaru                                                                                    Assistant Research Editor                                                              dharmil.adhyaru@angeltrade.com
Bharat Patil                                                                                       Production                                                                             bharat.patil@angeltrade.com
Dilip Patel                                                                                        Production                                                                             dilipm.patel@angeltrade.com


Angel Broking Ltd: BSE Sebi Regn No : INB 010996539 / CDSL Regn No: IN - DP - CDSL - 234 - 2004 / PMS Regn Code: PM/INP000001546 Angel Securities Ltd:BSE: INB010994639/INF010994639 NSE: INB230994635/INF230994635 Membership numbers: BSE 028/NSE:09946
Angel Capital & Debt Market Ltd: INB 231279838 / NSE FNO: INF 231279838 / NSE Member code -12798 Angel Commodities Broking (P) Ltd: MCX Member ID: 12685 / FMC Regn No: MCX / TCM / CORP / 0037 NCDEX : Member ID 00220 / FMC Regn No: NCDEX / TCM / CORP / 0302

HDIL - The Slum Redevelopment Czar

  • 1.
    Initiating Coverage |Real Estate March 23, 2010 HDIL BUY CMP Rs284 The Slum Redevelopment Czar Target Price Rs356 HDIL is the largest listed Slum Rehabilitation developer in the most resilient Mumbai Investment Period 12 months market, which contributes a substantial 71% of our GNAV. Execution of the Rs200bn Stock Info Mumbai International Airport (MIAL) project is progressing well, sustainable TDR prices and successful new launches via the conventional method provides strong Sector Real Estate visibility for HDIL. Further, HDIL seeks to de-leverage its Balance Sheet on the back Market Cap (Rs cr) 9,828 of expected high Revenue inflow from the MIAL project and the recent low-cost Beta 1.8 Rs11.5bn fresh NCD issue, which will reduce its gearing to 0.3x in FY2012E from 52 Week High / Low 411/70 current levels of 0.5x. At Rs284, the stock is trading at 28% discount to our 1-year forward NAV, 8.1x FY2012E EPS and 1.2x FY2012E P/BV. Hence, we Initiate Avg. Daily Volume 46,75,384 Coverage on the stock, with a Buy recommendation and Target Price of Rs356, Target Price Face Value (Rs) 10 which is at 10% discount to our 1-year forward NAV. NAV BSE Sensex 17,451 Execution of Airport project on track: First phase of HDIL's MIAL project to Nifty 5,225 rehabilitate 20,000 families is on track and likely to get completed by September Reuters Code HDIL.BO 2010 and generate around 11-13mn sq. ft of TDR. The company will also get 2mn sq. ft of FSI for commercial development in the airport vicinity once the 20,000 Bloomberg Code HDIL@IN families get rehabilitated. We expect HDIL to sell 5-6mn sq. ft of TDR annually over the next five years on strong ongoing execution of the MIAL project, which will Shareholding Pattern (%) generate further 37mn sq ft of TDR over the next 5-6 years. The MIAL project Promoters 48.3 contributes around 30% to our 1-year forward NAV. MF / Banks / Indian FIs 2.1 Set to gain from strong TDR prices: TDR prices in Mumbai have recovered from FII / NRIs / OCBs 44.0 Rs900/sq. ft in February 2009 to Rs2,700/sq. ft currently. HDIL, being a market Indian Public / Others 5.6 leader and controlling around 70% of the TDR supply in Mumbai, is a key beneficiary Abs. (%) 3m 1yr 3yr of revival in the TDR market. We have assumed Rs2,000/sq. ft (ie. 26% discount from current levels) for its MIAL project. Also, we do not expect a steep fall in the Sensex 1.3 85.2 10.5 TDR prices as demand in Mumbai's Residential market continues to be resilient. HDIL (21.0) 272.5 (34.6) Key Financials (Consolidated) Y/E March (Rs cr) FY2009 FY2010E FY2011E FY2012E Net Sales 1,750 1,479 1,775 3,106 % chg (26.9) (15.5) 20.0 75.0 Profit Net Profit 786 590 734 1,310 % chg (44.3) (12.7) 24.4 78.3 FDEPS (Rs)* 21.1 15.9 19.7 35.2 EBITDA Margin (%) 45.7 46.2 49.2 52.3 P/E (x) 13.4 17.9 14.4 8.1 RoE (%) 19.5 10.5 9.9 15.4 RoCE (%) 10.4 7.2 8.3 14.2 P/BV (x) 1.8 1.5 1.3 1.2 Param Desai EV/Sales (x) 7.9 8.8 7.0 3.9 +91 22 4040 3800 Ext: 310 EV/EBITDA (x) 17.4 19.0 14.3 7.5 Email: paramv.desai@angeltrade.com Source: Company, Angel Research, Note: *Assuming conversion of warrants Please refer to important disclosures at the end of this report
  • 2.
    HDIL | InitiatingCoverage HDIL is trading at 28% discount to our 1-year Forward NAV Valuation MIAL project valued at Rs178/share Phase I of the MIAL project is on track and is expected to get completed by September 2010. Phase II is expected to start from 1QFY2011E for which the land acquisition process is complete. For the project, we have assumed TDR prices of Rs2,000/sq. ft ie. at 26% discount from current the TDR prices. Further, we have assumed FSI from the airport site to start generating Revenues from FY2015E onwards, wherein we have assumed 5% escalation in prices from current levels. As per our sensitivity analysis to TDR prices, a decline or rise by 5% will impact our MIAL NAV by 4%. Consequently, Consequently, we have valued HDIL's MIAL project at Rs6,607cr, Rs6,607cr, translating into Rs178/share. Residential Segment valued at Rs160/share HDIL has launched Residential projects of 3.3mn sq. ft since March 2009 and successfully sold more than 90% of apartments in three of the four projects launched. These projects have met with success on account of being launched at 10-20% discount to the prevailing market prices. Further, since the company follows the project completion method for its Revenue recognition, substantial portion of the Revenue will flow in FY2012E as the company achieves threshold for the ongoing projects. We have factored in 5% price escalation from FY2011E onwards in construction and capital value for all its projects. Consequently, we have valued HDIL's Residential Consequently, projects at Rs5,938cr, translating into Rs160/share. Rs5,938cr, Commercial Segment valued at Rs113/share HDIL recently launched 3mn sq. ft of commercial projects at Andheri and Kurla where it has already pre-leased 10-15% of office space. We have factored in 5% correction in rentals and capital values in FY2011E, but 5% increase from FY2012E onwards. Rs4199cr, Thus, we have valued HDIL's Commercial projects at Rs4199cr, translating into Rs113/share. Non-MIAL SRS projects valued at Rs109/share HDIL recently won the slum rehabilitation project at Vile Parle near the Milan Subway, Link Road in Mumbai. This project entails rehabilitation of 2,000 families and the company would get FSI of 1.2. The prevailing rates are at Rs13-15,000/ sq. ft. The company expects to launch the project in 2QFY2011E. It also plans to shortly launch Phase I of the Siddharth SRS project in Goregaon of around 1mn sq. ft. We have factored in 5% price escalation from FY2011E onwards in construction and capital value for all its projects. Consequently, we have valued HDIL's Non-MIAL Slum Consequently, Rehabiliation Scheme (SRS) projects at Rs4,049cr, translating into Rs109/share. Rs4,049cr, Retail Segment has been valued at Rs35/share Retail Segment comprises of 9% of HDIL's total saleable area. We have factored in 5% correction in rentals and capital values in FY2011E, but 5% increase FY2012E onwards. Consequently, we have valued HDIL's Retail project at Rs1,298cr, Consequently, Rs1,298cr, translating into Rs35/share. March 23, 2010 2
  • 3.
    HDIL | InitiatingCoverage Assumptions We have assigned 15% Cost of Equity and 10% Capitalisation rate. We have assumed Tax rate of 20% from FY2011E onwards owing to increase in MAT. We have assumed conversion of Warrants issued to promoters at Rs240/share. Exhibit 1: Valuation Summary Forward NAV 1-yr Forward NAV (Rs/share) MIAL (Airport FSI & TDR) 178 Residential 160 Commercial 113 Other SRS Projects 109 Retail 35 NAV Gross NAV 594 Less Net Debt (86) Unpaid land cost & Customer advances (31) Tax (87) NAV/share NAV/share 395 Target Price at 10% discount to NAV Price NAV 356 Source: Angel Research Exhibit 2: Location-wise Break-down of GNAV 0.4 4.4 3.4 20.8 Mumbai contributes 71% of GNAV 71.0 Mumbai MMR excluding Mumbai Kochi Hyderabad Pune Source: Angel Research March 23, 2010 3
  • 4.
    HDIL | InitiatingCoverage Exhibit 3: HDIL Sales & Realisation Assumptions Particulars FY11E FY12E FY13E FY14E FY15E FY16E FY17E FY18E FY19E Saleable area (mn sq ft) Residential 1.1 1.8 2.4 3.2 3.3 3.6 4.1 4.6 4.9 Commercial 0.2 0.3 0.6 1.1 1.3 1.3 1.4 1.9 1.9 Retail 0.1 0.2 0.3 0.6 1.3 1.5 1.2 1.1 1.0 Project Airport Project TDR 5.7 5.7 6.1 6.1 6.3 6.5 FSI 1.1 0.8 1.1 1.7 2.0 FSI from other SRS projects 0.4 0.4 0.9 0.6 0.4 0.4 0.4 0.2 Leasable area (mn sq ft) Commercial 0.5 3.0 3.7 3.7 3.7 5.2 5.4 Retail 0.02 0.02 0.02 0.02 0.02 0.02 0.02 0.02 0.02 Realisation (Rs /sq ft) Residential 6,690 6,141 5,648 5,706 5,201 4,589 4,677 4,458 4,163 Commercial 2,073 2,176 2,923 3,173 3,486 3,968 4,166 4,375 4,594 Retail 7,164 7,082 6,546 4,695 4,354 4,370 4,233 3,645 3,989 Airport Project Project TDR 2,000 2,000 2,000 2,000 2,000 2,000 FSI 12,763 13,401 14,071 14,775 15,513 FSI from other SRS projects 7,107 12,281 16,878 17,798 Lease rentals (Rs/sq ft/m) Commercial 105 97 101 106 112 114 120 Retail 57 60 63 66 69 73 76 80 84 Source: Angel Research Exhibit 4: Pricing Assumptions Project Location Segment Price (Rs/ sq ft) Metropolis Andheri Residential 8,200 Kukatpally Hyderabad Residential 3,000 Dongre Virar Residential 2,000 Ektanagar Kandivali Residential 5,000 Milan Subway Vile Parle FSI 13,000 Bandra (E) SRS Scheme BKC FSI 15,000 Siddarth Nagar Goregaon Res 6,000 Kalamsarry Kochi Commercial 3,200 Kukatpally Hyderabad Retail 5,500 Bombay Oxygen Mulund Retail 6,000 MIAL TDR SRA 2,000 MIAL FSI Santacruz Commercial 10,000 Source: Angel Research Exhibit 5: Sensitivity analysis to our 1-year forward NAV Cost of Equity (%) 13 14 15 16 17 1,300 410 383 357 337 314 Prices TDR Prices (Rs/sq ft) 1,650 429 402 376 352 330 2,000 449 421 395 371 348 2,350 468 440 414 389 366 2,700 488 459 433 408 384 Source: Angel Research March 23, 2010 4
  • 5.
    HDIL | InitiatingCoverage Investment Argument High-Margin Slum Re-development projects Slum re-development (SRA) does not involve upfront investment in land compared to SRA requirement would be of around the conventional real estate projects. The cost per sq. ft in the slum re-development 644mn sq ft, which translates into projects is around Rs3,000/sq. ft v/s Rs5,000-6,000/sq. ft (including land cost) on Revenue potential of Rs2,000bn for the freehold land due to the high property prices in Mumbai. Slum re-development also Re- Re - developers has high entry barriers, as it requires expertise and experience as it entails dealing with the government agencies and slum dwellers regularly until project completion. In Mumbai, more than 54% of the population lives in slums clusters situated in certain pockets of the city. A slum population of 7.5 million could translate into 1.5mn families with average household size of five. This could translate into SRA potential of 644mn sq. ft and Revenue potential of Rs2,000bn for the re-developers. Exhibit 6: SRA - Rs2,000bn Revenue Potential for Redevlopers Partciluars Fig Remarks Total slum population in Mumbai (mn) ~7.5 Total hutments (mn) 1.5 Assuming five person per hutment Redevlopment Industry size (mn sq ft) 644 (1.5mn*269sq ft*1.2 loading*1.33 FSI) Investment potential (Rs bn ) 772 Assuming construction cost of Rs1200/ sq ft for rehab Revenue potential (Rs bn ) 2,000 Assuming 50% sold through TDR and FSI Source: Angel Research Exhibit 7: Slum population high in Mumbai 60.0 54.1 50.0 40.0 32.5 (%) 30.0 18.9 18.7 17.2 20.0 13.5 10.0 10.0 0.0 Delhi Kolkata Bangalore Chennai Ahmedabad Mumbai Hyderabad Source: Census Data 2001 Strong presence in Mumbai Metropolitan Region (MMR) Mumbai's Real Estate market has been quite resilient being the last one to decline in the recent meltdown and the first to show signs of recovery on improving sentiment. Property prices in Mumbai have been rising on the back of reviving financial markets and overall improvement in the economic environment. We believe that the new project launches, both high-end and mid-range, would register an increase in prices. Against this backdrop, HDIL, being the largest listed developer in the attractive Mumbai market, with expertise and experience in re-development projects, will be a key beneficiary. Mumbai and the MMR (excluding Mumbai) contribute 39% and 49% respectively, of HDIL's overall saleable area (194.4mn sq. ft). March 23, 2010 5
  • 6.
    HDIL | InitiatingCoverage Exhibit 8: Land reserves concentrated in MMR (mn sq. ft / % to Saleable area) 0.8 /0% 15.0 /8% 7.4 /4% 73.3 /38% 98.0 /50% Mumbai MMR (excluding Mumbai) Hyderabad Kochi Pune Source: Company, Angel Research HDIL, being the market leader in slum HDIL, HDIL, the market leader in slum rehabilitation, is well-poised to cash in on the rehabilitation, stands a good chance immense opportunity in the SRS Segment. It stands a good chance to win large SRA to win large SRA projects like Dharavi projects like Dharavi where rehab families could be of similar size to MIAL. It may be noted here that the company has executed around 10mn sq. ft of SRS projects in the last 15 years, and is more competitive than other developers in the fray. MIAL Project provides strong visibility The MIAL project is expected to HDIL was awarded the MIAL Slum Rehabilitation Project in October 2007 as part of generate land and construction TDR of the Mumbai Airport expansion and modernisation plan. Under the MIAL project, around 44mn sq. ft and further FSI HDIL is required to rehabilitate 82,500 families spread over 276 acres of land in the rights of 10mn sq. ft for commercial vicinity of the Mumbai airport. The project has been granted FSI of 4 on account of development at the airport site for HDIL being in the high density zone. Consequently, HDIL requires around 160 acres of land to rehab the 82,500 families over the next 5-6 years, while it currently has around 110 acres of land largely in the Eastern suburbs, which would suffice Phase I, II requirements. Pertinently, Phase I is nearing completion and Phase II is expected to start in 1QFY2011E. On completion, the MIAL project would be one of the largest slum rehabilitation to be executed this far in India. The MIAL project is expected to generate land and construction TDR of around 44mn sq. ft. Post the relocation of slum inhabitants from the encroached 276 acres, MIAL will utilise 158 acres for airport modernisation and expansion. HDIL is to have the rights to redevelop 55% (65 acres), while the remaining 45% (53 acres) would be available to MIAL's partner, GVK. This will generate FSI rights of 10mn sq. ft for HDIL. Exhibit 9: HDIL’s Saleable interest from MIAL project Particulars Saleable Phase I Phase II Phase III Remarks (mn sq. ft) Area Land TDR 8.9 2.6 2.7 3.6 ((82,500 (families)*269 sq ft *1.2 (Laoding)) /4) Construction TDR 35.4 10.3 10.7 14.4 82,500 (families)*269 sq ft *1.2 (loading)*1.33 (FSI) FSI at Airport site* 9.9 9.9 65 acres*2.5 (FSI)*1.4 (Loading) Total 54.2 12.9 13.4 27.9 Source: Company, Angel Research, Note: * We have assumed FSI to be sold once relocation of entire 82,500 families is completed March 23, 2010 6
  • 7.
    HDIL | InitiatingCoverage Phase I completion on track The pace of construction work for Phase I of the MIAL project is on track and likely to get completed by September 2010 Phase I is impressive. HDIL has already and generate around 11-13mn sq. ft of TDR. HDIL will also get 2mn sq. ft of FSI for generated 7mn sq. ft of TDR out of the commercial development in the airport vicinity once rehabilitation of total of 11-13mn sq. ft that would 18,000-20,000 families is completed. Phase I, spread over 53 acres (located at Kurla, accrue from Phase 1 off LBS Marg), is 1.5km away from BKC and 5-7 minutes from the closest railway station (Vidyavihar). The property was bought from IL&FS for Rs1,900cr. Out of the 53 acres, 38 acres would be utilised to rehabilitate 18,000 families, while the balance would go for commercial development. Construction work at the site commenced in June 2008 and the pace of construction work is impressive. HDIL has already generated 7mn sq. ft of TDR from Phase I. Another 2,000 families will be rehabilitated in Kurla (E) and Bhandup for which work has been started. HDIL intends to start Phase II by April 2010 for which land has already been acquired in the Eastern suburbs. This provides strong Revenue visibility with steady Cash flows from sale of TDR. Exhibit 10: 28 Buildings with G+11 Structures to rehab 18,000 families by September 2010 Source: Company, Angel Research Exhibit 11: 3,000 labourers, 100 Engineers working on site Exhibit 12: 270 sq. ft provided to each rehab family Source: Company, Angel Research Source: Company, Angel Research March 23, 2010 7
  • 8.
    HDIL | InitiatingCoverage Project valued at Rs178/share The MIAL project cost, including land cost for rehabilitation, will be around Rs6,300cr. In our opinion, HDIL could generate enough cash to complete the project by selling TDR and FSI at the site. While current TDR prices are quoting at Rs2,700/sq. ft, we have assumed Rs2,000/sq. ft for the project, which we expect HDIL will sell by FY2016E. Further, we expect HDIL to start generating Revenues from sale of FSI at its airport site from FY2015E onwards. We have assumed around 6mn sq. ft of TDR sale annually from the MIAL project upto FY2016E. Our sensitivity analysis indicates that a 5% decline in TDR prices leads to 4% fall in NAV from MIAL. Consequently, we have valued MIAL project at Rs178/share or 30% of GNAV. Exhibit 13: GNAV Break-up of MIAL project (GNAV/ % to MIAL GNAV) 43 /24.2% 135 /75.8% TDR FSI Source: Company, Angel Research To gain from strong TDR prices We have assumed Rs2,000/sq. ft as TDR prices in Mumbai have recovered from the bottom of Rs900/sq. ft in February against the prevailing Rs2,700/sq. ft 2009 to Rs2,700/sq. ft currently. However, it is still lower by 40% from the peak of for the MIAL project, which contributes Rs4,200/sq. ft. Mumbai has been a more resilient market, as prices have risen by GNAV around 30% to our GNAV 20-30% compared to the 10-15% increase in prices in the other metros. We expect demand for the Residential Segment in Mumbai to remain stable owing to employment stability and increasing disposable income levels. Hence, we believe that the new launches will continue to gain momentum going ahead and fuel demand for TDR and positively impact the TDR prices. Exhibit 14: TDR prices still 40% lower than Peak 4,500 4,000 3,500 (Rs/.sq ft) 3,000 2,500 2,000 1,500 1,000 500 - Feb-08 Mar-08 Apr-08 May-08 Jul-08 Aug-08 Sep-08 Oct-08 Dec-08 Feb-09 Mar-09 Apr-09 May-09 Jul-09 Aug-09 Sep-09 Oct-09 Dec-09 Feb-10 Mar-10 Jan-08 Jun-08 Nov-08 Jan-09 Jun-09 Nov-09 Jan-10 Source: Company, Angel Research March 23, 2010 8
  • 9.
    HDIL | InitiatingCoverage HDIL controls 70% of TDR supply in Mumbai and is a key player in the revival of the TDR market. We have assumed Rs2,000/sq. ft as against the prevailing Rs2,700/sq. ft for its MIAL project. With our and street's TDR assumption 20-25% below the prevailing price, there exists further room for appreciation in NAV. New launches have been rewarding The company's recent new projects HDIL has strategically de-leveraged its business model by launching various projects have been successful on account of through the conventional route since March 2009 thereby reducing its overdependence being launched at 10-20% discount to on the TDR market. It has launched 3.3mn sq. ft of Residential and 3.0mn sq. ft of the prevailing market prices. In Commercial, and has managed to successfully sell more than 90% of the apartments FY2011E , HDIL plans to launch new FY2011E, in three out of its four projects. It has even managed to pre-lease 10-15% of its projects constituting another 6-7mn commercial launches at Rs100-120/sq. ft at its Andheri and Kurla projects. The sq.ft company's recent projects have been successful on account of being launched at 10-20% discount to the prevailing market prices. Management has indicated that it would be adopting the same strategy for its forthcoming launches as well. In FY2011E, HDIL plans to launch new projects constituting another 6-7mn sq.ft. Exhibit 15: Launching projects through conventional route Project Location Saleable Area Sold/ Lease Launching Rate Lease (mn sq. ft) (Rs/ sq. ft) Residential Galaxy Kurla (E) 0.4 > 90% 4,251 Premier Kurla (W) 0.9 > 95% 5,251 Metropolis Andheri (W) 0.7 > 95% 7,651 Kilburn 1.3 > 20% 5,751 Commercial Premier Kurla (W) 2.0 15% Rs 80/ sq ft Metropolis Andheri (W) 1.0 10% Rs 120/ sq ft Total 6.3 Source: Company, Angel Research Exhibit 16: Premier Residential project (0.9mn sq ft) Exhibit 17: Premier Phase I Commercial project (2mn sq. ft) Source: Company, Angel Research Source: Company, Angel Research March 23, 2010 9
  • 10.
    HDIL | InitiatingCoverage Vasai- Virar belt in limelight - Monetisation of Rental housing projects; focus on upcoming SEZs MMRDA has offered FSI of 4 for the MMRDA The 550 acre MMRDA rental township in Virar is likely to commence construction by rental housing schemes in Virar 1QFY2011E as final clearances are awaited. MMRDA has offered FSI of 4 for the comprising FSI of 3 for free sale rental housing schemes comprising FSI of 3 for free sale area to HDIL and FSI of 1 for area to HDIL and FSI of 1 for rental rental housing. The project aims to provide affordable housing for the low-income housing groups and economically weaker sections, within close proximity to cities, towns and rural areas. HDIL will provide self-contained units of 160 sq. ft. carpet area with standard features in MMRDA managed apartment buildings. Besides the rental housing schemes, the company recently launched its first mass housing project in Virar of 1.5mn sq. ft as well where more than 35% has been pre-sold at Rs2,200/sq. ft. HDIL also plans to develop a multi-product SEZ in Vasai-Virar of 2,500 acres and a multi-service SEZ in Bhayander of 600 acres. It has already acquired 2,300 acres for the Vasai-Virar SEZ at an average cost of Rs50/ sq. ft. De-leveraging Balance Sheet The successful new launches and At end of FY2009, HDIL's Gross Debt increased to Rs4,143cr from Rs376cr in FY2007 monetisation of the MIAL project will resulting in Interest outflow of around Rs595cr, ie. 77% of PBT. However, in 2QFY2010 generate enough cash flows which will HDIL raised Rs1,688cr through a QIP Issue and Rs156cr by issuing 2.6cr warrants to reduce Net Debt from current levels promoters, which will get converted by end FY2011E. The company partially utilised of 0.5x to 0.3x in FY2012E these funds to reduce its leverage to Rs3,393cr, translating into gearing of 0.4x in FY2010. In FY2011E, HDIL requires to repay Rs200cr of debt and will have interest outflow of around Rs450cr. We believe that the new launches and monetisation of the MIAL project will generate enough cash flows, which will help further reduce debt. HDIL has also raised Rs1,150cr from fresh NCD issue, following an improved CARE A+ rating. This will enable HDIL to repay its short-term debt and reduce overall cost of borrowing by 50-100bp to 12%. Consequently, we expect Net Debt to decline from current levels of 0.5x to 0.3x in FY2012E. Exhibit 18: Steady Cash flow from New launches and MIAL to reduce Debt 4,500 1.0 4,000 0.9 0.9 3,500 0.8 0.8 0.7 3,000 (Rs cr) 0.6 2,500 (x) 0.5 0.5 2,000 0.5 0.3 0.4 1,500 0.3 0.3 1,000 0.2 500 0.1 - 0.0 FY07 FY08 FY09 FY10E FY11E FY12E Net Debt (LHS) Net D:E (RHS) Source: Company, Angel Research March 23, 2010 10
  • 11.
    HDIL | InitiatingCoverage Concerns Fall in TDR prices Around 22% of HDIL's saleable area comes from TDR market ie. from MIAL project. TDR prices have gone up from its low of Rs900 sq. ft in Feb 2009 to Rs2,700/ sq. ft currently. This has boosted HDIL's cash flow and help to deleverage its balance sheet. TDR prices are dependant on regulatory changes and new launches. We are quite positive on continue flow of new launches in Mumbai property market given strong demand, stability in employment outlook and higher disposable income. However there is possibility of increasing FSI in suburbs from 1x to 1.33x which will impact TDR volumes and thereby prices negatively. However, we have assumed Rs2,000/ sq ft (25% lower from current level) for its MIAL project while calculating our 1 yr forward NAV which gives enough margin of safety. Over-dependence on MMR Mumbai property prices have gone up by 20-30% from its low. With MMR accounting for 87% of HDIL's saleable area, any decline in demand or prices could impact our NAV. Delay in execution We have assumed construction of all its residential launches done in FY2010 to be completed by FY2012E. As the company follows project completion method to book revenues we expect substantial jump in Revenues in FY2012E. Any delay in execution will impact our estimates and in turn our NAV. Long gestation SRS projects Around 31% of HDIL's its saleable area comes from long gestation SRS project development, which involves getting consensus from slum dwellers, government approvals, clearing slum encroachments, and rehabilitation. Any delay in above processes could increase project costs and delay in sales from project FSI, creating a cash trap. March 23, 2010 11
  • 12.
    HDIL | InitiatingCoverage Financial Outlook Strong Revenue visibility We expect HDIL's Revenues to increase HDIL is expected to report de-growth of 21.4% on compounded basis over by 20.0% yoy in FY2011E to Rs1,775cr FY2008-10E on account of lower TDR prices and minimal launches in FY2009. and 75.0% yoy in FY2012E to However, since March 2009 the company has launched 3.3mn sq. ft of Residential Rs3,106cr driven by sale of the TDR projects and more than 90% of the apartments have been sold out from three out of generated from the MIAL project and the four projects. As HDIL recognises Revenues on project completion method instead ramp up in completion of its of percentage completion method, most of the Revenues from the new launches will Residential projects flow in FY2012E. Moreover, ongoing execution of the airport project will generate TDR of 6mn sq. ft annually which also provides strong Revenue visibility. We have assumed TDR price of Rs2,000/sq. ft for the project ie. at 25% discount to current prices. Hence, we expect HDIL's Revenues to increase by 20% yoy in FY2011E to Rs1,775cr and 75.0% yoy in FY2012E to Rs3,106cr driven by sale of the TDR generated from the MIAL project and ramp up in completion of its Residential projects. Consequently, we expect Revenues to record CAGR of 44.9% over FY2010-12E. Exhibit 19: Revenue Trend 3,500 200 179.2 3,000 150 2,500 (Rs cr) 2,000 97.2 75.0 100 (x) 1,500 50 1,000 20.0 0 500 (26.9) (15.5) - (50) FY2007 FY2008 FY2009 FY2010E FY2011E FY2012E Revenue (LHS) yoy growth (RHS) Source: Company, Angel Research Operating Margins to increase We expect EBIDTA Margins to increase EBIDTA The EBIDTA Margins had declined by 1,900bp over FY2008-10E owing to lower TDR from 46.4% in FY2010E to 52.5% in prices, which fell from Rs4,200/sq. ft to Rs900/sq. ft during the mentioned period. FY2012E However, TDR prices are on recovery path since February 2009. Further, the company launched new projects - 3.3mn sq. ft of Residential and 3mn sq. ft of Commercial - in FY2010. Consequently, we expect Margins to increase from 46.4% in FY2010E to 52.5% in FY2012E mainly due to completion of the Revenue recognition threshold of the company's ongoing projects and sustainable TDR prices. March 23, 2010 12
  • 13.
    HDIL | InitiatingCoverage Exhibit 20: Improving EBIDTA Margins 70 65.5 60 51.1 52.3 49.2 50 45.7 46.2 40 (%) 30 20 10 0 FY2007 FY2008 FY2009 FY2010E FY2011E FY2012E Source: Company, Angel Research Low gearing to boost Earnings We expect HDIL's PAT to post CAGR of PA CAGR The land purchases for MIAL project resulted in high gearing of 94% (Rs4,143cr) in 48.9% over FY2010-12E FY2009, with Interest outflow of Rs620cr. However, in FY2010, HDIL raised Rs1,854cr through a QIP Issue and Warrants to promoters, which helped reduce its leverage to Rs3,393cr and translating into gearing of 0.4x for the year. The company also raised Rs1,150cr through a NCD issue, following an improved CARE A+ rating. This will enable HDIL to repay short-term debt and reduce overall cost of borrowing by 50-100bp to 12%. On the other hand, the company's Tax rate is likely to increase to 20% owing to hike in MAT rate. Thus, we expect HDIL's PAT to post CAGR of 48.9% over FY2010-12E. Exhibit 21: Earnings Trend 1,600 400 367.2 350 1,400 300 1,200 250 (Rs cr) 1,000 200 (%) 800 156.8 150 600 100 78.3 50 400 24.4 0 200 -24.9 -44.2 -50 - -100 FY2007 FY2008 FY2009 FY2010E FY2011E FY2012E PAT (LHS) yoy growth (RHS) Source: Company, Angel Research March 23, 2010 13
  • 14.
    HDIL | InitiatingCoverage Industry Outlook The Real Estate Sector in India is currently on a gradual improvement curve. According to Cushman and Wakefield, the demand forecast for pan-India commercial office space is 196mn sq. ft, while Retail space demand stands at 43mn sq. ft for 2009-13. Demand for Hospitality and Residential Segments is estimated at over 690,000 room nights and 7.5mn units respectively, over the mentioned period. We expect demand from Commercial and Retail Segments to pick up in 2HFY2011E owing to renewed interest from the Corporates thereby catching up with the Residential Segment. New projects are also getting launched with the liquidity position of the developers improving on the back of QIPs and proposed public issue offers (IPOs). Over the last six months, listed companies have raised US $3.5bn through QIPs and issuance of Warrants. Further US $2.4bn is expected to be raised from the proposed IPOs hitting the markets towards end 2010. The Sector has also been supported by the government policies that allow housing loans to individuals carrying a risk weightage of 50% to be increased from Rs20lakh to Rs3lakh along with allowing re-scheduling of bank debt without it being classified as NPL. Exhibit 22: QIP Proceeds ease Liquidity crunch Company (US $mn) Ackruti City 65 DLF 830 HDIL 363 IBREL 570 Orbit Corp 30 Parsvnath 36 Sobha Developers 115 Unitech 950 Total 2,959 Source: Company, Angel Research Exhibit 23: Forthcoming IPOs in 2010 Company (US $mn) Ambience 200 Emaar MGF 750 Lodha Developers 500 Nitesh Estates 100 Oberoi Constructions 150 Sahara Prime City 700 Total 2,400 Source: Company, Angel Research March 23, 2010 14
  • 15.
    HDIL | InitiatingCoverage Mumbai Property Residential Segment to continue to witness stability in demand The Mumbai Residential market is The Mumbai property prices have increased 20-30% from the lows, though still expected to witness an increase in new 10-15% lower from their highs. Resurgence in demand and positive economic growth project launches in mid-range outlook has resulted in appreciation of capital values across most micro markets, particularly over the next six months both high-end and mid-range. The Mid-segment projects in the suburbs have witnessed higher increase in demand than the upscale South Mumbai market owing to increasing affordability. Thus, the overall Mumbai market is expected to witness increase in new project launches in the mid-range particularly over the next six months. Economic stability coupled with rising disposable income levels are expected to stimulate demand and result in some appreciation in the capital values in certain pockets in Mumbai in the short to medium term. However, further hike in Interest rates could dent the demand. Exhibit 24: Capital values across Mumbai Price Achievable Price Change Location (INR/Month) (% yoy) High End Mid Segment High End Mid Segment South 42,500-58,000 28,000-37,000 3 7 South Central 42,000-66,000 35,000-45,000 (4) 4 Central 34,000-55,000 15,000-26,000 6 0 North 22,000-30,000 16,000-24,000 (4) 21 Far North 10,000-16,500 8,500-11,500 20 25 North East 10,000-16,000 6,400-8,500 (15) 10 Source: Cushman & Wakefield Commercial Segment - Rentals to stabilise We expect Office rentals to bottom out The supply in Mumbai increased marginally from 9.5mn sq. ft in CY2008 to 10.6mn owing to renewed interest from sq. ft in CY2009 owing to subdued demand, delays in execution and liquidity crunch Corporates resulting from the ongoing faced by the developers. Total absorption in 2009 (5.4mn sq. ft.) was approximately recovery in the economy 37% down compared to 2008. Consequently, vacancy rates were recorded in the range of 11-13% and rentals declined by 20-30% in CY2009. However, going ahead, we expect rental to bottom out owing to renewed interest from Corporates resulting from the ongoing recovery in the economy. Exhibit 25: Supply outpaced absorption in CY2009 (mn sq ft) 10 9 8 7 6 5 4 3 2 1 0 2003 2004 2005 2006 2007 2008 1Q09 2Q09 3Q09 4Q09 Supply Absorption Source: Cushman & Wakefield March 23, 2010 15
  • 16.
    HDIL | InitiatingCoverage Company Background HDIL is the largest listed player in the HDIL is part of the Wadhawan Group, which has been involved in real estate MMR with 87% land reserves. As of development in the MMR since the last three decades. Prior to listing in July 2007, the December 30, 2009, HDIL's total land Wadhawan Group had developed around 73.2mn sq. ft of Saleable area, which reserves comprised approximately included 13.7mn sq. ft of Residential, 15.3mn sq. ft of Commercial, 0.7mn sq. ft of 194.4mn sq. ft. of Saleable area Retail, 35.6mn sq. ft of land development and 7.9mn sq. ft of Saleable area under the SRS. The company has constructed approximately 5.5mn sq. ft of rehabilitation housing units under SRS. HDIL is the largest listed player in MMR with 87% of its land reserves. As of December 30, 2009, HDIL's total land reserves comprised approximately 194.4mn sq. ft. of Saleable area. Exhibit 26: Break-up of Land Reserves (mn sq. ft / % to total saleable area) 58.7 /30% 91.0 /47% 17.3 /9% 27.3 /14% Residential Commercial Retail SRS Source: Company, Angel Research Major in Slum Rehabilitation Under SRS, HDIL gains access to prime SRS, HDIL is an established developer in slum rehabilitation, which primarily involves Mumbai land at a reasonable cost constructing residential buildings for the slum dwellers and clearing public and private land for development of residential, commercial, retail and infrastructure purposes. Under SRS, rehabilitation flats are built free of cost for the slum dwellers and in return the developer is granted by the relevant authority rights to develop certain saleable area equal to or greater than the surface area of rehabilitation housing built for the slum dwellers. It may be noted here that by executing projects under SRS, the company gains access to prime Mumbai land at a reasonable cost. Pertinently, HDIL has bagged the prestigious MIAL, which involves rehabilitation of 85,000 families. Exhibit 27: Leader in SRS SRS Low cost Long High entry of land Gestation barriers High cost Short Low entry Non-SRS of land Gestation barriers Source: Company, Angel Research March 23, 2010 16
  • 17.
    HDIL | InitiatingCoverage Annexure I Slum Rehabilitation Scheme The Slum Redevelopment Authority (SRA) is the nodal agency, which identifies slum pockets for redevelopment. SRS projects with low slum density can avail FSI up to 3.0x, while high density projects can avail FSI of 4.0x (only for select large projects like the airport SRS and proposed Dharavi redevelopment). Developers can execute SRS schemes only on getting consent from at least 70% of the slum owners. Moreover, only those slum dwellers are eligible to avail of the scheme whose names appear in the voters' list as on 01.01.1995 along with being the actual occupant of the hut. A slum dweller has to also figure in Annexure II, which lists the slum dwellers entitled to benefit from the SRS. Annexure II also mentions the measurement of the land. During the course of the construction work, the developers bear the rent for the transit tenements, while other expenses incurred towards water, electricity and telephone charges is borne by the slum dwellers themselves. During the slum rehabilitation period, the developer can construct and sell free sale area available to him as part of the SRS scheme with a cap of 90%. The balance can be sold only after completion of the project. Exhibit 28: SRA flow chart Source: SRA March 23, 2010 17
  • 18.
    HDIL | InitiatingCoverage Profit & Loss Statement (Consolidated) Rs crore Y/E March FY2007 FY2008 FY2009 FY2010E FY2011E FY2012E Gross sales 1,214 2,395 1,750 1,479 1,775 3,106 Less: Excise duty - - - - - - Net Sales 1,214 2,395 1,750 1,479 1,775 3,106 Other operating income - - - - - - Total operating income 1,214 2,395 1,750 1,479 1,775 3,106 % chg 179.2 97.2 (26.9) (15.5) 20.0 75.0 Total Expenditure (593) (825) (950) (795) (901) (1,481) Cost of cosntruction (513) (633) (299) (286) (488) (1,056) Other operating expenditure (51) (136) (537) (420) (299) (274) Personnel (8) (12) (22) (27) (34) (45) Administartive exps (22) (44) (92) (63) (80) (105) EBITDA EBITDA 621 1,570 800 684 873 1,626 % chg 362.8 152.8 (49.0) (14.5) 27.7 86.1 (% of Net Sales) 51.1 65.5 45.7 46.2 49.2 52.3 Depreciation& Amortisation (1) (1) (3) (4) (11) (24) EBIT 620 1,568 798 680 862 1,602 % chg 364.4 152.9 (49.1) (14.8) 26.8 85.8 (% of Net Sales) 51.1 65.5 45.6 46.0 48.6 51.6 Interest & other Charges (5) (4) (58) (71) (57) (55) Other Income 10 38 32 102 113 90 (% of PBT) 2 2 4 14 12 6 Recurring PBT 625 1,602 771 711 918 1,637 % chg 156.3 (51.8) (7.8) 29.0 78.3 Extraordinary Expense/(Inc.) - - - - - - PBT (reported) 625 1,602 771 711 918 1,637 Tax (77) (192) (94) (121) (184) (327) (% of PBT) 12.3 12.0 12.2 17.0 20.0 20.0 PAT (reported) 548 1,410 677 590 734 1,310 Add: Share of earnings of associate - - - - - - Less: Minority interest (MI) 0 (0) (1) - - - Prior period items & others - (0) 109 - - - PAT after MI (reported) 548 1,410 786 590 734 1,310 ADJ. PAT ADJ. PA 548 1,410 677 590 734 1,310 % chg 367.2 157.3 (52.0) (12.8) 24.4 78.3 (% of Net Sales) 45.1 58.9 38.7 39.9 41.4 42.2 Basic EPS (Rs) 25.6 65.8 28.5 17.1 19.7 35.2 Fully Diluted EPS (Rs) 14.7 37.9 21.1 15.9 19.7 35.2 % chg 367.2 157.3 (44.2) (24.9) 24.4 78.3 Source: Company, Angel Research; Note: *Assuming conversion of warrants March 23, 2010 18
  • 19.
    HDIL | InitiatingCoverage Balance Sheet (Consolidated) Rs crore Y/E March FY2007 FY2008 FY2009 FY2010E FY2011E FY2012E SOURCES OF FUNDS Equity Share Capital 180 214 275 346 372 372 Preference Capital - - - - - - Reserves& Surplus 554 3,427 4,146 6,526 7,524 8,748 Funds Shareholders Funds 734 3,642 4,422 6,871 7,895 9,120 Minority Interest - 0 0 0 0 0 Total Loans 376 3,113 4,143 3,343 2,743 2,743 Deferred Tax Liability 1 2 2 2 2 2 Total Liabilities 1,111 6,756 8,568 10,217 10,641 11,866 APPLICATION OF FUNDS APPLICATION Gross Block 27 58 65 115 374 656 Less: Acc. Depreciation 2 3 6 10 21 45 Net Block 25 54 60 105 353 612 Capital Work-in-Progress 0 5 15 45 45 45 Goodwill 2 9 48 48 48 48 Investments 158 191 249 503 503 503 Current Assets 1,782 7,241 8,865 10,452 11,290 12,446 Cash 6 351 75 198 125 343 Loans & Advances 141 1,311 1,710 2,394 2,753 3,166 Other 1,636 5,580 7,080 7,860 8,413 8,937 Current liabilities 859 748 669 936 1,598 1,788 Net Current Assets 923 6,493 8,196 9,515 9,692 10,658 Mis. Exp. not written off 2 2 (0) - - - Total Assets 1,111 6,756 8,568 10,217 10,641 11,866 March 23, 2010 19
  • 20.
    HDIL | InitiatingCoverage Cash Flow Statement (Consolidated) Rs crore Y/E March FY2007 FY2008 FY2009 FY2010E FY2011E FY2012E Profit before tax 625 1,602 771 711 918 1,637 Depreciation & others (2) (46) 15 75 68 79 Change in Working Capital (754) (5,345) (1,823) (1,276) (256) (747) Less: Other income 10 38 32 102 113 90 Direct taxes paid (20) (164) (63) (121) (184) (327) Cash Flow from Operations (161) (3,991) (1,132) (713) 434 551 Inc./ (Dec.) in Fixed Assets (62) (45) (62) (80) (259) (283) Inc./ (Dec.) in Investments - (23) (57) (254) - - Other income 10 38 32 102 113 90 Cash Flow from Investing (51) (30) (88) (232) (146) (193) Issue of Equity (1) 1,712 - 1,938 374 - Inc./(Dec.) in loans 179 2,737 1,031 (800) (600) - Dividend Paid (Incl. Tax) - (49) (75) - (79) (85) Others (4) (35) (11) (71) (57) (55) Financing Cash Flow from Financing 174 4,365 944 1,067 (361) (140) Inc./(Dec.) in Cash (39) 344 (275) 123 (74) 219 Opening Cash balances 44 6 351 75 198 125 Closing Cash balances 5 350 75 198 125 343 March 23, 2010 20
  • 21.
    HDIL | InitiatingCoverage Key Ratios Y/E March FY2007 FY2008 FY2009 FY2010E FY2011E FY2012E Valuation Ratio (x) P/E (on FDEPS) 19.3 7.5 13.4 17.9 14.4 8.1 P/CEPS 19.3 7.5 15.6 17.8 14.2 7.9 P/BV 8.3 1.7 1.8 1.5 1.3 1.2 Dividend yield (%) 0.2 1.7 - 0.7 0.7 0.7 EV/Sales 8.4 5.3 7.9 8.8 7.0 3.9 EV/EBITDA 16.4 8.0 17.4 19.0 14.3 7.5 EV / Total Assets 5.2 1.7 1.5 1.2 1.0 0.9 Per Share Data (Rs) EPS (Basic) 25.6 65.8 28.5 17.1 19.7 35.2 EPS (fully diluted) 14.7 37.9 18.2 15.9 19.7 35.2 Cash EPS 14.8 38.0 18.3 16.0 20.1 35.9 DPS 0.5 5.0 - 2.0 2.0 2.0 Book Value 34.3 169.9 160.5 184.8 212.3 245.3 Du Pont Analysis Pont EBIT margin (%) 51.1 65.5 45.6 46.0 48.6 51.6 Tax retention ratio (x) 0.9 0.9 0.9 0.8 0.8 0.8 Asset turnover (x) 1.9 0.6 0.2 0.2 0.2 0.3 RoIC (Post-tax) (%) 85.9 36.8 9.4 6.1 6.7 11.6 Cost of Debt (Post Tax) (%) 10.5 11.0 12.3 10.8 9.6 9.6 Leverage (x) 0.3 0.8 0.9 0.7 0.4 0.3 Operating RoE (%) 109.3 57.3 6.8 3.0 5.5 12.3 Returns (%) RoCE (Pre-tax) 83.0 39.9 10.4 7.2 8.3 14.2 Angel RoIC (Pre-tax) 98.0 41.8 10.7 7.3 8.4 14.5 RoE 59.5 64.5 16.8 10.5 9.9 15.4 Turnover ratios (x) Asset Turnover (Gross Block) 74 57 28 16 7 6 Inventory / Sales (days) 271 522 1,297 1,796 1,616 973 Receivables (days) 59 28 23 47 58 47 Payables (days) 180 104 128 184 240 187 Wkg capital cycle (ex-cash) (days) 178 538 1,487 2,152 1,942 1,168 Solvency ratios (x) Net debt to equity (x) 0.5 0.8 0.9 0.5 0.3 0.3 Net debt to EBITDA (x) 0.6 1.9 15.4 11.9 4.6 1.8 Interest Coverage (x) 10.1 10.2 0.4 0.5 1.6 4.0 March 23, 2010 21
  • 22.
    HDIL DISCLAIMER This document isnot for public distribution and has been furnished to you solely for your information and must not be reproduced or redistributed to any other person. Persons into whose possession this document may come are required to observe these restrictions. Opinion expressed is our current opinion as of the date appearing on this material only. While we endeavor to update on a reasonable basis the information discussed in this material, there may be regulatory, compliance, or other reasons that prevent us from doing so. Prospective investors and others are cautioned that any forward-looking statements are not predictions and may be subject to change without notice. Our proprietary trading and investment businesses may make investment decisions that are inconsistent with the recommendations expressed herein. The information in this document has been printed on the basis of publicly available information, internal data and other reliable sources believed to be true and are for general guidance only. While every effort is made to ensure the accuracy and completeness of information contained, the company takes no guarantee and assumes no liability for any errors or omissions of the information. No one can use the information as the basis for any claim, demand or cause of action. Recipients of this material should rely on their own investigations and take their own professional advice. Each recipient of this document should make such investigations as it deems necessary to arrive at an independent evaluation of an investment in the securities of companies referred to in this document (including the merits and risks involved), and should consult their own advisors to determine the merits and risks of such an investment. Price and value of the investments referred to in this material may go up or down. Past performance is not a guide for future performance. Certain transactions - futures, options and other derivatives as well as non-investment grade securities - involve substantial risks and are not suitable for all investors. Reports based on technical analysis centers on studying charts of a stock's price movement and trading volume, as opposed to focusing on a company's fundamentals and as such, may not match with a report on a company's fundamentals. We do not undertake to advise you as to any change of our views expressed in this document. While we would endeavor to update the information herein on a reasonable basis, Angel Securities, its subsidiaries and associated companies, their directors and employees are under no obligation to update or keep the information current. Also there may be regulatory, compliance, or other reasons that may prevent Angel Securities and affiliates from doing so. Prospective investors and others are cautioned that any forward-looking statements are not predictions and may be subject to change without notice. Angel Securities Limited and affiliates, including the analyst who has issued this report, may, on the date of this report, and from time to time, have long or short positions in, and buy or sell the securities of the companies mentioned herein or engage in any other transaction involving such securities and earn brokerage or compensation or act as advisor or have other potential conflict of interest with respect to company/ies mentioned herein or inconsistent with any recommendation and related information and opinions. Angel Securities Limited and affiliates may seek to provide or have engaged in providing corporate finance, investment banking or other advisory services in a merger or specific transaction to the companies referred to in this report, as on the date of this report or in the past. Note: Please refer important `Stock Holding Disclosure' report on Angel web-site (Research Section). Disclosure of Interest Statement HDIL 1. Analyst ownership of the stock No 2. Angel and its Group companies ownership of the stock No 3. Angel and its Group companies' Directors ownership of the stock No 4. Broking relationship with company covered No Note: We have not considered any Exposure below Rs 5 lakh for Angel, its Group companies and Directors. Ratings (Returns) : Buy (> 15%) Accumulate (5% to 15%) Neutral (-5 to 5%) Reduce (-5% to -15%) Sell (< -15%)
  • 23.
    HDIL Address: Acme Plaza, ‘A’ Wing, 3rd Floor, M.V. Road, Opp. Sangam Cinema, Andheri (E), Mumbai - 400 059. Tel : (022) 3941 3940 / 4000 3600 Research Team Fundamental: Sarabjit Kour Nangra VP-Research, Pharmaceutical sarabjit@angeltrade.com Vaibhav Agrawal VP-Research, Banking vaibhav.agrawal@angeltrade.com Vaishali Jajoo Automobile vaishali.jajoo@angeltrade.com Shailesh Kanani Infrastructure, Real Estate shailesh.kanani@angeltrade.com Anand Shah FMCG , Media anand.shah@angeltrade.com Deepak Pareek Oil & Gas deepak.pareek@angeltrade.com Puneet Bambha Capital Goods, Engineering puneet.bambha@angeltrade.com Sushant Dalmia Pharmaceutical sushant.dalmia@angeltrade.com Rupesh Sankhe Cement, Power rupeshd.sankhe@angeltrade.com Param Desai Real Estate, Logistics, Shipping paramv.desai@angeltrade.com Sageraj Bariya Fertiliser, Mid-cap sageraj.bariya@angeltrade.com Viraj Nadkarni Retail, Hotels, Mid-cap virajm.nadkarni@angeltrade.com Paresh Jain Metals & Mining pareshn.jain@angeltrade.com Amit Rane Banking amitn.rane@angeltrade.com Rahul Jain IT rahul.j@angeltrade.com Jai Sharda Mid-cap jai.sharda@angeltrade.com Sharan Lillaney Mid-cap sharanb.lillaney@angeltrade.com Amit Vora Research Associate (Oil & Gas) amit.vora@angeltrade.com V Srinivasan Research Associate (Cement, Power) v.srinivasan@angeltrade.com Aniruddha Mate Research Associate (Infra, Real Estate) aniruddha.mate@angeltrade.com Shreya Gaunekar Research Associate (Automobile) shreyap.gaunekar@angeltrade.com Mihir Salot Research Associate (Logistics, Shipping) mihirr.salot@angeltrade.com Chitrangda Kapur Research Associate (FMCG, Media) chitrangdar.kapur@angeltrade.com Vibha Salvi Research Associate (IT, Telecom) vibhas.salvi@angeltrade.com Pooja Jain Research Associate (Metals & Mining) pooja.j@angeltrade.com Technicals: Shardul Kulkarni Sr. Technical Analyst shardul.kulkarni@angeltrade.com Mileen Vasudeo Technical Analyst vasudeo.kamalakant@angeltrade.com Derivatives: Siddarth Bhamre Head - Derivatives siddarth.bhamre@angeltrade.com Jaya Agarwal Jr. Derivative Analyst jaya.agarwal@angeltrade.com Institutional Sales Team: Mayuresh Joshi VP - Institutional Sales mayuresh.joshi@angeltrade.com Abhimanyu Sofat AVP - Institutional Sales abhimanyu.sofat@angeltrade.com Nitesh Jalan Sr. Manager niteshk.jalan@angeltrade.com Pranav Modi Sr. Manager pranavs.modi@angeltrade.com Sandeep Jangir Sr. Manager sandeepp.jangir@angeltrade.com Ganesh Iyer Sr. Manager ganeshb.Iyer@angeltrade.com Jay Harsora Sr. Dealer jayr.harsora@angeltrade.com Meenakshi Chavan Dealer meenakshis.chavan@angeltrade.com Gaurang Tisani Dealer gaurangp.tisani@angeltrade.com Production Team: Bharathi Shetty Research Editor bharathi.shetty@angeltrade.com Dharmil Adhyaru Assistant Research Editor dharmil.adhyaru@angeltrade.com Bharat Patil Production bharat.patil@angeltrade.com Dilip Patel Production dilipm.patel@angeltrade.com Angel Broking Ltd: BSE Sebi Regn No : INB 010996539 / CDSL Regn No: IN - DP - CDSL - 234 - 2004 / PMS Regn Code: PM/INP000001546 Angel Securities Ltd:BSE: INB010994639/INF010994639 NSE: INB230994635/INF230994635 Membership numbers: BSE 028/NSE:09946 Angel Capital & Debt Market Ltd: INB 231279838 / NSE FNO: INF 231279838 / NSE Member code -12798 Angel Commodities Broking (P) Ltd: MCX Member ID: 12685 / FMC Regn No: MCX / TCM / CORP / 0037 NCDEX : Member ID 00220 / FMC Regn No: NCDEX / TCM / CORP / 0302