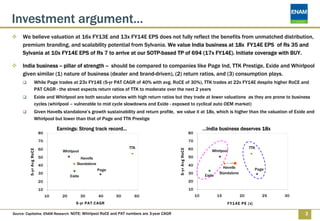
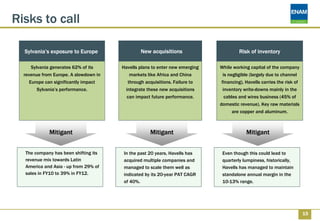
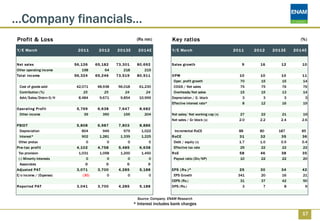
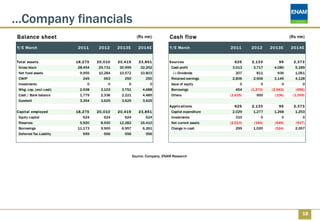
The report recommends buying Havells India with a target price of Rs 694, representing 28% upside potential. Havells has a strong distribution network and brands, and its India business deserves a higher valuation of 18x FY14 EPS compared to its peers due to stable growth and returns. The report also views Havells' Sylvania business positively, though near-term earnings will be muted in Europe; it values Sylvania at 10x FY14 EPS. The report's sum-of-the-parts valuation arrives at a target price of Rs 694 per share.
This presentations gives high level overview of : networking, security, storage, end point devices (PC), Servers, Enterprise System Management and Development and SOA\integration domains. It includes staffing ratios, vendor and integrator positioning in Israel.
Bajaj Electricals Q1Y15: Growth in line; margins below expectationIndiaNotes.com
Bajaj Electricals (BJE) reported revenue of INR8.9b (est. of INR8.9b), compared to INR7.8b in 1QFY14, marking a YoY growth of 12.5%. Consumer Durables reported strong 16% growth, while Lighting and E&P division’s growth was weak.
Bajaj Electricals: A High Voltage TransformationAnkit Akash
Bajaj Electricals: A High Voltage Transformation is a presentation made on the crisis that the company faced in the early 2000's and the turnaround management it followed. It also focuses on corporate restructuring, organizational and financial restructuring. It therefore explains the success story of Bajaj Electricals in India.
A Case study on Havells India Limited, its growth prospects, company history and their marketing activities.
This study was a part of academic project for the college and has been appreciated. Gives insights on how distribution has been leveraged to create excitement in a product category which is generally not that exciting.
Bharat Petroleum Corporation Ltd (BPCL), a government‐owned company operating in
the refining and marketing segment. The company has also diversified into the
petrochemical feedstock and exploration and production segments.
Based on a consolidated FY12 P/E multiple of 12, the fair value for the
company works out to Rs 691.
Money CapitalHeight Research Pvt Ltd is a leading Stock Advisory Company, having a strong hold in providing most authentic and accurate Equity Tips as well as Commodity Tips.
Our research is based around these services:
• Stock Tips
• Commodity Tips
• Equity Tips
• Intraday Tips
• NCDEX Tips
For 2 Days Free Trial, please visit our site at http://www.capitalheight.com or please call our 24/7 Customer Care Support us at +91 9993066624, 0731 - 4295 - 950 Or email us at: contact@capitalheight.com
how can I sell pi coins after successfully completing KYCDOT TECH
Pi coins is not launched yet in any exchange 💱 this means it's not swappable, the current pi displaying on coin market cap is the iou version of pi. And you can learn all about that on my previous post.
RIGHT NOW THE ONLY WAY you can sell pi coins is through verified pi merchants. A pi merchant is someone who buys pi coins and resell them to exchanges and crypto whales. Looking forward to hold massive quantities of pi coins before the mainnet launch.
This is because pi network is not doing any pre-sale or ico offerings, the only way to get my coins is from buying from miners. So a merchant facilitates the transactions between the miners and these exchanges holding pi.
I and my friends has sold more than 6000 pi coins successfully with this method. I will be happy to share the contact of my personal pi merchant. The one i trade with, if you have your own merchant you can trade with them. For those who are new.
Message: @Pi_vendor_247 on telegram.
I wouldn't advise you selling all percentage of the pi coins. Leave at least a before so its a win win during open mainnet. Have a nice day pioneers ♥️
#kyc #mainnet #picoins #pi #sellpi #piwallet
#pinetwork
US Economic Outlook - Being Decided - M Capital Group August 2021.pdfpchutichetpong
The U.S. economy is continuing its impressive recovery from the COVID-19 pandemic and not slowing down despite re-occurring bumps. The U.S. savings rate reached its highest ever recorded level at 34% in April 2020 and Americans seem ready to spend. The sectors that had been hurt the most by the pandemic specifically reduced consumer spending, like retail, leisure, hospitality, and travel, are now experiencing massive growth in revenue and job openings.
Could this growth lead to a “Roaring Twenties”? As quickly as the U.S. economy contracted, experiencing a 9.1% drop in economic output relative to the business cycle in Q2 2020, the largest in recorded history, it has rebounded beyond expectations. This surprising growth seems to be fueled by the U.S. government’s aggressive fiscal and monetary policies, and an increase in consumer spending as mobility restrictions are lifted. Unemployment rates between June 2020 and June 2021 decreased by 5.2%, while the demand for labor is increasing, coupled with increasing wages to incentivize Americans to rejoin the labor force. Schools and businesses are expected to fully reopen soon. In parallel, vaccination rates across the country and the world continue to rise, with full vaccination rates of 50% and 14.8% respectively.
However, it is not completely smooth sailing from here. According to M Capital Group, the main risks that threaten the continued growth of the U.S. economy are inflation, unsettled trade relations, and another wave of Covid-19 mutations that could shut down the world again. Have we learned from the past year of COVID-19 and adapted our economy accordingly?
“In order for the U.S. economy to continue growing, whether there is another wave or not, the U.S. needs to focus on diversifying supply chains, supporting business investment, and maintaining consumer spending,” says Grace Feeley, a research analyst at M Capital Group.
While the economic indicators are positive, the risks are coming closer to manifesting and threatening such growth. The new variants spreading throughout the world, Delta, Lambda, and Gamma, are vaccine-resistant and muddy the predictions made about the economy and health of the country. These variants bring back the feeling of uncertainty that has wreaked havoc not only on the stock market but the mindset of people around the world. MCG provides unique insight on how to mitigate these risks to possibly ensure a bright economic future.
What price will pi network be listed on exchangesDOT TECH
The rate at which pi will be listed is practically unknown. But due to speculations surrounding it the predicted rate is tends to be from 30$ — 50$.
So if you are interested in selling your pi network coins at a high rate tho. Or you can't wait till the mainnet launch in 2026. You can easily trade your pi coins with a merchant.
A merchant is someone who buys pi coins from miners and resell them to Investors looking forward to hold massive quantities till mainnet launch.
I will leave the telegram contact of my personal pi vendor to trade with.
@Pi_vendor_247
when will pi network coin be available on crypto exchange.DOT TECH
There is no set date for when Pi coins will enter the market.
However, the developers are working hard to get them released as soon as possible.
Once they are available, users will be able to exchange other cryptocurrencies for Pi coins on designated exchanges.
But for now the only way to sell your pi coins is through verified pi vendor.
Here is the telegram contact of my personal pi vendor
@Pi_vendor_247
how to sell pi coins in all Africa Countries.DOT TECH
Yes. You can sell your pi network for other cryptocurrencies like Bitcoin, usdt , Ethereum and other currencies And this is done easily with the help from a pi merchant.
What is a pi merchant ?
Since pi is not launched yet in any exchange. The only way you can sell right now is through merchants.
A verified Pi merchant is someone who buys pi network coins from miners and resell them to investors looking forward to hold massive quantities of pi coins before mainnet launch in 2026.
I will leave the telegram contact of my personal pi merchant to trade with.
@Pi_vendor_247
Currently pi network is not tradable on binance or any other exchange because we are still in the enclosed mainnet.
Right now the only way to sell pi coins is by trading with a verified merchant.
What is a pi merchant?
A pi merchant is someone verified by pi network team and allowed to barter pi coins for goods and services.
Since pi network is not doing any pre-sale The only way exchanges like binance/huobi or crypto whales can get pi is by buying from miners. And a merchant stands in between the exchanges and the miners.
I will leave the telegram contact of my personal pi merchant. I and my friends has traded more than 6000pi coins successfully
Tele-gram
@Pi_vendor_247
The Evolution of Non-Banking Financial Companies (NBFCs) in India: Challenges...beulahfernandes8
Role in Financial System
NBFCs are critical in bridging the financial inclusion gap.
They provide specialized financial services that cater to segments often neglected by traditional banks.
Economic Impact
NBFCs contribute significantly to India's GDP.
They support sectors like micro, small, and medium enterprises (MSMEs), housing finance, and personal loans.
what is the future of Pi Network currency.DOT TECH
The future of the Pi cryptocurrency is uncertain, and its success will depend on several factors. Pi is a relatively new cryptocurrency that aims to be user-friendly and accessible to a wide audience. Here are a few key considerations for its future:
Message: @Pi_vendor_247 on telegram if u want to sell PI COINS.
1. Mainnet Launch: As of my last knowledge update in January 2022, Pi was still in the testnet phase. Its success will depend on a successful transition to a mainnet, where actual transactions can take place.
2. User Adoption: Pi's success will be closely tied to user adoption. The more users who join the network and actively participate, the stronger the ecosystem can become.
3. Utility and Use Cases: For a cryptocurrency to thrive, it must offer utility and practical use cases. The Pi team has talked about various applications, including peer-to-peer transactions, smart contracts, and more. The development and implementation of these features will be essential.
4. Regulatory Environment: The regulatory environment for cryptocurrencies is evolving globally. How Pi navigates and complies with regulations in various jurisdictions will significantly impact its future.
5. Technology Development: The Pi network must continue to develop and improve its technology, security, and scalability to compete with established cryptocurrencies.
6. Community Engagement: The Pi community plays a critical role in its future. Engaged users can help build trust and grow the network.
7. Monetization and Sustainability: The Pi team's monetization strategy, such as fees, partnerships, or other revenue sources, will affect its long-term sustainability.
It's essential to approach Pi or any new cryptocurrency with caution and conduct due diligence. Cryptocurrency investments involve risks, and potential rewards can be uncertain. The success and future of Pi will depend on the collective efforts of its team, community, and the broader cryptocurrency market dynamics. It's advisable to stay updated on Pi's development and follow any updates from the official Pi Network website or announcements from the team.
how to sell pi coins at high rate quickly.DOT TECH
Where can I sell my pi coins at a high rate.
Pi is not launched yet on any exchange. But one can easily sell his or her pi coins to investors who want to hold pi till mainnet launch.
This means crypto whales want to hold pi. And you can get a good rate for selling pi to them. I will leave the telegram contact of my personal pi vendor below.
A vendor is someone who buys from a miner and resell it to a holder or crypto whale.
Here is the telegram contact of my vendor:
@Pi_vendor_247
how can i use my minded pi coins I need some funds.DOT TECH
If you are interested in selling your pi coins, i have a verified pi merchant, who buys pi coins and resell them to exchanges looking forward to hold till mainnet launch.
Because the core team has announced that pi network will not be doing any pre-sale. The only way exchanges like huobi, bitmart and hotbit can get pi is by buying from miners.
Now a merchant stands in between these exchanges and the miners. As a link to make transactions smooth. Because right now in the enclosed mainnet you can't sell pi coins your self. You need the help of a merchant,
i will leave the telegram contact of my personal pi merchant below. 👇 I and my friends has traded more than 3000pi coins with him successfully.
@Pi_vendor_247
The secret way to sell pi coins effortlessly.DOT TECH
Well as we all know pi isn't launched yet. But you can still sell your pi coins effortlessly because some whales in China are interested in holding massive pi coins. And they are willing to pay good money for it. If you are interested in selling I will leave a contact for you. Just telegram this number below. I sold about 3000 pi coins to him and he paid me immediately.
Telegram: @Pi_vendor_247
where can I find a legit pi merchant onlineDOT TECH
Yes. This is very easy what you need is a recommendation from someone who has successfully traded pi coins before with a merchant.
Who is a pi merchant?
A pi merchant is someone who buys pi network coins and resell them to Investors looking forward to hold thousands of pi coins before the open mainnet.
I will leave the telegram contact of my personal pi merchant to trade with
@Pi_vendor_247
1. ENAM Securities CMP: Rs 543
India Research Target Price: Rs 694
Potential Upside: 28%
Absolute Rating: BUY
Havells India
Relative to Sector: Outperformer Midcaps
Stock Data
No. of shares : 125 mn
Market cap : Rs 67.8 bn
52 week high/low : Rs 616/ Rs 313
Avg. daily vol. (6mth) : 349,900 shares
Bloomberg code : HAVL IB
Reuters code
Shareholding (%)
: HVEL.BO
Jun-12 QoQ chg
A closer look…calls for a re-rating
Promoters : 61.6 0.0
FIIs : 20.0 0.2
MFs / UTI : 0.9 (0.1)
Banks / FIs : 0.0 0.0
Others : 17.5 (0.0)
Relative Performance
200
Financial Summary (Consolidated)
150
Y/E N et Sales Adj. PAT Consensus EPS Change P/ E EV/ EBITDA R oE R oCE DPS
100 M arc h ( R s mn) ( R s mn) EPS* ( R s.) ( R s.) ( Y oY %) ( x) ( x) ( %) ( %) ( R s)
2011 56,126 3,071 - 25 341 - - 58 31 2.5
50
2012 65,182 3,700 - 30 20 - - 46 32 6.5
Jul-11 Jan-12 Jul-12
2013E 73,301 4,285 35 34 16 15.8 9.5 38 35 7.5
Sensex Havells India 2014E 80,692 5,188 42 42 21 13.1 8.0 35 36 8.5
Source: ENAM Research, Bloomberg Source: Company, ENAM estimates; Note: CMP as on 10 August 2012
Kashyap Pujara Punit Chokhani
Executive Director – Midcaps Asst VP – Midcaps August 13 , 2012
1
kashyap.pujara@enam.com (+91 22 4325 1146) punit.chokhani@enam.com (+91 22 4325 1130)
2. Investment argument…
We believe valuation at 16x FY13E and 13x FY14E EPS does not fully reflect the benefits from unmatched distribution,
premium branding, and scalability potential from Sylvania. We value India business at 18x FY14E EPS of Rs 35 and
Sylvania at 10x FY14E EPS of Rs 7 to arrive at our SOTP-based TP of 694 (17x FY14E). Initiate coverage with BUY.
India business -- pillar of strength -- should be compared to companies like Page Ind, TTK Prestige, Exide and Whirlpool
given similar (1) nature of business (dealer and brand-driven), (2) return ratios, and (3) consumption plays.
While Page trades at 23x FY14E (5-yr PAT CAGR of 40% with avg. RoCE of 30%), TTK trades at 22x FY14E despite higher RoCE and
PAT CAGR - the street expects return ratios of TTK to moderate over the next 2 years
Exide and Whirlpool are both secular stories with high return ratios but they trade at lower valuations as they are prone to business
cycles (whirlpool – vulnerable to mid cycle slowdowns and Exide - exposed to cyclical auto OEM market)
Given Havells standalone’s growth sustainability and return profile, we value it at 18x, which is higher than the valuation of Exide and
Whirlpool but lower than that of Page and TTK Prestige
Earnings: Strong track record… …India business deserves 18x
80 80
70 70
60 TTK 60 TTK
5 -yr Avg RoC E
5 -yr Avg RoC E
Whirlpool Whirlpool
50 Havells 50
40 Standalone 40
Havells Page
Page
30 30 Standalone
Exide Exide
20 20
10 10
10 20 30 40 50 60 10 15 20 25 30
5 -yr PAT C AGR F Y1 4 E PE (x)
Source: Capitaline, ENAM Research. NOTE: Whirlpool RoCE and PAT numbers are 3-year CAGR 2
3. …Investment argument
Sylvania -- a potential cash cow: Management strategy to replicate India success in new geographies (emerging
markets) would drive Sylvania’s earnings going forward. However, exposure to Europe would keep earnings muted in
the short term. We value Sylvania at 10x FY14E EPS of Rs 7 (in line with peer average).
M kt Cap Sales ( R s bn) PAT ( R s bn) EV/ EB ( x) P/ E ( x) R oE ( %)
Co N ame Country Co. produc t ( R s bn) FY 13e FY 14e FY 13e FY 14e FY 12 FY 13e FY 14e FY 12 FY 13e FY 14e FY 12 FY 13e FY 14e
Koninklijke Phil Holland lighting, appliances 1,310 1,658 1,729 78 95 18 7 6 (14) 15 12 (9) 9 11
Foshan Elec-B China Lighting 54 23 26 3 3 14 na na 15 9 8 10 na na
Zumtobel Ag Austria lighting, appliances 26 88 91 2 3 6 6 5 25 17 9 4 6 11
Average 13 6 5 8 14 10
SOTP valuation F Y1 4 E
Comfort factors: Havells Standalone
FY14E EPS (Rs) 35
Distribution and branding act as a key entry barrier for the business. It has
P/E Multiple 18
16,000+ dealers across the world (6,000 in India). India is adding 700-800
dealers a year. Annual ad spends are > Rs 1 bn (3% of sales) Value Per Share (Rs) 625
Sylvania
40% profit CAGR over last 20 years on the back of product launches and FY14E EPS (Rs) 7
acquisitions. We expect 11% revenue and 18% profit CAGR over FY12-14. P/E Multiple 10
India business has been growing at 3x GDP for the last five years Value Per Share (Rs) 69
Total Value (Rs) 694
Channel financing helps to reduce working capital requirement and
increase dealer loyalty in India. Note Havells is one of the few companies in
its space having the ability to avail channel financing, which gives it a
distinct competitive advantage
Source: Bloomberg, ENAM Research 3
4. Company overview
Havells consolidated – FY12
Revenue : Rs 65.2 bn
EBITDA : Rs 6.7 bn
PAT : Rs 3.7 bn
Capital employed : Rs 20.0 bn
RoCE : 30%
Havells India – FY12 Sylvania – FY12
Revenue : Rs 36.2 bn Revenue : Rs 29.0 bn
EBITDA : Rs 4.6 bn EBITDA : Rs 2.1 bn
PAT : Rs 3.0 bn PAT : Rs 0.7 bn
B2B B2C B2C
Electrical cables – Lighting fixtures & lamps -
44% of sales 15% of sales Lighting fixtures & lamps -
4-year value CAGR – 14% 4-year value CAGR – 20%
Contribution margin – 8% Contribution margin – 23% Europe – 62% of sales
Domestic switchgears – Consumer appliances –
25% of sales 16% of sales Latin America & Asia -
4-year value CAGR – 15% 38% of sales
4-year value CAGR – 26%
Contribution margin – 35% Contribution margin – 27%
Source: Company, ENAM Research Refer Appendix for product details 4
5. Table of contents
Slide No.
India business 6
Sylvania 12
Risk factors 15
Company financials 16
Appendix 19
5
7. Key strategy and strengths
Havells strategy is to cater to all electrical
product requirements of its customers,
leveraging on the same channel/ brand
DEALERS Larger product basket
Focus on channel management
Brand positioning to equal quality supremacy
Transition from B2B to B2C segment
Multiple Products, Universal Branding, One Distribution Channel
Source: ENAM Research 7
8. Distribution to PUSH…
Havells has built one of the largest distribution network in the industry Dealer network ↑ 6x in 8 years
Distribution network of 6,000 dealers reaching out to 1,00,000 retailers 2003 2011 Increase (x)
Dealers 1,000 5,600 5.6
Successfully expanding product portfolio through the established network,
Retailers 25,000 100,000 4.0
while simultaneously expanding the network itself
Year Product launches
Adding 700-800 dealers every year to its existing network
1976 Switchgears
1980 Electric meters
Impetus on dealer growth to grow core business 1996 Cables and wires
Entire business is through dealers. Personal attention and incentive 2003 Fans, lighting fittings and CFL
2006 Modular switches
programs are high on agenda to motivate dealers and enhance loyalty.
2007 Power capacitors and motors
Channel financing 2010 Water heaters
Havells is one of the few companies in the space to offer channel financing to 2011 Small consumer appliances
its dealers through banks
Dealers get working capital loans from banks. Interest payable on these loans
is passed on as a cash discount to the dealers by Havells Benefits of channel financing
Loans have a 5% recourse on Havells but are completely insured Havells Insured 5%
recourse
Channel financing not only increases dealer loyalty, but also strengthens
Havells’ balance sheet Cash discount
Channel Financing has reduced working capital requirement of Havells
Rs mn F Y0 7 F Y0 8 F Y0 9 F Y1 0 F Y1 1 F Y1 2 Dealer Interest Bank
Debtors reported 310 661 867 795 1,121 1,597
D ebtors (incl. factoring) 2 ,3 0 7 3 ,0 4 6 2 ,7 5 2 3 ,6 0 6 4 ,9 5 6 6 ,7 4 0
D ebtor cycle (D ays)
Reduces working capital
Reported 7 12 14 12 14 16
Incl. factoring 55 54 46 56 63 68 Enhances purchasing power of dealer
Source: Company, ENAM Research 8
9. …Branding to PULL
The company has created a strong umbrella brand – HAVELLS -- all products are sold under this single brand.
Havells has positioned itself as a premium player in the electrical consumer segment to PULL customers.
A strong balance sheet enables it to build brand equity --- ad spend of more than Rs 1 bn (~3% of sales),
which is difficult to replicate by other players in this space.
Company-owned Havells World and dealer-run Havells Galaxy are brand initiatives of their own kind
Havells World outlets are used by the company to showcase its product range, provide technical assistance to dealers,
and improve visibility of its brands. Walk-in customers are diverted to dealers
The company plans to increase its exclusive retail outlets (Havells Galaxy) to 200 in FY13 from 140 currently
Exclusive outlets – a branding initiative Havells’ ad spend :~3% of sales
1,200 4
(Rs mn) (%)
1,000
3
800
600 2
400
1
200
0 0
FY08 FY09 FY10 FY11 FY12
Havells (LHS) Bajaj Electricals (LHS)
Havells (RHS) Bajaj Electricals (RHS)
Source: Company, ENAM Research 9
10. Sustainable growth…
Consistent growth Stable margin
15 12 80
(x) (%) (%)
12 10 60
8 40
9
6 20
6
4 0
3 2 (20)
0 0 (40)
Mar-94
Mar-95
Mar-96
Mar-97
Mar-98
Mar-99
Mar-00
Mar-01
Mar-02
Mar-03
Mar-04
Mar-05
Mar-06
Mar-07
Mar-08
Mar-09
Mar-10
Mar-11
Mar-12
FY04
FY05
FY06
FY07
FY08
FY09
FY10
FY11
FY12
Havells Sales growth as a multiple to GDP EBITDA margin Copper
Real GDP (RHS) Aluminium Steel
Since its listing in 1993, revenue has grown at EBIDTA margin has been in 10-13% band
average multiple of 6x GDP growth. over the last decade, despite volatile raw
material prices.
Despite higher revenue base and sluggish
economy, domestic revenue has grown at 3x GDP
growth in the last 5 years.
Given its strengths and strategy, we believe Havells’ domestic revenue will continue to post 15-
20% CAGR with sustainable EBIDTA margin of 12-13% over next few years
Source: Company, Business Beacon, Bloomberg 10
13. India not enough; eyeing the globe
Expansion in other geographies to address A well-structured bet
scalability ceiling. Acquisition of Sylvania in 2007 – Funding (mn €) Comments
EV 235
1st major step in that direction.
Pension Liabilities 35
Recourse Loan on Havells India 80 Repayed € 50 mn by timely equity infusion from
Sylvania business in line with domestic strategy Warbug Pincus
Distribution network of over 10,000 dealers - Repaid € 23 mn in 7 tranches of € 3.3 mn
Non Recourse Loan 120 Term loan of € 80 mn - Repayed € 17 mn
presence across Europe, LatAm and Asia
Refinanced the remaining. Current Loan of € 117 mn
Sylvania is a 100-year old brand - well entrenched in
the market place. This has transformed Havells into a Post acquisition, Restructured operations
Sylvania slipped into enabled turnaround.
global player competing with the likes of Philips, GE losses due to Euro EBIDTA margin moved
and Osram zone issues from -3% to 8%
12
(%)
Successfully executed turnaround
10 10
Immediately after the acquisition, Lehman and Euro 8 9 9 9 9
9 8
zone crisis (Europe- 61 % of sale) caused Sylvania to slip 8
7
8
6
into losses, thus breaching covenants
4 5
Havells restructured operations at Sylvania by 4
3
shutting plants
0
retrenching staff across Europe (3)
(3) (1)
outsourcing manufacturing to low cost countries
(4)
Havells took a restructuring charge of ~Rs 5 bn over
H1FY10
9MFY10
FY10
H1FY11
9MFY11
FY11
H1FY12
9MFY12
FY12
FY09-10
Havells managed to turnaround Sylvania in FY10
Europe America
Source: Company 13
14. Sylvania – Potential cash cow
Roadmap Focus: To tilt sales to LatAM and Asia
Europe – Focus on profitability Sales Mix F Y1 0 F Y1 2 F Y1 3 E F Y1 4 E
After successfully reducing costs, focus now is Europe 71% 61% 0% 0%
Latin America + Others 29% 39% 0% 0%
to improve realizations to pass on costs
To increase outsourcing (45% of Europe sales
is outsourced from China)
Refinanced debt – payment schedule
LatAm and emerging markets to drive growth Euro mn FY13 FY14 FY15 FY16 FY17 Total
Revenue mix shifting towards Latin America + By Sylvania 4 11 14 16 32 77
other markets. (Revenue growing at 10-12% By Havells India 40 0 0 0 0 40
Total 44 11 14 16 32 117
vs. flat growth in Europe)
Plans to enter other EMs - South Africa and
China
A potential cash cow
Opportunity to cross-sell
Euro mn FY12 FY13E FY14E FY15E FY16E
Havells has started exporting switchgears to PAT 10 9 12 16 21
Europe to leverage on Sylvania’s distribution (+) Depreciation 8 7 7 7 7
(-) Chng wcap 8 3 1 0 1
network
(-) Capex 4 4 4 4 4
Sylvania’s range of fixtures will be introduced in FCF 6 9 14 19 23
India by a plant set up by Havells in Nirmana Cash & Bank 13
Debt Repayment 4 11 14 16
(Rajasthan)
Source: Company, ENAM Research
Sylvania is well poised to repay debt from its
own cash flows
14
15. Risks to call
Sylvania’s exposure to Europe New acquisitions Risk of inventory
Sylvania generates 62% of its Havells plans to enter new emerging While working capital of the company
revenue from Europe. A slowdown in markets like Africa and China is negligible (largely due to channel
Europe can significantly impact through acquisitions. Failure to financing), Havells carries the risk of
Sylvania’s performance. integrate these new acquisitions inventory write-downs mainly in the
can impact future performance. cables and wires business (45% of
domestic revenue). Key raw materials
are copper and aluminum.
Mitigant Mitigant Mitigant
The company has been shifting its In the past 20 years, Havells has Even though this could lead to
revenue mix towards Latin acquired multiple companies and quarterly lumpiness, historically,
America and Asia - up from 29% of managed to scale them well as Havells has managed to maintain
sales in FY10 to 39% in FY12. indicated by its 20-year PAT CAGR standalone annual margin in the
of 40%. 10-13% range.
15
16. Company financials…
Consolidated assumptions
H avells Standalone ( R s bn) FY 11 FY 12 FY 13E FY 14E Sylvania ( Euro mn) FY 11 FY 12 FY 13E FY 14E
Switc hgear ( A) 8 10 11 12 Net R evenue 450 448 452 466
Value growth (YoY) 12% 23% 12% 12% Value growth (YoY) 9% 0% 1% 3%
Contribution margin (%) 34% 34% 34% 34%
EBIT 18 31 28 32
Cables ( B) 14 18 21 25
EBIT margin (%) 4.0% 6.8% 6.2% 6.8%
Value growth (YoY) 28% 29% 18% 18%
Contribution margin (%) 7% 8% 8% 8%
Lighting & Fixtures ( C) 5 6 8 9
H avells Consolidated ( R s bn) FY 11 FY 12 FY 13E FY 14E
Value growth (YoY) 28% 27% 25% 25%
Net R evenue 56 65 73 81
Contribution margin (%) 17% 23% 23% 23%
Value growth (YoY) 9% 16% 12% 10%
Consumer Durables ( D) 5 6 8 10
EBIT 5.0 6.0 6.8 7.9
Value growth (YoY) 40% 23% 25% 25%
EBIT margin (%) 8.9% 9.3% 9.3% 9.7%
Contribution margin (%) 26% 27% 27% 27%
( A) +( B) +( C) +( D) 32 40 47 56
Less ( Discounts, excise duty) 3 4 4 5
Net R evenue 29 36 43 51
Standalone Unallocable Exp 2 4 4 5
Standalone EBIT* 3 4 5 6
EBIT margin (%) 11% 12% 12% 11%
Note: EBIT = Segmental contribution - Unallocables
Source: Company, ENAM Research 16
17. …Company financials…
Profit & Loss (Rs mn) Key ratios (%)
Y/E March 2011 2012 2013E 2014E Y/E March 2011 2012 2013E 2014E
Net sales 56,126 65,182 73,301 80,692 Sales growth 9 16 12 10
Other operating income 198 64 218 219
Total inc ome 56,324 65,246 73,519 80,911 O PM 10 10 10 11
Oper. profit growth 70 15 15 14
Cost of goods sold 42,071 48,938 56,018 61,230 COGS / Net sales 75 75 76 76
Contribution (%) 25 25 24 24 Overheads/Net sales 15 15 13 14
Advt/Sales/Distrn O/H 8,484 9,671 9,854 10,999 Depreciation / G. block 3 3 3 3
Effective interest rate* 8 12 16 19
O perating Prof it 5,769 6,638 7,647 8,682
Other income 39 350 155 204 Net sales/ Net working cap (x) 27 22 21 19
Net sales / Gr block (x) 2.0 2.2 2.4 2.6
PBIDT 5,808 6,987 7,803 8,886
Depreciation 804 949 979 1,022 Incremental RoCE 88 80 187 85
Interest* 902 1,281 1,339 1,225 R oCE 31 32 35 36
Other pretax 0 0 0 0 Debt / equity (x) 1.7 1.0 0.5 0.4
Pre-tax profit 4,102 4,758 5,485 6,638 Effective tax rate 25 22 22 22
Tax provision 1,031 1,058 1,200 1,450 R oE 58 46 38 35
(-) Minority Interests 0 0 0 0 Payout ratio (Div/NP) 10 22 22 20
Associates 0 0 0 0
Adjusted PAT 3,071 3,700 4,285 5,188 EPS ( R s.) ^ 25 30 34 42
E/o income / (Expense) (30) 0 0 0 EPS Growth 341 20 16 21
CEPS (Rs.) 31 37 42 50
R eported PAT 3,041 3,700 4,285 5,188 DPS (Rs.) 3 7 8 9
Source: Company, ENAM Research
* Interest includes bank charges
17
19. Appendix
Havells: 20-year earnings CAGR of 40%
Product portfolio
New launches
Domestic business: Segmental performance
Sylvania – Product range
19
20. 20-year earnings CAGR of 40%
Leveraging on strengths:
consumer appliances &
Transformation phase: cross selling of products
Expansion of product Global foray
portfolio 2010…
Transformation phase: 2007 - 10
Distributor to manufacturer 2003 - 07
Leveraging on a well-
1958 - 2003 Forayed into fans, lighting and
In 2007, Havells acquired
established distribution
Sylvania – A 100-year old
CFLs in 2003, positioning its network and brand, Havells
lighting major in Europe to
In 1958, started as a mere products in the premium successfully introduced a
gain global footprint
distributor of switches category range of water heaters
Acquisition was an LBO, (2010) and small consumer
Acquired brand “Havells” in As a result of its strong brand wherein Havells acquired a appliances (2011) in the
1971 and started and distribution network, Havells global business for Indian market. This would
manufacturing switchgears garnered significant market ~Rs 16 bn with an equity drive volume in future
and meters share in a short span of time investment of Rs 1.6 bn
It is now bringing in lighting
Post listing in 1993, it 2006 market share: ~6% in Restructured operations range from Sylvania into
ventured into cable/wire fans, 3% in lightings, ~10% in post the European crisis & India
manufacturing CFLs turned around Sylvania
Rs mn 1993 2003 2007 2010 2013E 2 0 YR C AGR
Revenue 109 2,525 15,472 51,626 73,301 38%
EBITDA 14 255 1,458 3,222 7,647 37%
Margin 13% 10% 9% 6% 10%
PAT 5 90 1,021 696 4,285 41% Aberration: Sylvania
RoCE 20% 45% 16% 34% slipped into losses due to
the European crisis
New product launches and acquisitions led to robust performance
Source: Company, ENAM Research 20
24. Sylvania – Product range
Fixtures (33% of revenue) Lamps (55% of revenue) Others (12% of revenue)
Architectural Industrial/ Fluorescent Energy saving/ Incandescent Halogen High density
/ accent commercial (CFL/ LED) discharge (HID)
Major peers
Zumtobel Philips
Philips Osram
GE
Source: Company 24
25. ENAM Securities Pvt. Ltd.
Axis House, C2, Wadia International Centre, P.B Marg, Worli, Mumbai 400 025, India.
Tel:- Board +91-22 4325 2525; Dealing +91-22 2438 8861 - 69;
Fax:- Research +91-22 4325 1110; Dealing +91-22 4325 3500
CONFLICT OF INTEREST DISCLOSURE
We, at ENAM, are committed to providing the most honest and transparent advice to our clients. However, given the nature of the capital markets, from time to time we are faced with situations that could give rise to
potential conflict of interest. In order to provide complete transparency to our clients, before we make any recommendations, we are committed to making a disclosure of our interest and any potential conflict IN
ADVANCE so that the interests of our clients are safe- guarded at all times. In light of this policy, we have instituted what we believe to be the most comprehensive disclosure policy among leading investment
banks/brokerages in the world so that our clients may make an informed judgment about our recommendations. The following disclosures are intended to keep you informed before you make any decision- in addition, we
will be happy to provide information in response to specific queries that our clients may seek from us.
Disclosure of interest statement (As of August 8, 2012)
1. Analyst ownership of the stock No
2. Firm ownership of the stock No
3. Directors ownership of the stock No
4. Investment Banking mandate No
5. Broking relationship No
We are committed to providing completely independent and transparent recommendations to help our clients reach a better decision.
This document is provided for assistance only and is not intended to be and must not alone be taken as the basis for an investment decision. Nothing in this document should be construed as investment or financial advice,
and nothing in this document should be construed as an advice to buy or sell or solicitation to buy or sell the securities of companies referred to in this document. The intent of this document is not in recommendary nature
Each recipient of this document should make such investigations as it deems necessary to arrive at an independent evaluation of an investment in the securities of companies referred to in this document (including the
merits and risks involved), and should consult its own advisors to determine the merits and risks of such an investment. The investment discussed or views expressed may not be suitable for all investors
Enam Securities Private Limited has not independently verified all the information given in this document. Accordingly, no representation or warranty, express or implied, is made as to the accuracy, completeness or
fairness of the information and opinions contained in this document
The Disclosures of Interest Statement incorporated in this document is provided solely to enhance the transparency and should not be treated as endorsement of the views expressed in the report. This information is subject
to change without any prior notice. The Company reserves the right to make modifications and alternations to this statement as may be required from time to time without any prior approval
Enam securities Private Limited, its affiliates, their directors and the employees may from time to time, effect or have effected an own account transaction in, or deal as principal or agent in or for the securities mentioned
in this document. They may perform or seek to perform investment banking or other services for, or solicit investment banking or other business from, any company referred to in this report. Each of these entities
functions as a separate, distinct and independent of each other. The recipient should take this into account before interpreting the document
This report has been prepared on the basis of information, which is already available in publicly accessible media or developed through analysis of ENAM Securities Private Limited. The views expressed are those of
analyst and the Company may or may not subscribe to all the views expressed therein
This document is being supplied to you solely for your information and may not be reproduced, redistributed or passed on, directly or indirectly, to any other person or published, copied, in whole or in part, for any
purpose. Neither this document nor any copy of it may be taken or transmitted into the United State (to U.S.Persons), Canada, or Japan or distributed, directly or indirectly, in the United States or Canada or distributed or
redistributed in Japan or to any resident thereof. The distribution of this document in other jurisdictions may be restricted by law, and persons into whose possession this document comes should inform themselves about,
and observe, any such restrictions
Neither the Firm, not its directors, employees, agents or representatives shall be liable for any damages whether direct or indirect, incidental, special or consequential including lost revenue or lost profits that may arise
from or in connection with the use of the information.
Copyright in this document vests exclusively with ENAM Securities Private Limited.
25