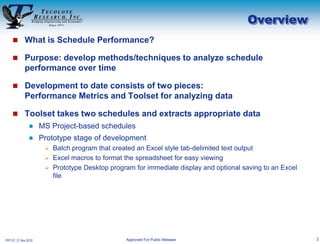
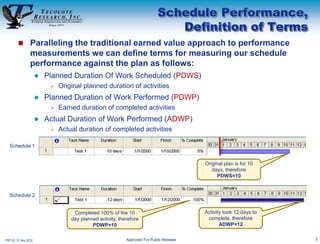
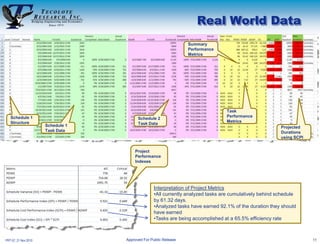
Measuring Schedule Performance
                                     NASA Project Management Challenge 2011
                                                              8 - 10 February 2011
                                                                       Tony Harvey


                                         Los Angeles  Washington, D.C.  Boston  Chantilly  Huntsville  Dayton  Santa Barbara
          Albuquerque  Colorado Springs  Ft. Meade  Ft. Monmouth  Goddard Space Flight Center  Ogden  Patuxent River  Silver Spring  Washington Navy Yard
 Cleveland  Dahlgren  Denver  Johnson Space Center  Montgomery  New Orleans  Oklahoma City  San Antonio  San Diego  Tampa  Tacoma  Vandenberg AFB


PRT-57, 21 Nov 2010                                                Approved For Public Release
Acknowledgements

     NASA JSC, Constellation Mission Operations Project funded the
             concept development and tool development

     Terri Blatt for her support in applying the technique to the MOP
             PP&C environment

     Greg Hay for keeping monthly revisions of the MOP schedule and
             providing them for use in testing the schedule comparison tool

     Mike Stelly for his help with the presentation content


PRT-57, 21 Nov 2010                  Approved For Public Release                      2
Overview
     What is Schedule Performance?

     Purpose: develop methods/techniques to analyze schedule
             performance over time

     Development to date consists of two pieces:
             Performance Metrics and Toolset for analyzing data

     Toolset takes two schedules and extracts appropriate data
                     MS Project-based schedules
                     Prototype stage of development
                        Batch program that created an Excel style tab-delimited text output
                        Excel macros to format the spreadsheet for easy viewing
                        Prototype Desktop program for immediate display and optional saving to an Excel
                         file


PRT-57, 21 Nov 2010                              Approved For Public Release                               3
What is Schedule Performance?
                                and Why do we need more metrics?
        The collection of project cost performance measures based on
               actual resource cost is often made difficult by inaccurate or missing
               resource cost data

        Yet even basic schedules includes quantitative data, which can be
               used in measuring schedule performance. This includes:
                     Task start and end dates
                     Task durations
                     Task completion assessment

        The VALUE expressed in all schedules is in the TIME COST
               (duration) of the tasks

                Using two schedules in a comparison process provides
                     A statement of planned activity, in the earlier schedule
                     A statement of performed activity, in the later schedule

        Schedule Performance is simply “measuring a project’s ability to
               complete its planned activities in a given timeframe”
PRT-57, 21 Nov 2010                              Approved For Public Release           4
Schedule Performance,
                                                                                Definition of Terms
         Paralleling the traditional earned value approach to performance
                 measurements we can define terms for measuring our schedule
                 performance against the plan as follows:
                         Planned Duration Of Work Scheduled (PDWS)
                              Original planned duration of activities
                         Planned Duration of Work Performed (PDWP)
                              Earned duration of completed activities
                         Actual Duration of Work Performed (ADWP)
                              Actual duration of completed activities

  Schedule 1


                                                                                          Original plan is for 10
                                                                                             days, therefore
                                                                                               PDWS=10


  Schedule 2


                                    Completed 100% of the 10                              Activity took 12 days to
                                   day planned activity, therefore                         complete, therefore
                                            PDWP=10                                              ADWP=12


PRT-57, 21 Nov 2010                                         Approved For Public Release                              5
Schedule Earned Value
                                                                                               Metrics
         Based on the performance measures a number of metrics can be
                 calculated
                          Schedule Variance for Duration (SVd): PDWP - PDWS
                               The difference between earned duration and planned duration
                               Negative values imply a schedule slip

                          Schedule Performance Index for Duration (SPId): PDWP/PDWS
                               Schedule efficiency factor representing the relationship between the earned
                                duration and the planned duration
                               Values less than 1.0 indicate a performance shortfall

                          Schedule Cost Performance Index (SCPI) : PDWP/ADWP
                               A Schedule cost efficiency factor representing the relationship between the
                                earned duration and the actual duration
                               Values less than 1.0 indicate a cost (duration) overrun

                      If PDWS=10, PDWP=10, and ADWP=12, then
                      Schedule Variance (SVd): PDWP – PDWS = 10 - 10 = 0
                          - Interpretation: The scheduled task is earning value on schedule
                      Schedule Performance Index (SPId): PDWP/PDWS = 10 / 10 = 1.0
                      - Interpretation: The scheduled task has earned value perfectly against its planned value
                      Schedule Cost Performance Index (SCPI): PDWP/ADWP = 10/12 = .833
                      - Interpretation: The scheduled task took longer (cost more) to complete than originally planned

PRT-57, 21 Nov 2010                                             Approved For Public Release                              6
Project Level Measures,
                                                                                 A Simple Example
       Schedule 1


                                                   Task 1                  Task 2               Task 3      Task 4         Overall Project
                                                   PDWS: 10                PDWS: 10             PDWS: 8     PDWS: 2        PDWS: 30
                                                   PDWP: 10                PDWP: 8              PDWP: 7     PDWP: 0        PDWP: 25
                                                   ADWP: 12                ADWP: 10             ADWP: 8     ADWP: 2        ADWP: 32
       Schedule 2


                      Schedule Variance (SVd): PDWP – PDWS = 25-30 = -5
                      - Interpretation: The cumulative effect of all schedule tasks analyzed are 5 days behind schedule
                        (not to be interpreted as the overall project is 5 days behind schedule)
                      Schedule Performance Index (SPId): PDWP/PDWS = 25/30 = .83
                      - Interpretation: The project has currently earned 83% of the duration that it had planned to-date
                      Schedule Cost Performance Index (SCPI): PDWP/ADWP = 25/32 = .78
                      - Interpretation: Tasks are taking longer to complete than originally planned


PRT-57, 21 Nov 2010                                               Approved For Public Release                                                7
Why Create a Schedule Comparison
                                         Tool from Scratch?

            There are no existing tools that create these performance measures

            We were motivated to build a tool that could be used for comparing
             ANY two schedule instances from the same project

            Performance measures can be output in a user friendly format (Excel)
             or directly to a database

            Comparing the current schedule against the original schedule provides
             performance measures for the project up to the current schedule’s
             status date (Data Date)

            Using schedules with monthly Data Date intervals will provide
             performance measures for that month interval

            Monthly performance measures can be used for performance trending

            Performance Indices can be used for duration projections and schedule
             confidence level analyses

PRT-57, 21 Nov 2010                    Approved For Public Release                   8
Creating a
             Schedule Comparison
                     Tool


PRT-57, 21 Nov 2010                9
Key Requirements for our
                                                 Schedule Comparison Tool
      Use any two revisions of a project’s schedule

      Create output that “aligns” the two schedules at the task level
                     Tasks are aligned by Task Name

      Create Performance Measures for each task

      Create Performance Measures for the project

      Retain the schedule hierarchical structure
                     Schedules are by their nature organized in a hierarchical structure of
                      summary tasks and regular tasks

      Create Performance Measures at each Summary task level
                     Allows performance measures to be used to reflect the task
                      organization, as modeled in the schedule hierarchy (project teams?,
                      project phases?)

      Create data capable of being stored in a database

PRT-57, 21 Nov 2010                          Approved For Public Release                       10
Real World Data
                                                                 Summary
                                                                 Performance
                                                                 Metrics


                                                                                Task
   Schedule 1                                                                   Performance
                                         Schedule 2
   Structure                                                                    Metrics
                      Schedule 1         Task Data
                                                                                                        Projected
                      Task Data                                                                         Durations
                                                                                                        using SCPI


                                       Project
                                       Performance
                                       Indexes


                                                 Interpretation of Project Metrics
                                                 •All currently analyzed tasks are cumulatively behind schedule
                                                 by 61.32 days.
                                                 •Analyzed tasks have earned 92.1% of the duration they should
                                                 have earned
                                                 •Tasks are being accomplished at a 65.5% efficiency rate


PRT-57, 21 Nov 2010                Approved For Public Release                                                       11
Current Issues &
                                                                        Future Development
   Current Issues
                     Metrics and process
                        SPId tends toward 1 as task nears completion
                            May exceed 1 if task finishes early

                        SPId subject to how scheduler determines “% complete” field
                        SCPId is used for new duration estimate
                            SCPI (PDWP/ADWP) can be zero when task is in progress

                     Tool
                        Uses task names as the identifier to compare tasks
                            Renamed tasks are not comparable unless new name “contains” old name

                        Changes in schedule hierarchy makes analysis difficult
                            Tool option allows looking one level deeper

                        Added tasks are ignored
                        Deleted tasks are excluded from performance metrics


   Future Development
                     Data capture for trending analysis
                     Extraction of task “confidence measures” (low, mode, high duration)

PRT-57, 21 Nov 2010                              Approved For Public Release                        12
Conclusions
        Strengths
                     Does not require resource cost data for performance measures
                     Allows ANY two revisions of a schedule to be compared
                     Creates Task, Summary Task and Project-level performance measures
                     Summary Task performance indices identify items needing attention

        Weaknesses
                     Relies on project percent complete measures from the schedules
                     New (projected) duration estimation function needs refining

        Conclusion
                     Useful performance measures can be obtained from basic schedule data
                     Performance indices are useful focusing functions
                     Schedule comparison provides an earned value (duration) perspective
                      without an EVMS


PRT-57, 21 Nov 2010                           Approved For Public Release                    13

Harvey.tony

  • 1.
    Measuring Schedule Performance NASA Project Management Challenge 2011 8 - 10 February 2011 Tony Harvey  Los Angeles  Washington, D.C.  Boston  Chantilly  Huntsville  Dayton  Santa Barbara  Albuquerque  Colorado Springs  Ft. Meade  Ft. Monmouth  Goddard Space Flight Center  Ogden  Patuxent River  Silver Spring  Washington Navy Yard  Cleveland  Dahlgren  Denver  Johnson Space Center  Montgomery  New Orleans  Oklahoma City  San Antonio  San Diego  Tampa  Tacoma  Vandenberg AFB PRT-57, 21 Nov 2010 Approved For Public Release
  • 2.
    Acknowledgements  NASA JSC, Constellation Mission Operations Project funded the concept development and tool development  Terri Blatt for her support in applying the technique to the MOP PP&C environment  Greg Hay for keeping monthly revisions of the MOP schedule and providing them for use in testing the schedule comparison tool  Mike Stelly for his help with the presentation content PRT-57, 21 Nov 2010 Approved For Public Release 2
  • 3.
    Overview  What is Schedule Performance?  Purpose: develop methods/techniques to analyze schedule performance over time  Development to date consists of two pieces: Performance Metrics and Toolset for analyzing data  Toolset takes two schedules and extracts appropriate data  MS Project-based schedules  Prototype stage of development  Batch program that created an Excel style tab-delimited text output  Excel macros to format the spreadsheet for easy viewing  Prototype Desktop program for immediate display and optional saving to an Excel file PRT-57, 21 Nov 2010 Approved For Public Release 3
  • 4.
    What is SchedulePerformance? and Why do we need more metrics?  The collection of project cost performance measures based on actual resource cost is often made difficult by inaccurate or missing resource cost data  Yet even basic schedules includes quantitative data, which can be used in measuring schedule performance. This includes:  Task start and end dates  Task durations  Task completion assessment  The VALUE expressed in all schedules is in the TIME COST (duration) of the tasks  Using two schedules in a comparison process provides  A statement of planned activity, in the earlier schedule  A statement of performed activity, in the later schedule  Schedule Performance is simply “measuring a project’s ability to complete its planned activities in a given timeframe” PRT-57, 21 Nov 2010 Approved For Public Release 4
  • 5.
    Schedule Performance, Definition of Terms  Paralleling the traditional earned value approach to performance measurements we can define terms for measuring our schedule performance against the plan as follows:  Planned Duration Of Work Scheduled (PDWS)  Original planned duration of activities  Planned Duration of Work Performed (PDWP)  Earned duration of completed activities  Actual Duration of Work Performed (ADWP)  Actual duration of completed activities Schedule 1 Original plan is for 10 days, therefore PDWS=10 Schedule 2 Completed 100% of the 10 Activity took 12 days to day planned activity, therefore complete, therefore PDWP=10 ADWP=12 PRT-57, 21 Nov 2010 Approved For Public Release 5
  • 6.
    Schedule Earned Value Metrics  Based on the performance measures a number of metrics can be calculated  Schedule Variance for Duration (SVd): PDWP - PDWS  The difference between earned duration and planned duration  Negative values imply a schedule slip  Schedule Performance Index for Duration (SPId): PDWP/PDWS  Schedule efficiency factor representing the relationship between the earned duration and the planned duration  Values less than 1.0 indicate a performance shortfall  Schedule Cost Performance Index (SCPI) : PDWP/ADWP  A Schedule cost efficiency factor representing the relationship between the earned duration and the actual duration  Values less than 1.0 indicate a cost (duration) overrun If PDWS=10, PDWP=10, and ADWP=12, then Schedule Variance (SVd): PDWP – PDWS = 10 - 10 = 0 - Interpretation: The scheduled task is earning value on schedule Schedule Performance Index (SPId): PDWP/PDWS = 10 / 10 = 1.0 - Interpretation: The scheduled task has earned value perfectly against its planned value Schedule Cost Performance Index (SCPI): PDWP/ADWP = 10/12 = .833 - Interpretation: The scheduled task took longer (cost more) to complete than originally planned PRT-57, 21 Nov 2010 Approved For Public Release 6
  • 7.
    Project Level Measures, A Simple Example Schedule 1 Task 1 Task 2 Task 3 Task 4 Overall Project PDWS: 10 PDWS: 10 PDWS: 8 PDWS: 2 PDWS: 30 PDWP: 10 PDWP: 8 PDWP: 7 PDWP: 0 PDWP: 25 ADWP: 12 ADWP: 10 ADWP: 8 ADWP: 2 ADWP: 32 Schedule 2 Schedule Variance (SVd): PDWP – PDWS = 25-30 = -5 - Interpretation: The cumulative effect of all schedule tasks analyzed are 5 days behind schedule (not to be interpreted as the overall project is 5 days behind schedule) Schedule Performance Index (SPId): PDWP/PDWS = 25/30 = .83 - Interpretation: The project has currently earned 83% of the duration that it had planned to-date Schedule Cost Performance Index (SCPI): PDWP/ADWP = 25/32 = .78 - Interpretation: Tasks are taking longer to complete than originally planned PRT-57, 21 Nov 2010 Approved For Public Release 7
  • 8.
    Why Create aSchedule Comparison Tool from Scratch?  There are no existing tools that create these performance measures  We were motivated to build a tool that could be used for comparing ANY two schedule instances from the same project  Performance measures can be output in a user friendly format (Excel) or directly to a database  Comparing the current schedule against the original schedule provides performance measures for the project up to the current schedule’s status date (Data Date)  Using schedules with monthly Data Date intervals will provide performance measures for that month interval  Monthly performance measures can be used for performance trending  Performance Indices can be used for duration projections and schedule confidence level analyses PRT-57, 21 Nov 2010 Approved For Public Release 8
  • 9.
    Creating a Schedule Comparison Tool PRT-57, 21 Nov 2010 9
  • 10.
    Key Requirements forour Schedule Comparison Tool  Use any two revisions of a project’s schedule  Create output that “aligns” the two schedules at the task level  Tasks are aligned by Task Name  Create Performance Measures for each task  Create Performance Measures for the project  Retain the schedule hierarchical structure  Schedules are by their nature organized in a hierarchical structure of summary tasks and regular tasks  Create Performance Measures at each Summary task level  Allows performance measures to be used to reflect the task organization, as modeled in the schedule hierarchy (project teams?, project phases?)  Create data capable of being stored in a database PRT-57, 21 Nov 2010 Approved For Public Release 10
  • 11.
    Real World Data Summary Performance Metrics Task Schedule 1 Performance Schedule 2 Structure Metrics Schedule 1 Task Data Projected Task Data Durations using SCPI Project Performance Indexes Interpretation of Project Metrics •All currently analyzed tasks are cumulatively behind schedule by 61.32 days. •Analyzed tasks have earned 92.1% of the duration they should have earned •Tasks are being accomplished at a 65.5% efficiency rate PRT-57, 21 Nov 2010 Approved For Public Release 11
  • 12.
    Current Issues & Future Development  Current Issues  Metrics and process  SPId tends toward 1 as task nears completion  May exceed 1 if task finishes early  SPId subject to how scheduler determines “% complete” field  SCPId is used for new duration estimate  SCPI (PDWP/ADWP) can be zero when task is in progress  Tool  Uses task names as the identifier to compare tasks  Renamed tasks are not comparable unless new name “contains” old name  Changes in schedule hierarchy makes analysis difficult  Tool option allows looking one level deeper  Added tasks are ignored  Deleted tasks are excluded from performance metrics  Future Development  Data capture for trending analysis  Extraction of task “confidence measures” (low, mode, high duration) PRT-57, 21 Nov 2010 Approved For Public Release 12
  • 13.
    Conclusions  Strengths  Does not require resource cost data for performance measures  Allows ANY two revisions of a schedule to be compared  Creates Task, Summary Task and Project-level performance measures  Summary Task performance indices identify items needing attention  Weaknesses  Relies on project percent complete measures from the schedules  New (projected) duration estimation function needs refining  Conclusion  Useful performance measures can be obtained from basic schedule data  Performance indices are useful focusing functions  Schedule comparison provides an earned value (duration) perspective without an EVMS PRT-57, 21 Nov 2010 Approved For Public Release 13

Editor's Notes

  • #5 Reasons forinaccurate or missing resource cost data.Prime and subcontract WBSs do not alignSubcontractors are not “required” to collect detailed level data“Prime” accounting process incapable collecting project oriented dataTIME COST – one day slip in a Critical Path task will cause a one day slip in the projectTime is also important when customer end dates cannot change e.g. If a launch to Mars is possible for only 3 weeks every 26 months, end date slips beyond launch opportunities can be very expensive
  • #9 Every schedule has an “as of” date, referred to as the “Data Date”Any two schedules can be compared to calculate the project’s schedule performance for the period between the two Data Dates
  • #12 Projected duration is simply the remaining duration divided by the SCPI added to the actual duration