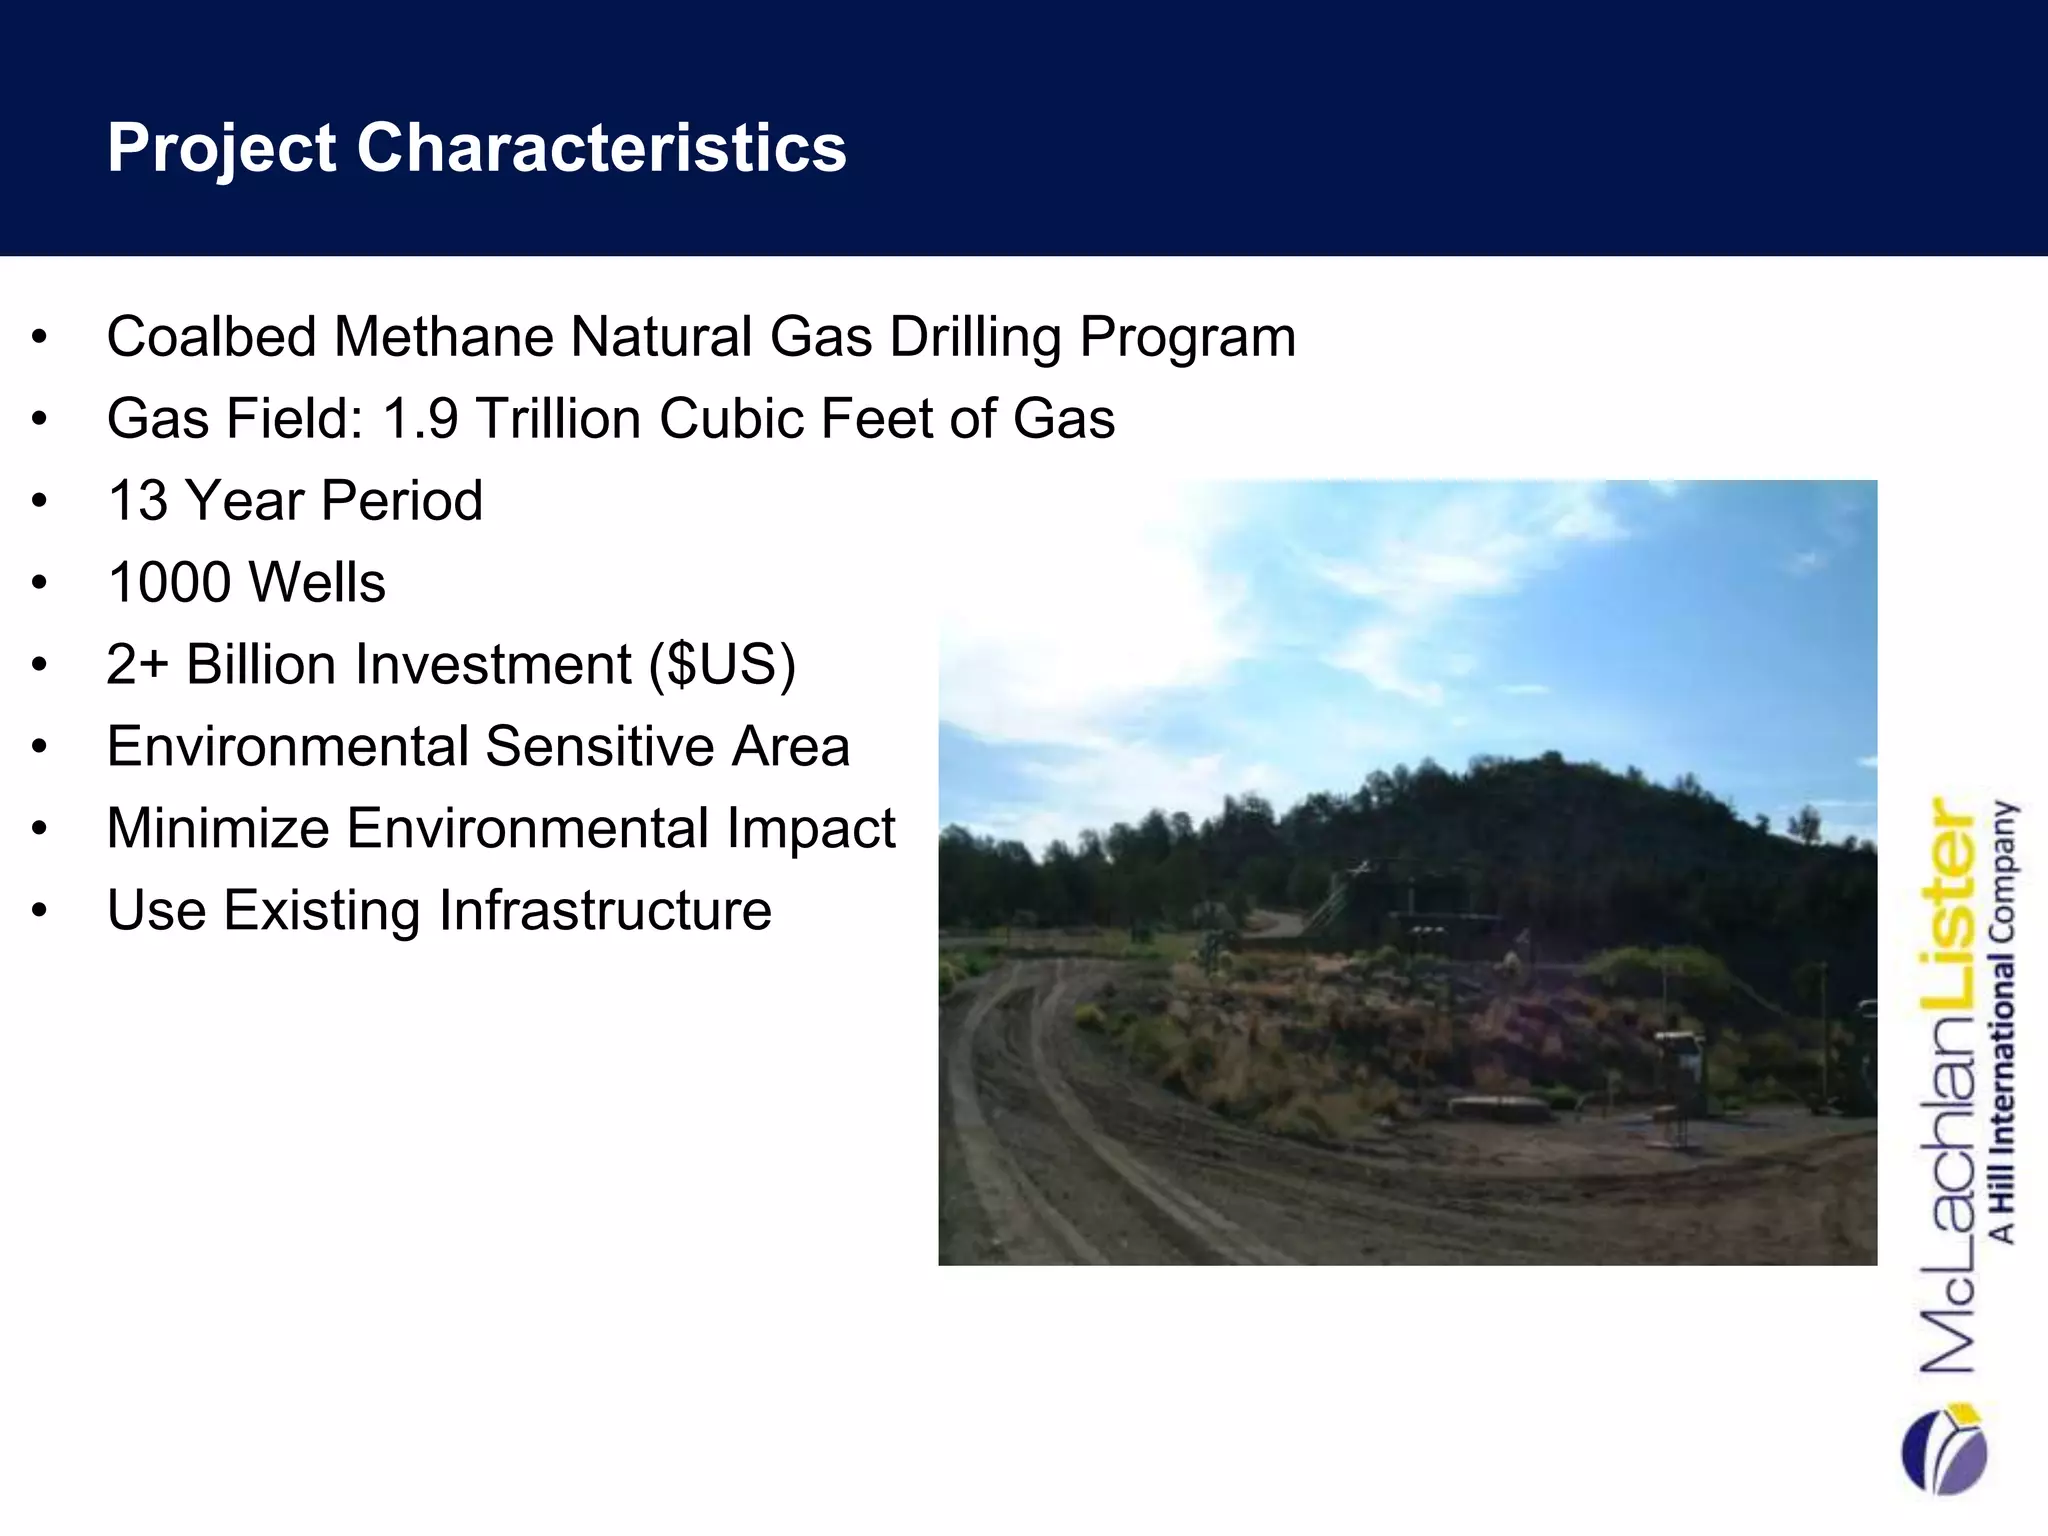
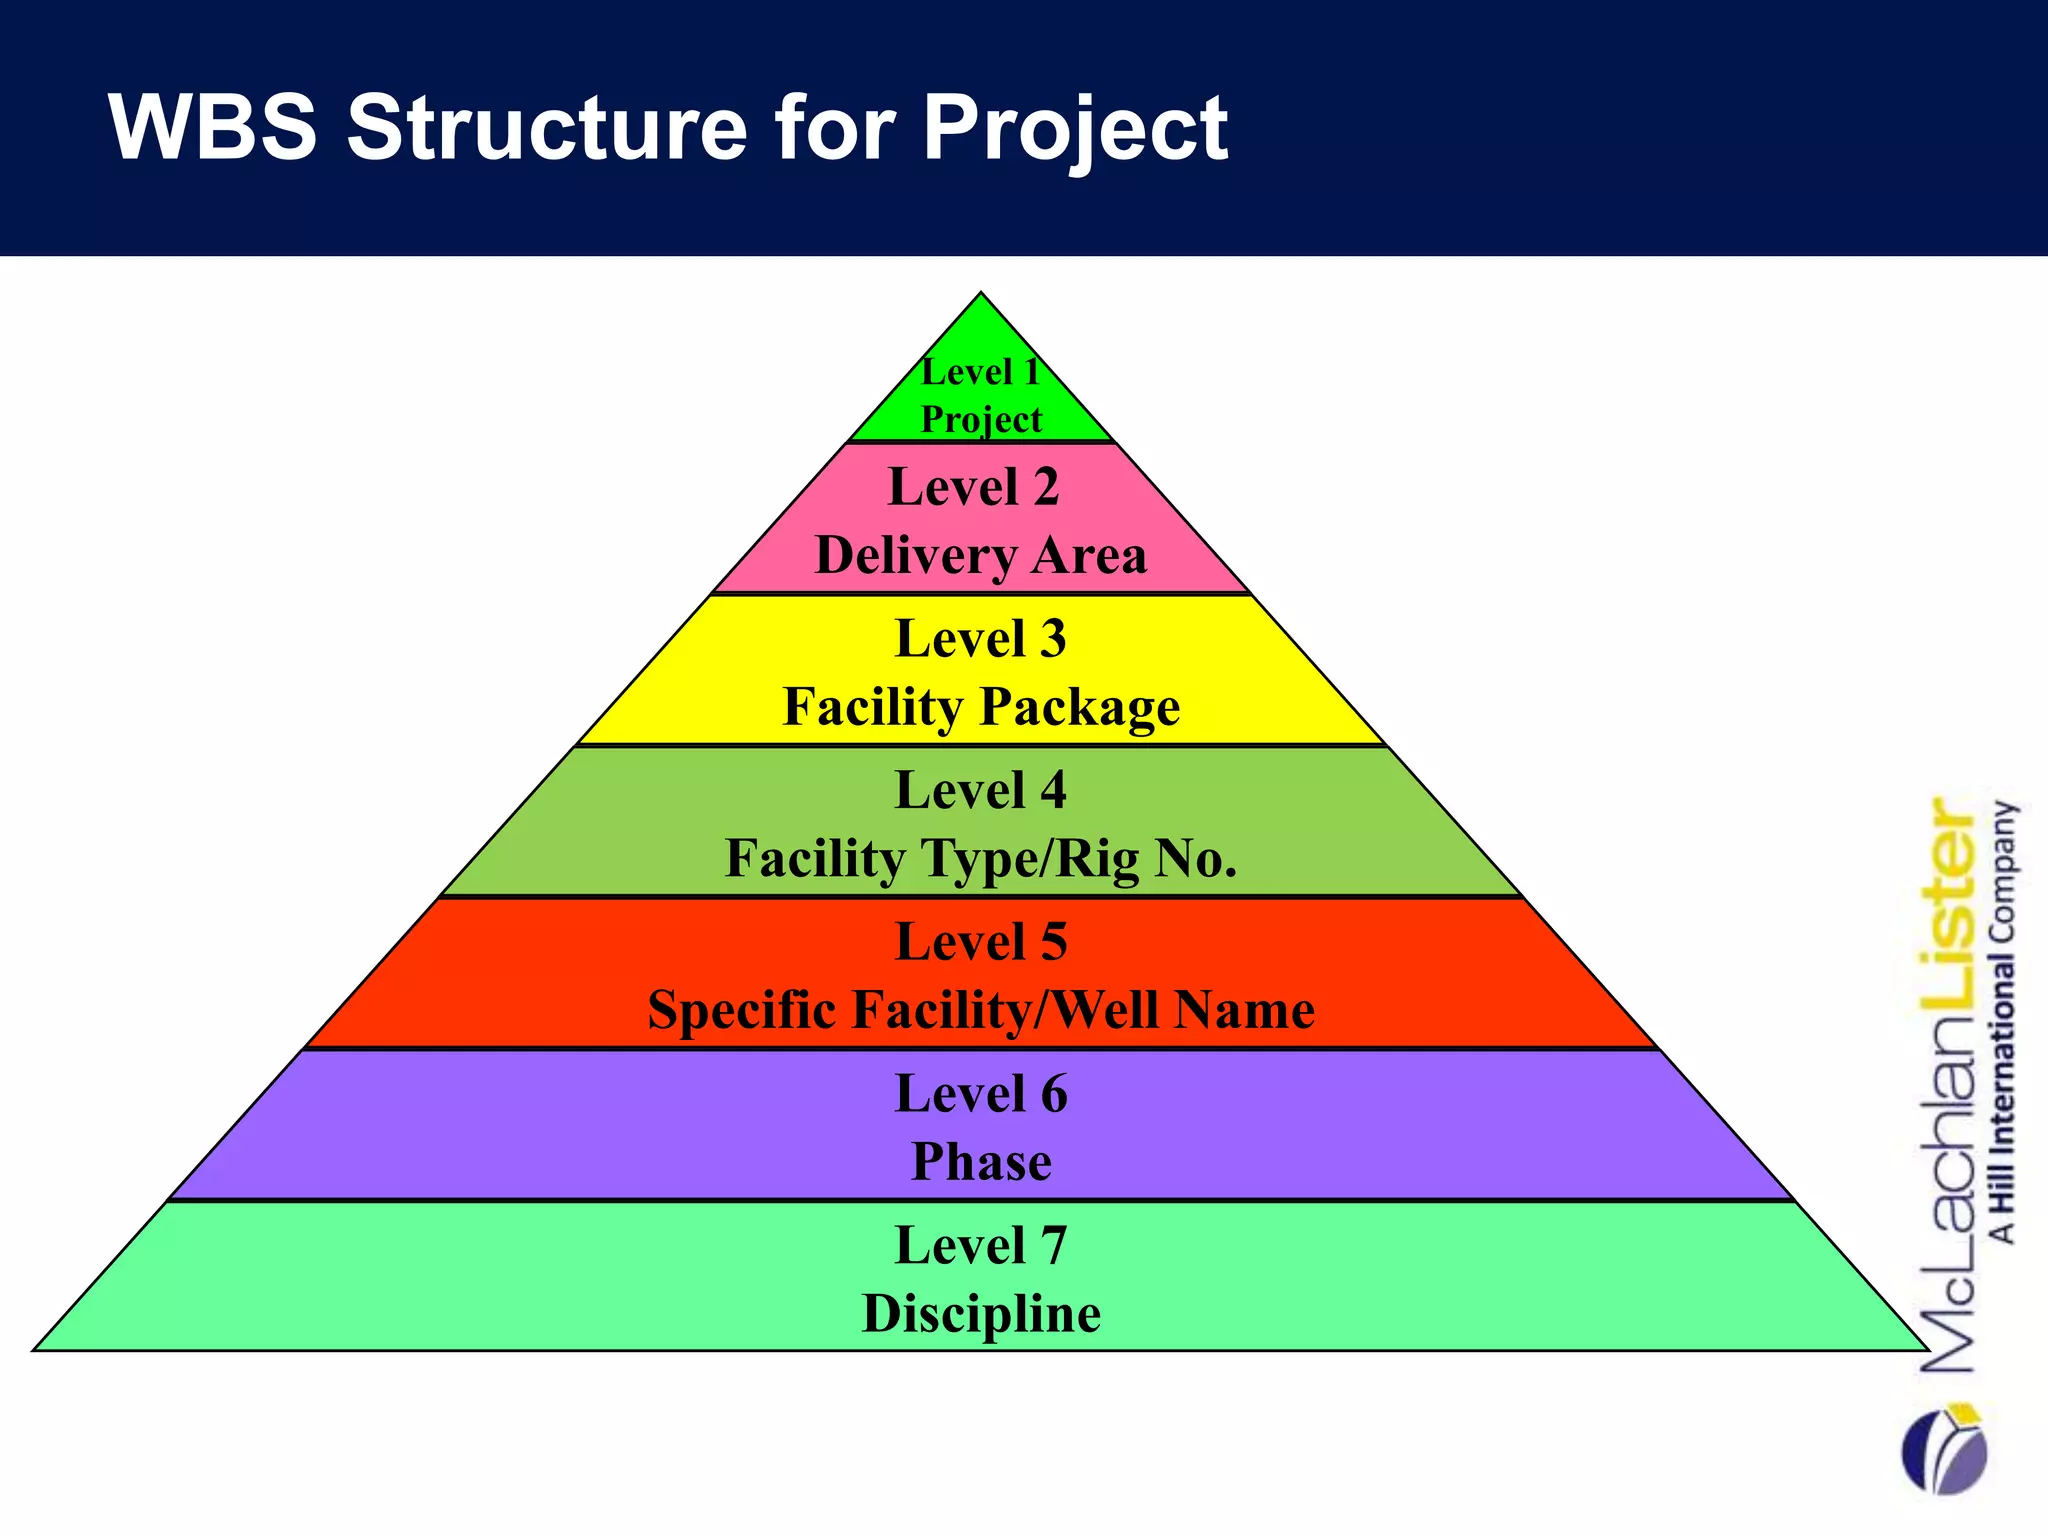
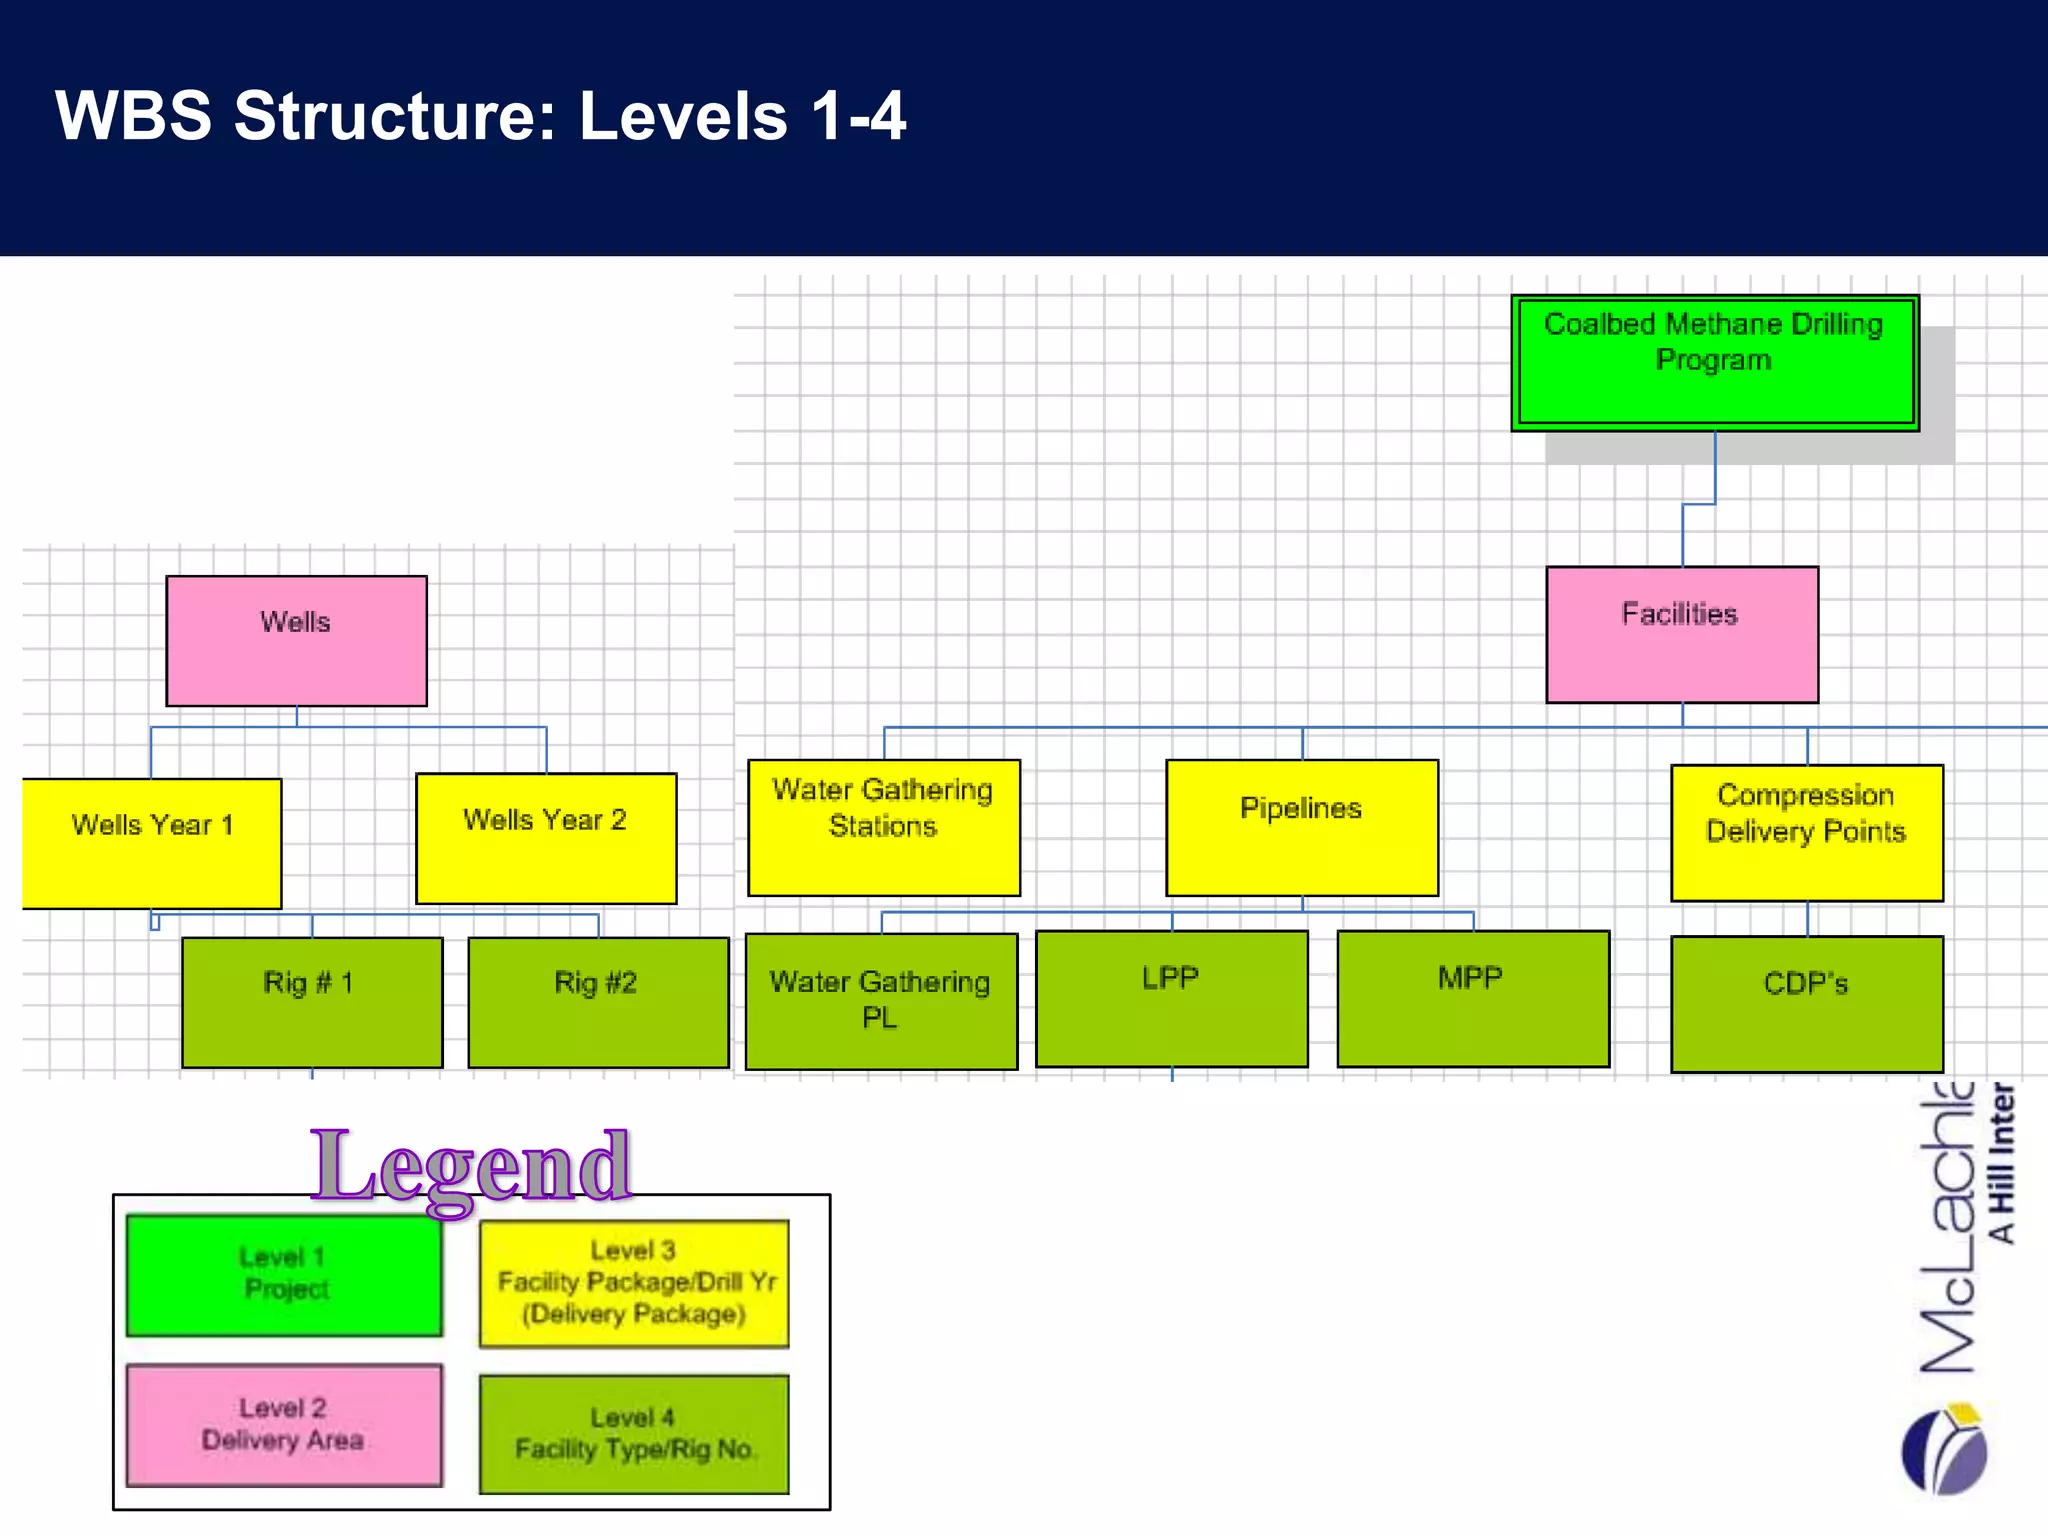
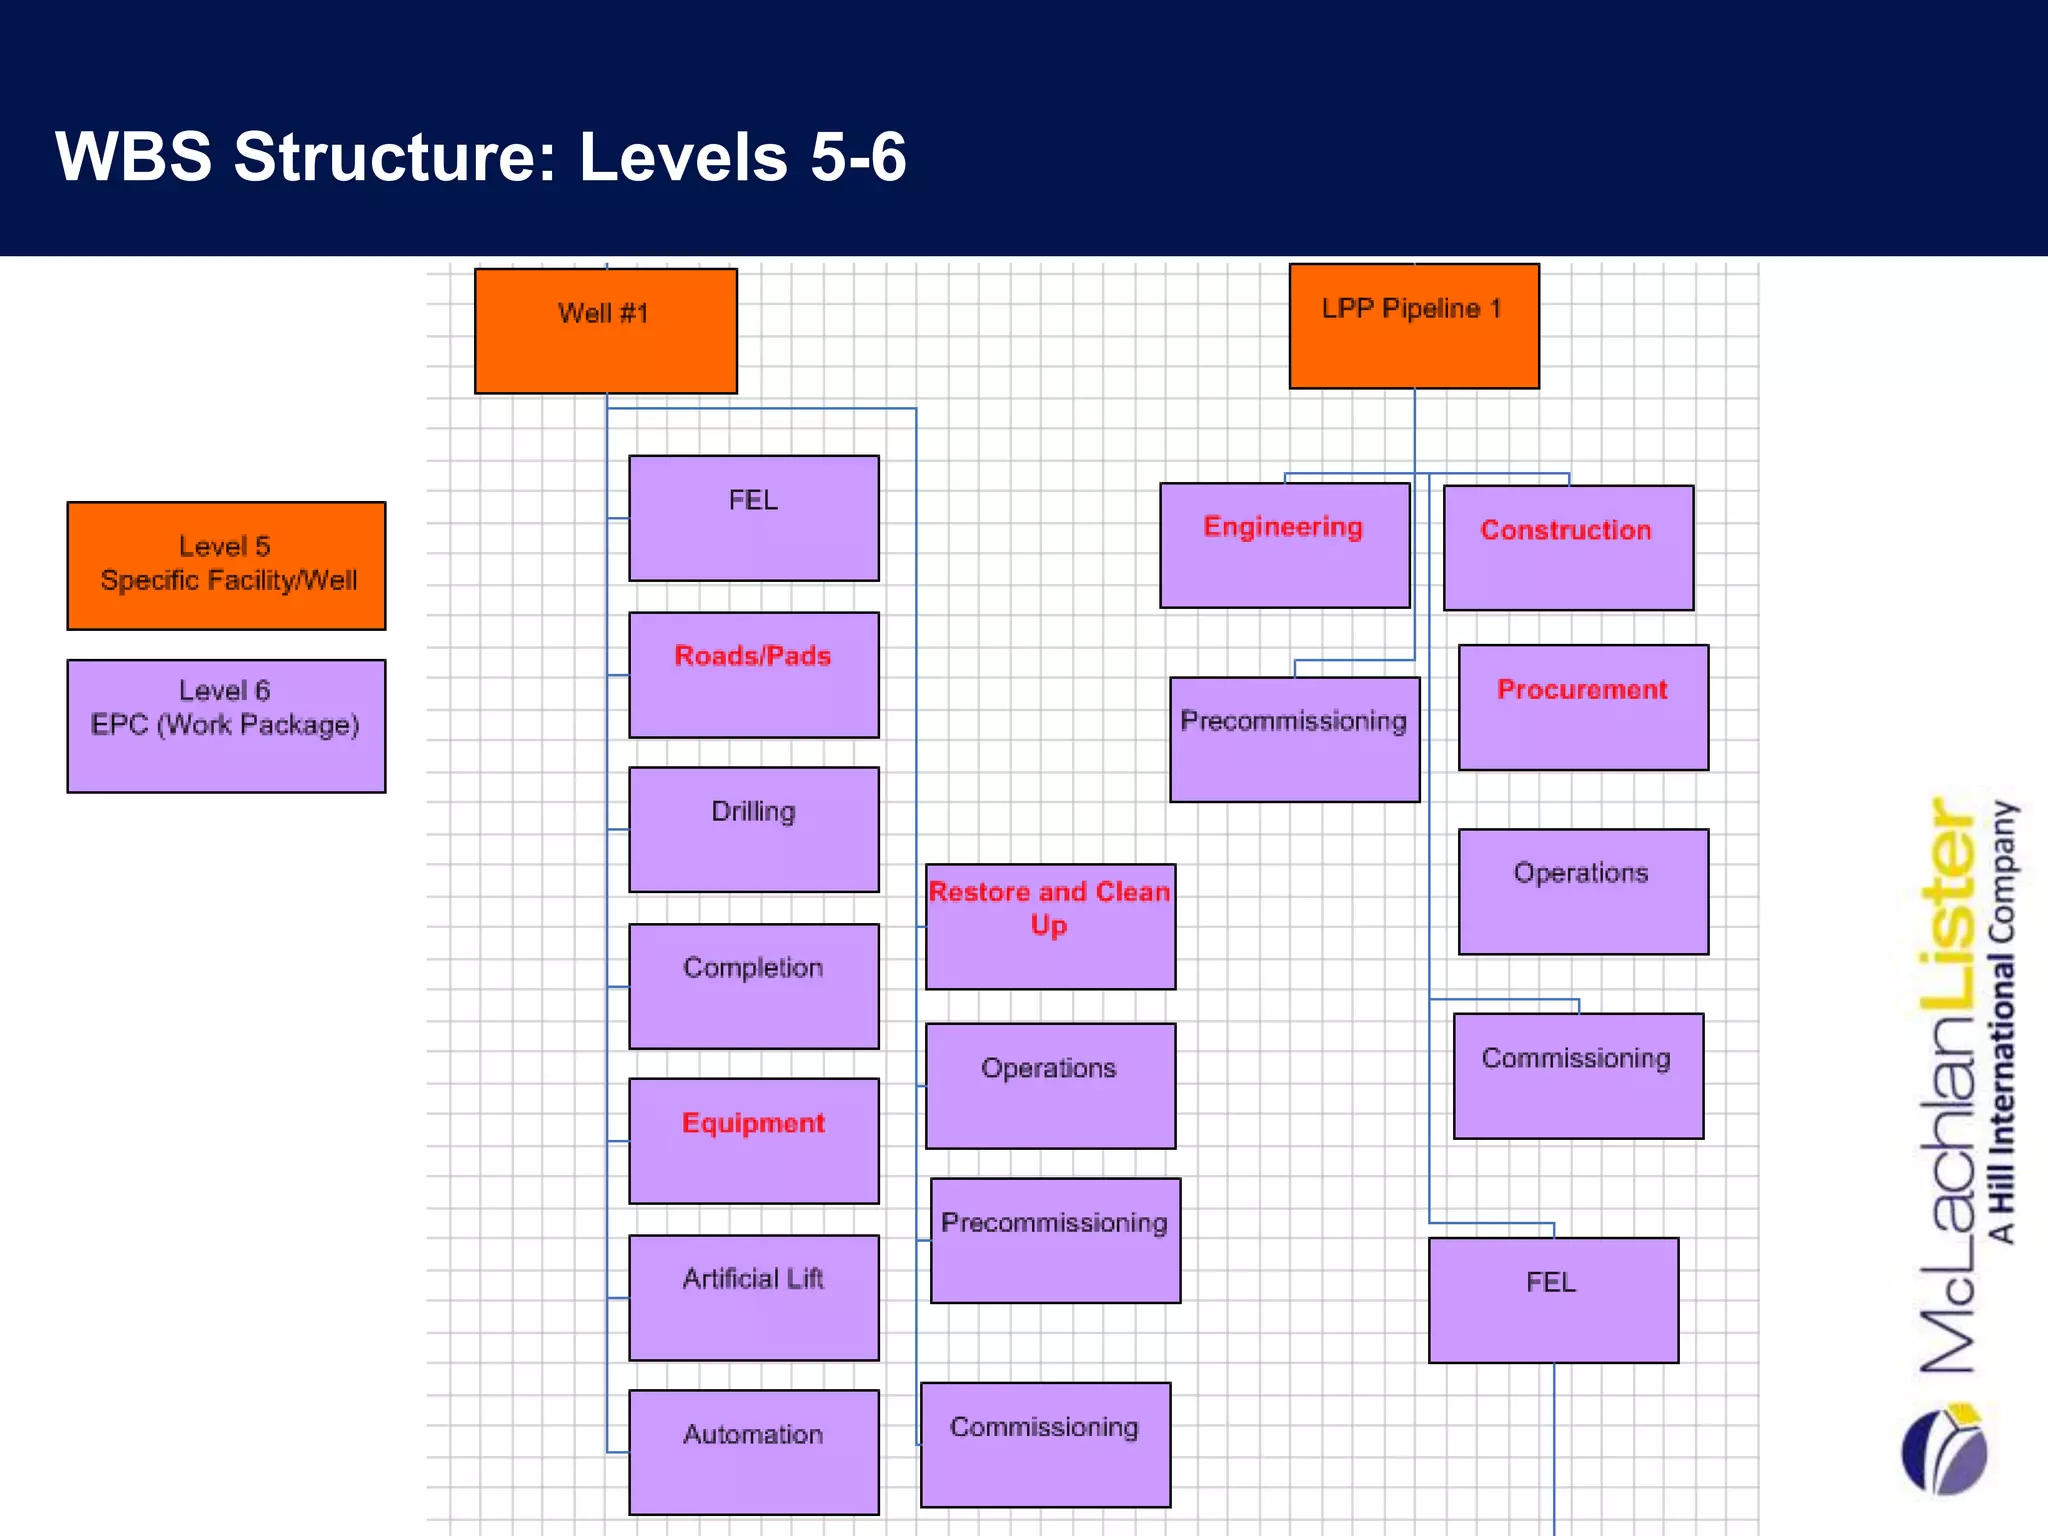
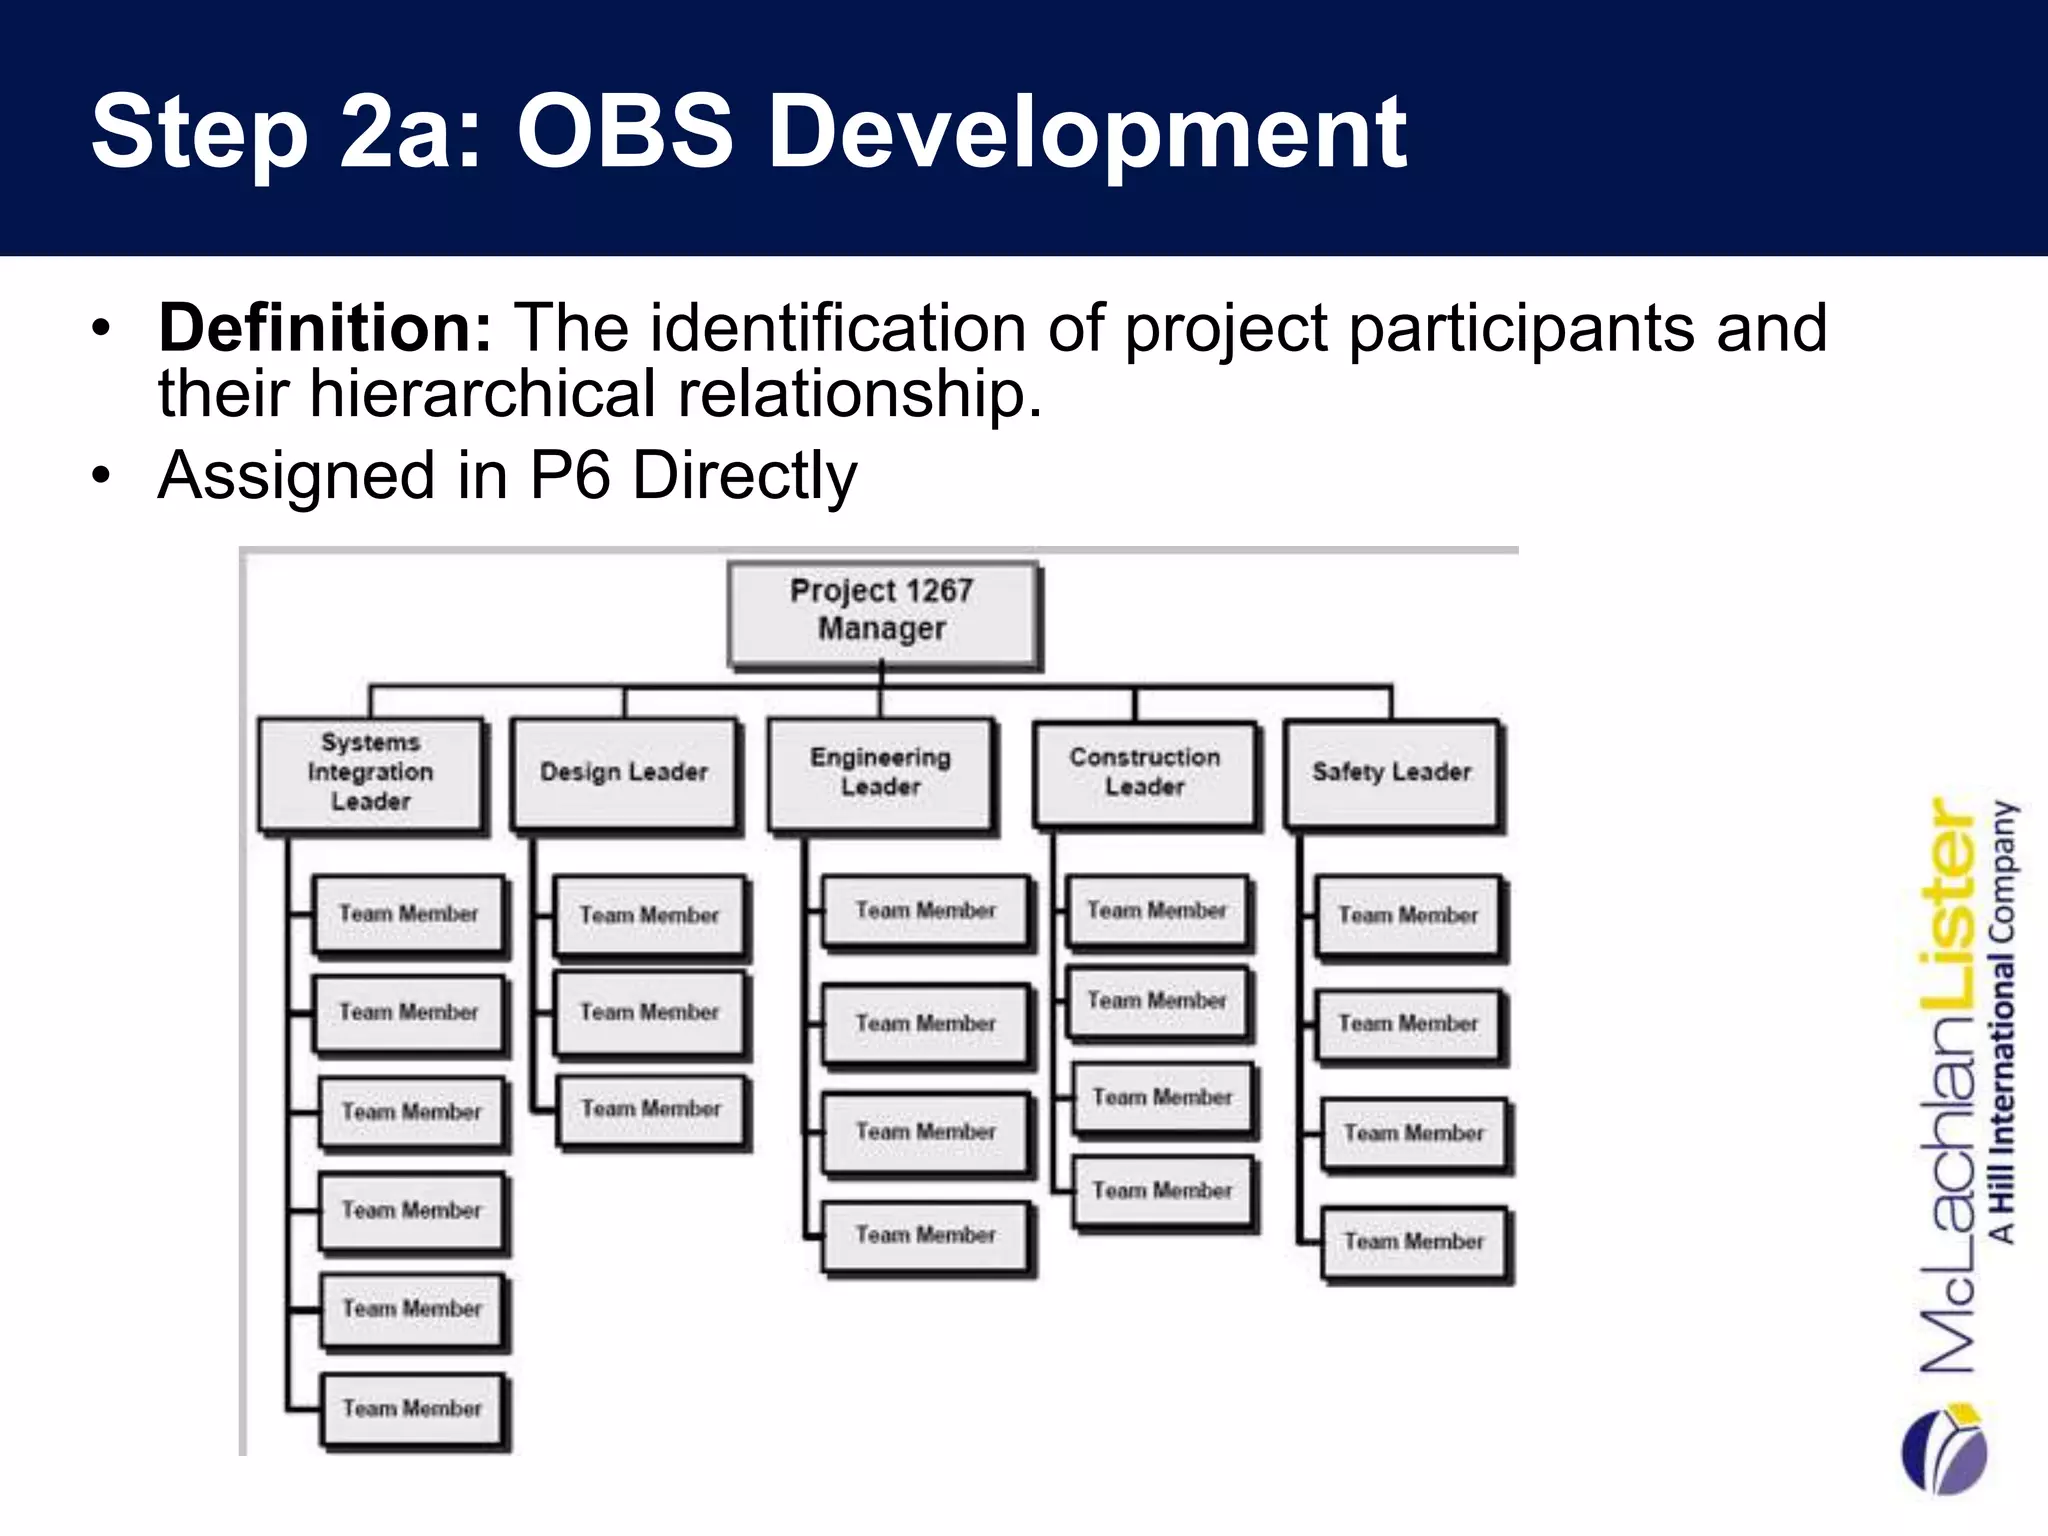
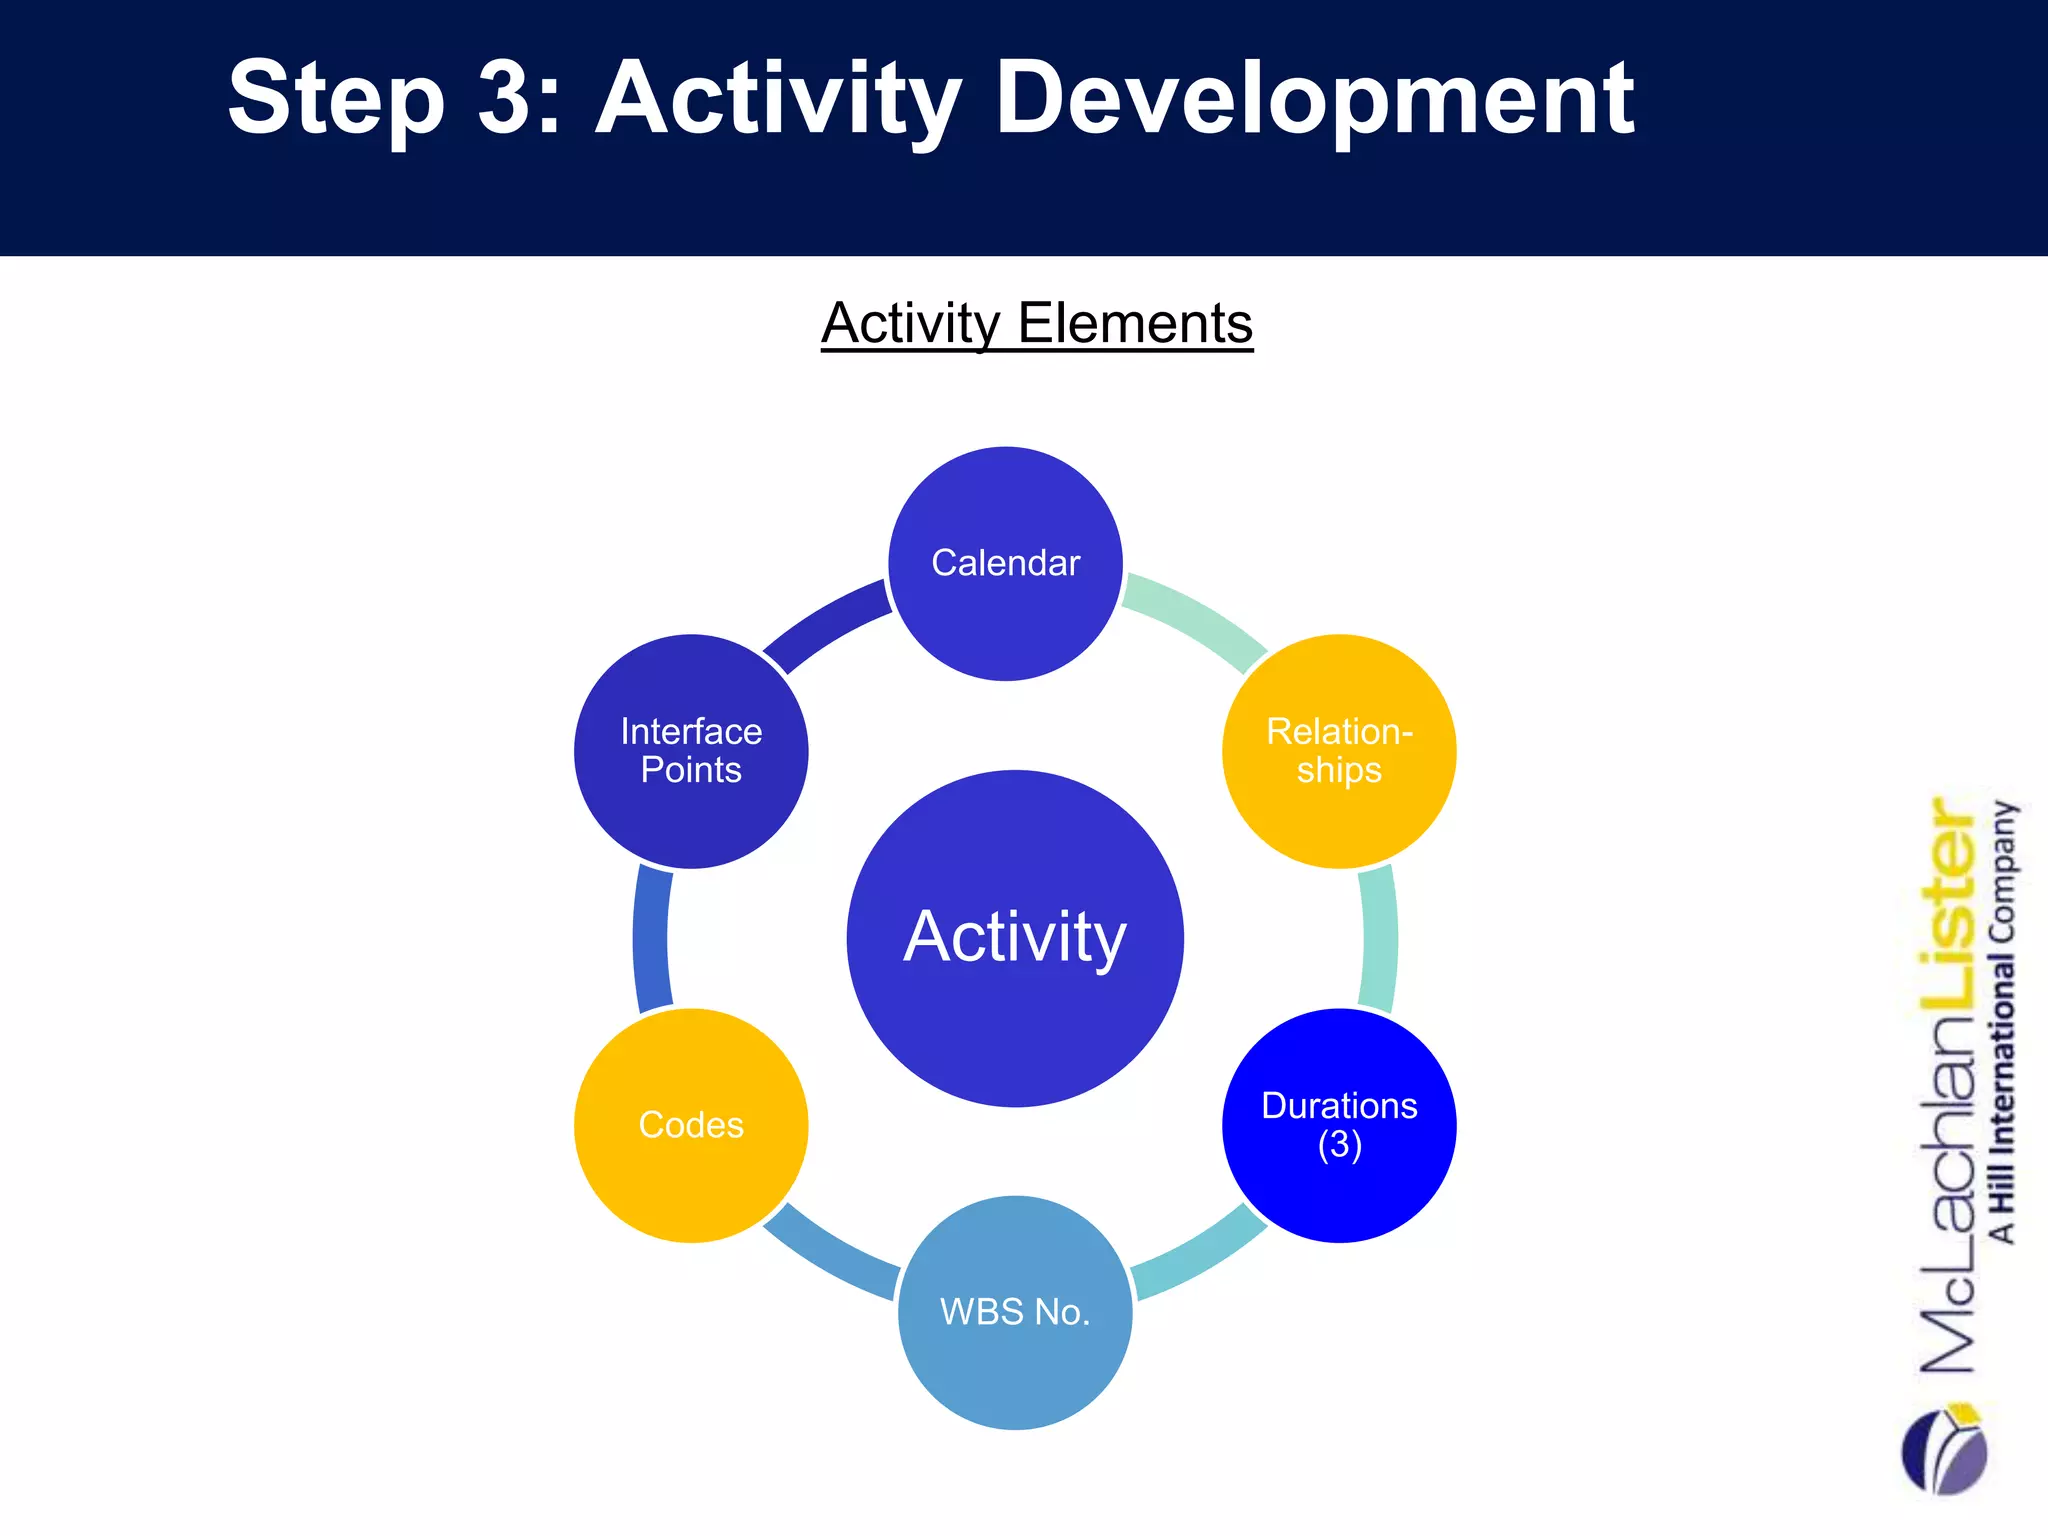
Adopting Effective Project Controls Strategies


      Dr. Anamaria Popescu, PE,PSP,PMP
    McLachlan Lister-Hill International Australia
               www.hillintl.com
My Profile


•   Associate Director-McLL in Brisbane
•   Project Auditing Services
•   Project Controls Implementation
•   Construction Claims Expertise
•   Forensic Schedule Analysis
•   Joined Hill International in 2011
•   Consulting to the Oil and Gas Industry
•   University of Texas at Austin
•   Civil Engineering/CEPM Program
•   PhD in Schedule Analysis
•   PM at Enron
A Good Indication….
     ….that Your Project Controls System was Ineffective!!!
Project Characteristics

•   Coalbed Methane Natural Gas Drilling Program
•   Gas Field: 1.9 Trillion Cubic Feet of Gas
•   13 Year Period
•   1000 Wells
•   2+ Billion Investment ($US)
•   Environmental Sensitive Area
•   Minimize Environmental Impact
•   Use Existing Infrastructure
Situation


• Project in Feasibility Phase
• No Project Controls People
• No Cost Control or
  Schedule Existed
• Wanted a Schedule to
  “Pass Through” Gate
  Review
• Wanted it in Two Weeks
• Did Not Have a Software
  Platform
• “Power Point” as the
  Panacea
• Huge Political Pressures
  for Success
Our Scope…to Develop:

•   A standard WBS for the project
•   An Integrated Schedule
•   Re-Alignment of Cost Estimate with WBS
•   Risk Allocation/Contingency Management
•   Earned Value System
•   The basis for the cost and schedule baseline
Step 1: Work Breakdown Structure Development

 FIRST THINGS FIRST…..What is a WBS
 Anyway?

 • Grouping of Project Elements
 • Defines the Total Scope of Work
 • Each Level More Detailed than Previous

                               .
WBS Development Benefits

•   Scope Capture Check
•   Promotes Consistency of Cost and Schedule Data
•   Rollup for Reporting Requirements
•   Cost Breakdown Structure Framework
•   Earned Value is Actually Possible!


         $       $       $
WBS Development: What We Did…

•   Got a Plotter (A BIG One!)
•   Became Visio Experts
•   Had One-on-One Meetings…Lots of Them!
•   WBS Wallpaper
•   Captive Audience
•   Comment Period of One Week
•   Graffiti Allowed!
•   Custom Pen Colors!
•   True Integration Effort
•   Transparency in SOW
•   “Light Bulbs” Went Off
•    Made Changes…Replotted…Rehung
•   Not Very “Green” but Very Vital
WBS Requirements & Questions for Consideration

 •    Number of levels in the WBS
 •    Define Each Level
 •    Schedule Activities Captured at Level X
 •    Costs Captured at Level X
 •    Numbering Structure: Alpha/Numeric


     Critical that the Team “Buys-In” and “Owns” the WBS
WBS Structure for Project

                       Level 1
                       Project
                      Level 2
                   Delivery Area
                       Level 3
                 Facility Package
                       Level 4
               Facility Type/Rig No.
                       Level 5
            Specific Facility/Well Name
                       Level 6
                       Phase
                       Level 7
                     Discipline
WBS Structure: Levels 1-4
WBS Structure: Levels 5-6
Step 2a: OBS Development
• Definition: The identification of project participants and
  their hierarchical relationship.
• Assigned in P6 Directly
Step 2b: OBS Assignment
• Intersection of OBS and WBS Creates:
Step 3: Activity Development

                   Activity Elements


                       Calendar


       Interface                       Relation-
        Points                          ships


                      Activity

                                       Durations
        Codes
                                          (3)


                       WBS No.
Activity Development: What We Did….

•   Set Up Excel Templates        •   3 Durations
•   Emailed to Team Leads         •   Import into P6
•   One Tab per WBS Element       •   “Live” Logic Ties
•   Team Brainstorming Sessions   •   Schedule Projected on
•   No Dates!                         Screen
Activity Development: Standardization of Well
   Activities
Well No. 1


                                                   18
Step 4: Schedule Integrity Check

• Assess through
  Metrics
• Don’t Skip!
• CP should not be
  published
• P6 Schedule
  Report or Fuse
Step 5: Critical Path Review
•   Plotted Out both CP and NCP
•   Grouped by Top 10 Float Paths (Top 10 Wells)
•   Graphically Could See the Critical Path
•   Took Up Four Walls of Conference Room- “BAG”
•   Each Team Had a Different Colored Pen
•   Marked Up and Changed Logic Ties
•   Had Collaborative Discussions about Sequencing
•   Made Changes “Live” in P6
•   Re-plotted Top 3 Paths
•   Management Accepted “The Answer”
•   Not Thrilled but Convinced!
Step 5: Critical Path Review
• Achievable project completion date set!
• Avoided……….
Step 6: Incorporating Risk into the Schedule

  •     Interactive workshop with various disciplines to
        come up with the risks.
  •     Develop a Risk Register
  •     Risk Matrix- Likelihood of Occurrence vs. Impact
  •     Running a risk analysis on the baseline
        schedule in Pertmaster
  •     Probability of achieving expected completion
        date
  •     Schedule Contingency Management-Buffers
Step 6: Incorporating Risk into the Schedule


                   Risk Register
                 Mitigation Strategies
Step 6: Incorporating Risk into the Schedule
Likelihood of Occurrence


                           Risk Assessment Matrix
Step 6: Incorporating Risk into the Schedule


             Forecasted Project Duration
                  with Probability
Step 6: Incorporating Risk into the
Cost Estimate
Forecasted
Project Total
    Cost
     by
 Probability
Step 6: Cost and Schedule Sensitivity Index


  Pareto Principle :
    80% of Risks
   Originate from
 20% of the Activities
Step 6: Cost and Schedule Sensitivity Index
                                                      Cost Sensitivity


  H007 - RR Flagging & Administration                                                            64%


           D001 - Detailed Engineering                                                     44%


            H002 - General Conditions                                                39%


                        H004 - Inflation                                         38%


               H006 - CA&I Incidentals                                          37%


              H003 - Overhead & Profit                                         36%


              H001 - Balance of Scope                                    25%


                     D002 - Permitting                          19%


C009 - Electrical Service & Distribution         8%


            C011 - Membrane Roofing        -7%
Step 6: Contingency Management

• CP shows only the early date for project completion.
• The next step will be to determine the late dates for project
  completion
• The project will have two completion dates:
    • a finish date without contingency (the early date)
    • a finish date with contingency (the late date).
• Paradigm shift for most companies-usually mange to only one
  finish date & no contingency


                                                                  30
Step 6: Contingency Boxes

• This step is based on the organizational structure of
  the project and the company.
• The person with authority to distribute a portion of the
  project float needs to be assigned a contingency box.
• These boxes are represented as activities in the
  schedule-tied in series
• The schedule will now have two finish dates:
   • the early target finish date, preceding the contingency
   • the late target finish date that succeeds the boxes.


                                                               31
Step 6: Contingency Boxes (Continued)


              +
              +
                     +
                           =
                                        32
Step 6: Calculate the Contingency

• Choose the % of Contingency to Allocate based on:
     •  The corporate culture of the company.
     •  How much risk the leadership team is willing to take.
     •  Risk management plan
     •  Monte Carlo Simulation (PERT) of the baseline schedule using the
        three durations
     • Pert Master ©
     • “What-If” Scenarios using all 3 durations
     • Benchmark Data
     • “Cutting Edge Technology” vs. “Tried and True” Projects
     • Length of Project
     • Phase of Project
   Calculate contingency duration based on Total Duration of Longest
    Path x %
     – From Start Milestone to Early Finish Date of Project
                                                                       33
Step 6: Percentage Allocation

• Distribute the contingency to each box based on the
  amount of authority the three team leaders have on
  the project.
• Percentage distributed to each box.
• DOES NOT HAVE TO BE EQUALLY
  APPORTIONED.
• Formal Float Distribution Process-Float is not
  “Scattered” throughout


                                                        34
Step 6: Percentage Allocation

                                15% Contingency
                                Total Project
                                 Duration=300 Days
                                Contingency:45 Days


                                      PM: 60%
                                     PGM: 30%
                                      PD: 10%


                                  “Drop Dead Date”
                                           35
Output: Integrated Baseline Schedule
Output: Overall Program Critical Path Drilling
Sequence


                                                 37
Step 7: Schedule Basis
•   Baseline AFTER critical path acceptance
•   Key step that is overlooked
•   Assumptions/Key decisions recorded
•   Provides validity to the schedule itself
•   Provides an understanding of team’s thought process
•   Allows team members to resist scrutiny/criticism
•   Basis for change management
•   Excusable Delay: Conditions Different than Assumptions
Step 8: Integrating Cost and Schedule: Earned
Value
Integrating Cost and Schedule: Earned Value
Value
•   Standardization of activities
•   Great Communication Tool: Everyone Spoke the Same Language
•   Integrated Software Platform: Primavera Enterprise
•   Schedule allowed for realistic and accurate well count by year
•   Contractor Payments-Virtually Eliminated Disputes
•   No management surprises!!!
•   Benchmarking – Setting standards for other drilling programs
•   Record actual times and adjusted future projections accordingly
•   Accuracy increased year by year
Conclusions

• Understand what the Client Needs vs.Wants (two very different
  things in this case)
• Don’t expect them to know terminology and benefits…educate
  them (Project Controls 101 Class)
• Hands-On Development of Project Schedule (face-time is key)
• Print out items for discussion and hunt people down….no passive
  emails..if you are an introvert, get over it! (also a six foot long
  schedule is hard to read on a screen)
• Let the teams mark stuff up, nothing is set in stone!!!!
• Have many integration meetings…live in a conference room, I
  did…
• Schedule Review Meetings should have strict time
  management…no more than 1 hour at a time…you will lose people
  and they never will come back! Respect their time and they will
  respect yours…..
Conclusions

• Have the team explain their scope and process on a “generic”
  project first
• Get them thinking Logic not Dates… they can’t cheat the schedule
  that way
• Set up different report templates to match their needs so they will
  actually use it….what a concept!
• Allow suppliers, engineering firms, etc. to attend the progress
  meetings and comment on the schedule… don’t worry about the
  contractual hierarchy
• Have a transition plan and implement it before you leave
• Momentum is Key….
•                             ….losing it can derail all of your efforts
Questions ?
Contact Information

               Dr.Anamaria Popescu, PE,PMP,PSP
                          Brisbane Office
                       2/19 Musgrave Street
                       West End, QLD, 4101
              Email: anamariap@mclachlanlister.com
                     Phone: 61 07 3255 0223


       Sydney Office                       Perth Office
  Level 1, 1 Hickson Road                189 Colin Place
  Phone: 61 02 9241 7328              Phone: 61 08 9480 0647

Modular Construction Conference 2012

  • 1.
    Adopting Effective ProjectControls Strategies Dr. Anamaria Popescu, PE,PSP,PMP McLachlan Lister-Hill International Australia www.hillintl.com
  • 2.
    My Profile • Associate Director-McLL in Brisbane • Project Auditing Services • Project Controls Implementation • Construction Claims Expertise • Forensic Schedule Analysis • Joined Hill International in 2011 • Consulting to the Oil and Gas Industry • University of Texas at Austin • Civil Engineering/CEPM Program • PhD in Schedule Analysis • PM at Enron
  • 3.
    A Good Indication…. ….that Your Project Controls System was Ineffective!!!
  • 4.
    Project Characteristics • Coalbed Methane Natural Gas Drilling Program • Gas Field: 1.9 Trillion Cubic Feet of Gas • 13 Year Period • 1000 Wells • 2+ Billion Investment ($US) • Environmental Sensitive Area • Minimize Environmental Impact • Use Existing Infrastructure
  • 5.
    Situation • Project inFeasibility Phase • No Project Controls People • No Cost Control or Schedule Existed • Wanted a Schedule to “Pass Through” Gate Review • Wanted it in Two Weeks • Did Not Have a Software Platform • “Power Point” as the Panacea • Huge Political Pressures for Success
  • 6.
    Our Scope…to Develop: • A standard WBS for the project • An Integrated Schedule • Re-Alignment of Cost Estimate with WBS • Risk Allocation/Contingency Management • Earned Value System • The basis for the cost and schedule baseline
  • 7.
    Step 1: WorkBreakdown Structure Development FIRST THINGS FIRST…..What is a WBS Anyway? • Grouping of Project Elements • Defines the Total Scope of Work • Each Level More Detailed than Previous .
  • 8.
    WBS Development Benefits • Scope Capture Check • Promotes Consistency of Cost and Schedule Data • Rollup for Reporting Requirements • Cost Breakdown Structure Framework • Earned Value is Actually Possible! $ $ $
  • 9.
    WBS Development: WhatWe Did… • Got a Plotter (A BIG One!) • Became Visio Experts • Had One-on-One Meetings…Lots of Them! • WBS Wallpaper • Captive Audience • Comment Period of One Week • Graffiti Allowed! • Custom Pen Colors! • True Integration Effort • Transparency in SOW • “Light Bulbs” Went Off • Made Changes…Replotted…Rehung • Not Very “Green” but Very Vital
  • 10.
    WBS Requirements &Questions for Consideration • Number of levels in the WBS • Define Each Level • Schedule Activities Captured at Level X • Costs Captured at Level X • Numbering Structure: Alpha/Numeric Critical that the Team “Buys-In” and “Owns” the WBS
  • 11.
    WBS Structure forProject Level 1 Project Level 2 Delivery Area Level 3 Facility Package Level 4 Facility Type/Rig No. Level 5 Specific Facility/Well Name Level 6 Phase Level 7 Discipline
  • 12.
  • 13.
  • 14.
    Step 2a: OBSDevelopment • Definition: The identification of project participants and their hierarchical relationship. • Assigned in P6 Directly
  • 15.
    Step 2b: OBSAssignment • Intersection of OBS and WBS Creates:
  • 16.
    Step 3: ActivityDevelopment Activity Elements Calendar Interface Relation- Points ships Activity Durations Codes (3) WBS No.
  • 17.
    Activity Development: WhatWe Did…. • Set Up Excel Templates • 3 Durations • Emailed to Team Leads • Import into P6 • One Tab per WBS Element • “Live” Logic Ties • Team Brainstorming Sessions • Schedule Projected on • No Dates! Screen
  • 18.
    Activity Development: Standardizationof Well Activities Well No. 1 18
  • 19.
    Step 4: ScheduleIntegrity Check • Assess through Metrics • Don’t Skip! • CP should not be published • P6 Schedule Report or Fuse
  • 20.
    Step 5: CriticalPath Review • Plotted Out both CP and NCP • Grouped by Top 10 Float Paths (Top 10 Wells) • Graphically Could See the Critical Path • Took Up Four Walls of Conference Room- “BAG” • Each Team Had a Different Colored Pen • Marked Up and Changed Logic Ties • Had Collaborative Discussions about Sequencing • Made Changes “Live” in P6 • Re-plotted Top 3 Paths • Management Accepted “The Answer” • Not Thrilled but Convinced!
  • 21.
    Step 5: CriticalPath Review • Achievable project completion date set! • Avoided……….
  • 22.
    Step 6: IncorporatingRisk into the Schedule • Interactive workshop with various disciplines to come up with the risks. • Develop a Risk Register • Risk Matrix- Likelihood of Occurrence vs. Impact • Running a risk analysis on the baseline schedule in Pertmaster • Probability of achieving expected completion date • Schedule Contingency Management-Buffers
  • 23.
    Step 6: IncorporatingRisk into the Schedule Risk Register Mitigation Strategies
  • 24.
    Step 6: IncorporatingRisk into the Schedule Likelihood of Occurrence Risk Assessment Matrix
  • 25.
    Step 6: IncorporatingRisk into the Schedule
  • 26.
    Step 6: IncorporatingRisk into the Schedule Forecasted Project Duration with Probability
  • 27.
    Step 6: IncorporatingRisk into the Cost Estimate Forecasted Project Total Cost by Probability
  • 28.
    Step 6: Costand Schedule Sensitivity Index Pareto Principle : 80% of Risks Originate from 20% of the Activities
  • 29.
    Step 6: Costand Schedule Sensitivity Index Cost Sensitivity H007 - RR Flagging & Administration 64% D001 - Detailed Engineering 44% H002 - General Conditions 39% H004 - Inflation 38% H006 - CA&I Incidentals 37% H003 - Overhead & Profit 36% H001 - Balance of Scope 25% D002 - Permitting 19% C009 - Electrical Service & Distribution 8% C011 - Membrane Roofing -7%
  • 30.
    Step 6: ContingencyManagement • CP shows only the early date for project completion. • The next step will be to determine the late dates for project completion • The project will have two completion dates: • a finish date without contingency (the early date) • a finish date with contingency (the late date). • Paradigm shift for most companies-usually mange to only one finish date & no contingency 30
  • 31.
    Step 6: ContingencyBoxes • This step is based on the organizational structure of the project and the company. • The person with authority to distribute a portion of the project float needs to be assigned a contingency box. • These boxes are represented as activities in the schedule-tied in series • The schedule will now have two finish dates: • the early target finish date, preceding the contingency • the late target finish date that succeeds the boxes. 31
  • 32.
    Step 6: ContingencyBoxes (Continued) + + + = 32
  • 33.
    Step 6: Calculatethe Contingency • Choose the % of Contingency to Allocate based on: • The corporate culture of the company. • How much risk the leadership team is willing to take. • Risk management plan • Monte Carlo Simulation (PERT) of the baseline schedule using the three durations • Pert Master © • “What-If” Scenarios using all 3 durations • Benchmark Data • “Cutting Edge Technology” vs. “Tried and True” Projects • Length of Project • Phase of Project  Calculate contingency duration based on Total Duration of Longest Path x % – From Start Milestone to Early Finish Date of Project 33
  • 34.
    Step 6: PercentageAllocation • Distribute the contingency to each box based on the amount of authority the three team leaders have on the project. • Percentage distributed to each box. • DOES NOT HAVE TO BE EQUALLY APPORTIONED. • Formal Float Distribution Process-Float is not “Scattered” throughout 34
  • 35.
    Step 6: PercentageAllocation 15% Contingency Total Project Duration=300 Days Contingency:45 Days PM: 60% PGM: 30% PD: 10% “Drop Dead Date” 35
  • 36.
  • 37.
    Output: Overall ProgramCritical Path Drilling Sequence 37
  • 38.
    Step 7: ScheduleBasis • Baseline AFTER critical path acceptance • Key step that is overlooked • Assumptions/Key decisions recorded • Provides validity to the schedule itself • Provides an understanding of team’s thought process • Allows team members to resist scrutiny/criticism • Basis for change management • Excusable Delay: Conditions Different than Assumptions
  • 39.
    Step 8: IntegratingCost and Schedule: Earned Value
  • 40.
    Integrating Cost andSchedule: Earned Value
  • 41.
    Value • Standardization of activities • Great Communication Tool: Everyone Spoke the Same Language • Integrated Software Platform: Primavera Enterprise • Schedule allowed for realistic and accurate well count by year • Contractor Payments-Virtually Eliminated Disputes • No management surprises!!! • Benchmarking – Setting standards for other drilling programs • Record actual times and adjusted future projections accordingly • Accuracy increased year by year
  • 42.
    Conclusions • Understand whatthe Client Needs vs.Wants (two very different things in this case) • Don’t expect them to know terminology and benefits…educate them (Project Controls 101 Class) • Hands-On Development of Project Schedule (face-time is key) • Print out items for discussion and hunt people down….no passive emails..if you are an introvert, get over it! (also a six foot long schedule is hard to read on a screen) • Let the teams mark stuff up, nothing is set in stone!!!! • Have many integration meetings…live in a conference room, I did… • Schedule Review Meetings should have strict time management…no more than 1 hour at a time…you will lose people and they never will come back! Respect their time and they will respect yours…..
  • 43.
    Conclusions • Have theteam explain their scope and process on a “generic” project first • Get them thinking Logic not Dates… they can’t cheat the schedule that way • Set up different report templates to match their needs so they will actually use it….what a concept! • Allow suppliers, engineering firms, etc. to attend the progress meetings and comment on the schedule… don’t worry about the contractual hierarchy • Have a transition plan and implement it before you leave • Momentum is Key…. • ….losing it can derail all of your efforts
  • 44.
  • 45.
    Contact Information Dr.Anamaria Popescu, PE,PMP,PSP Brisbane Office 2/19 Musgrave Street West End, QLD, 4101 Email: anamariap@mclachlanlister.com Phone: 61 07 3255 0223 Sydney Office Perth Office Level 1, 1 Hickson Road 189 Colin Place Phone: 61 02 9241 7328 Phone: 61 08 9480 0647