Downloaded 151 times

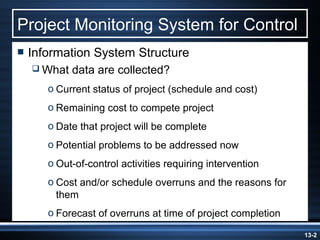
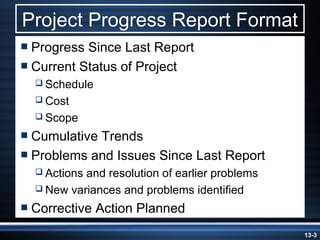
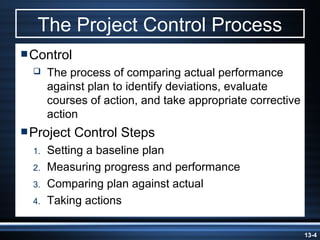
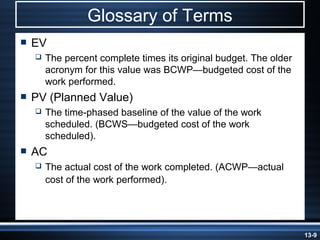
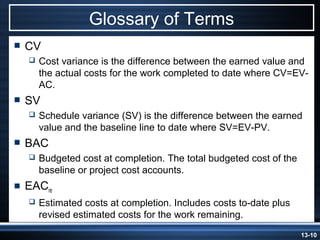
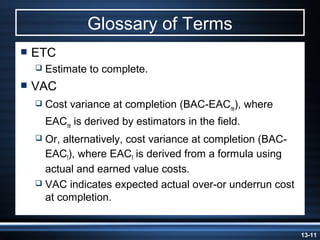
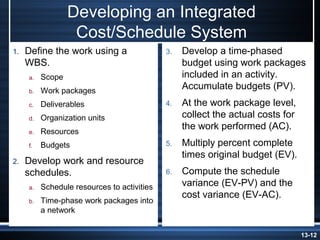
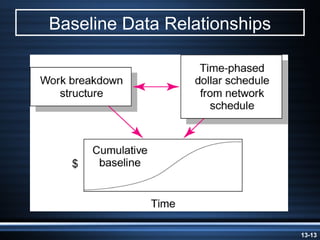
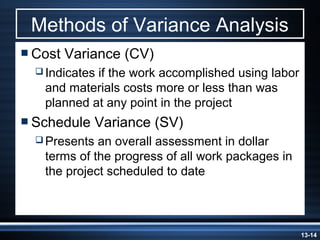
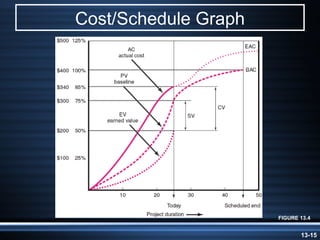
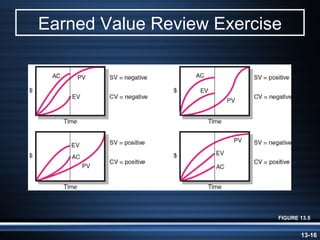
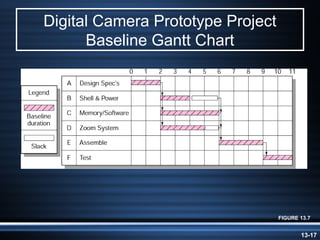
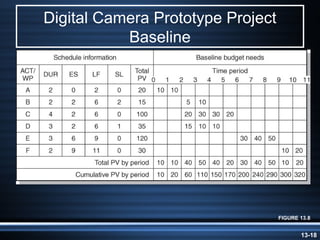
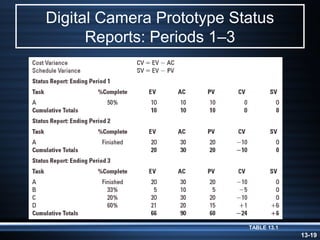
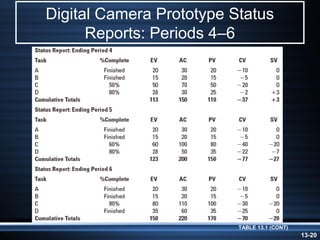
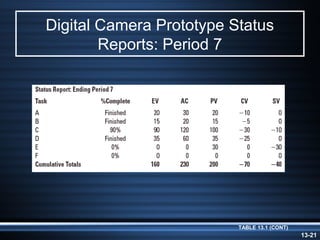

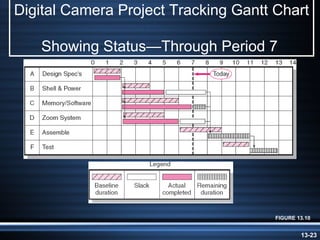
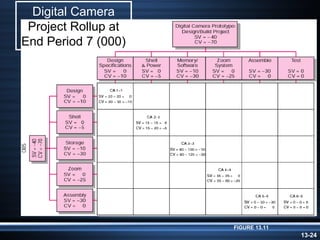
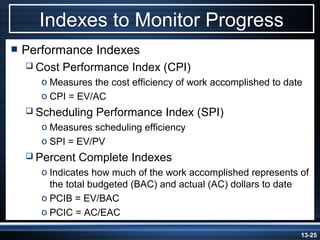
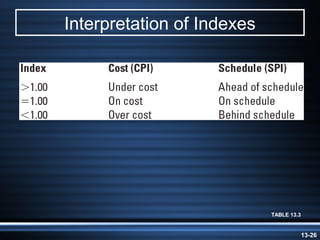
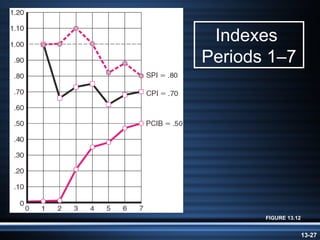
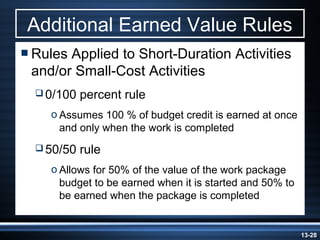
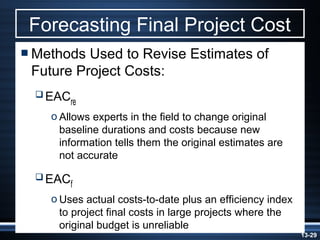
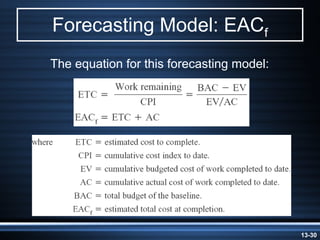
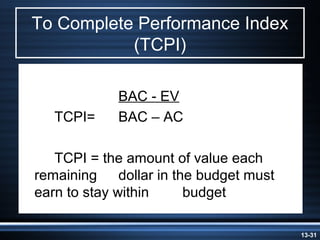

The document summarizes key aspects of project monitoring and control systems. It discusses collecting data on project status, formatting progress reports, the project control process of comparing plans to actuals, and tools for monitoring schedule and cost performance like Gantt charts and control charts. The document also introduces earned value management concepts like planned value, earned value, actual costs, variances, and performance indexes. Formulas are provided for estimating costs at completion based on actual costs and variances.