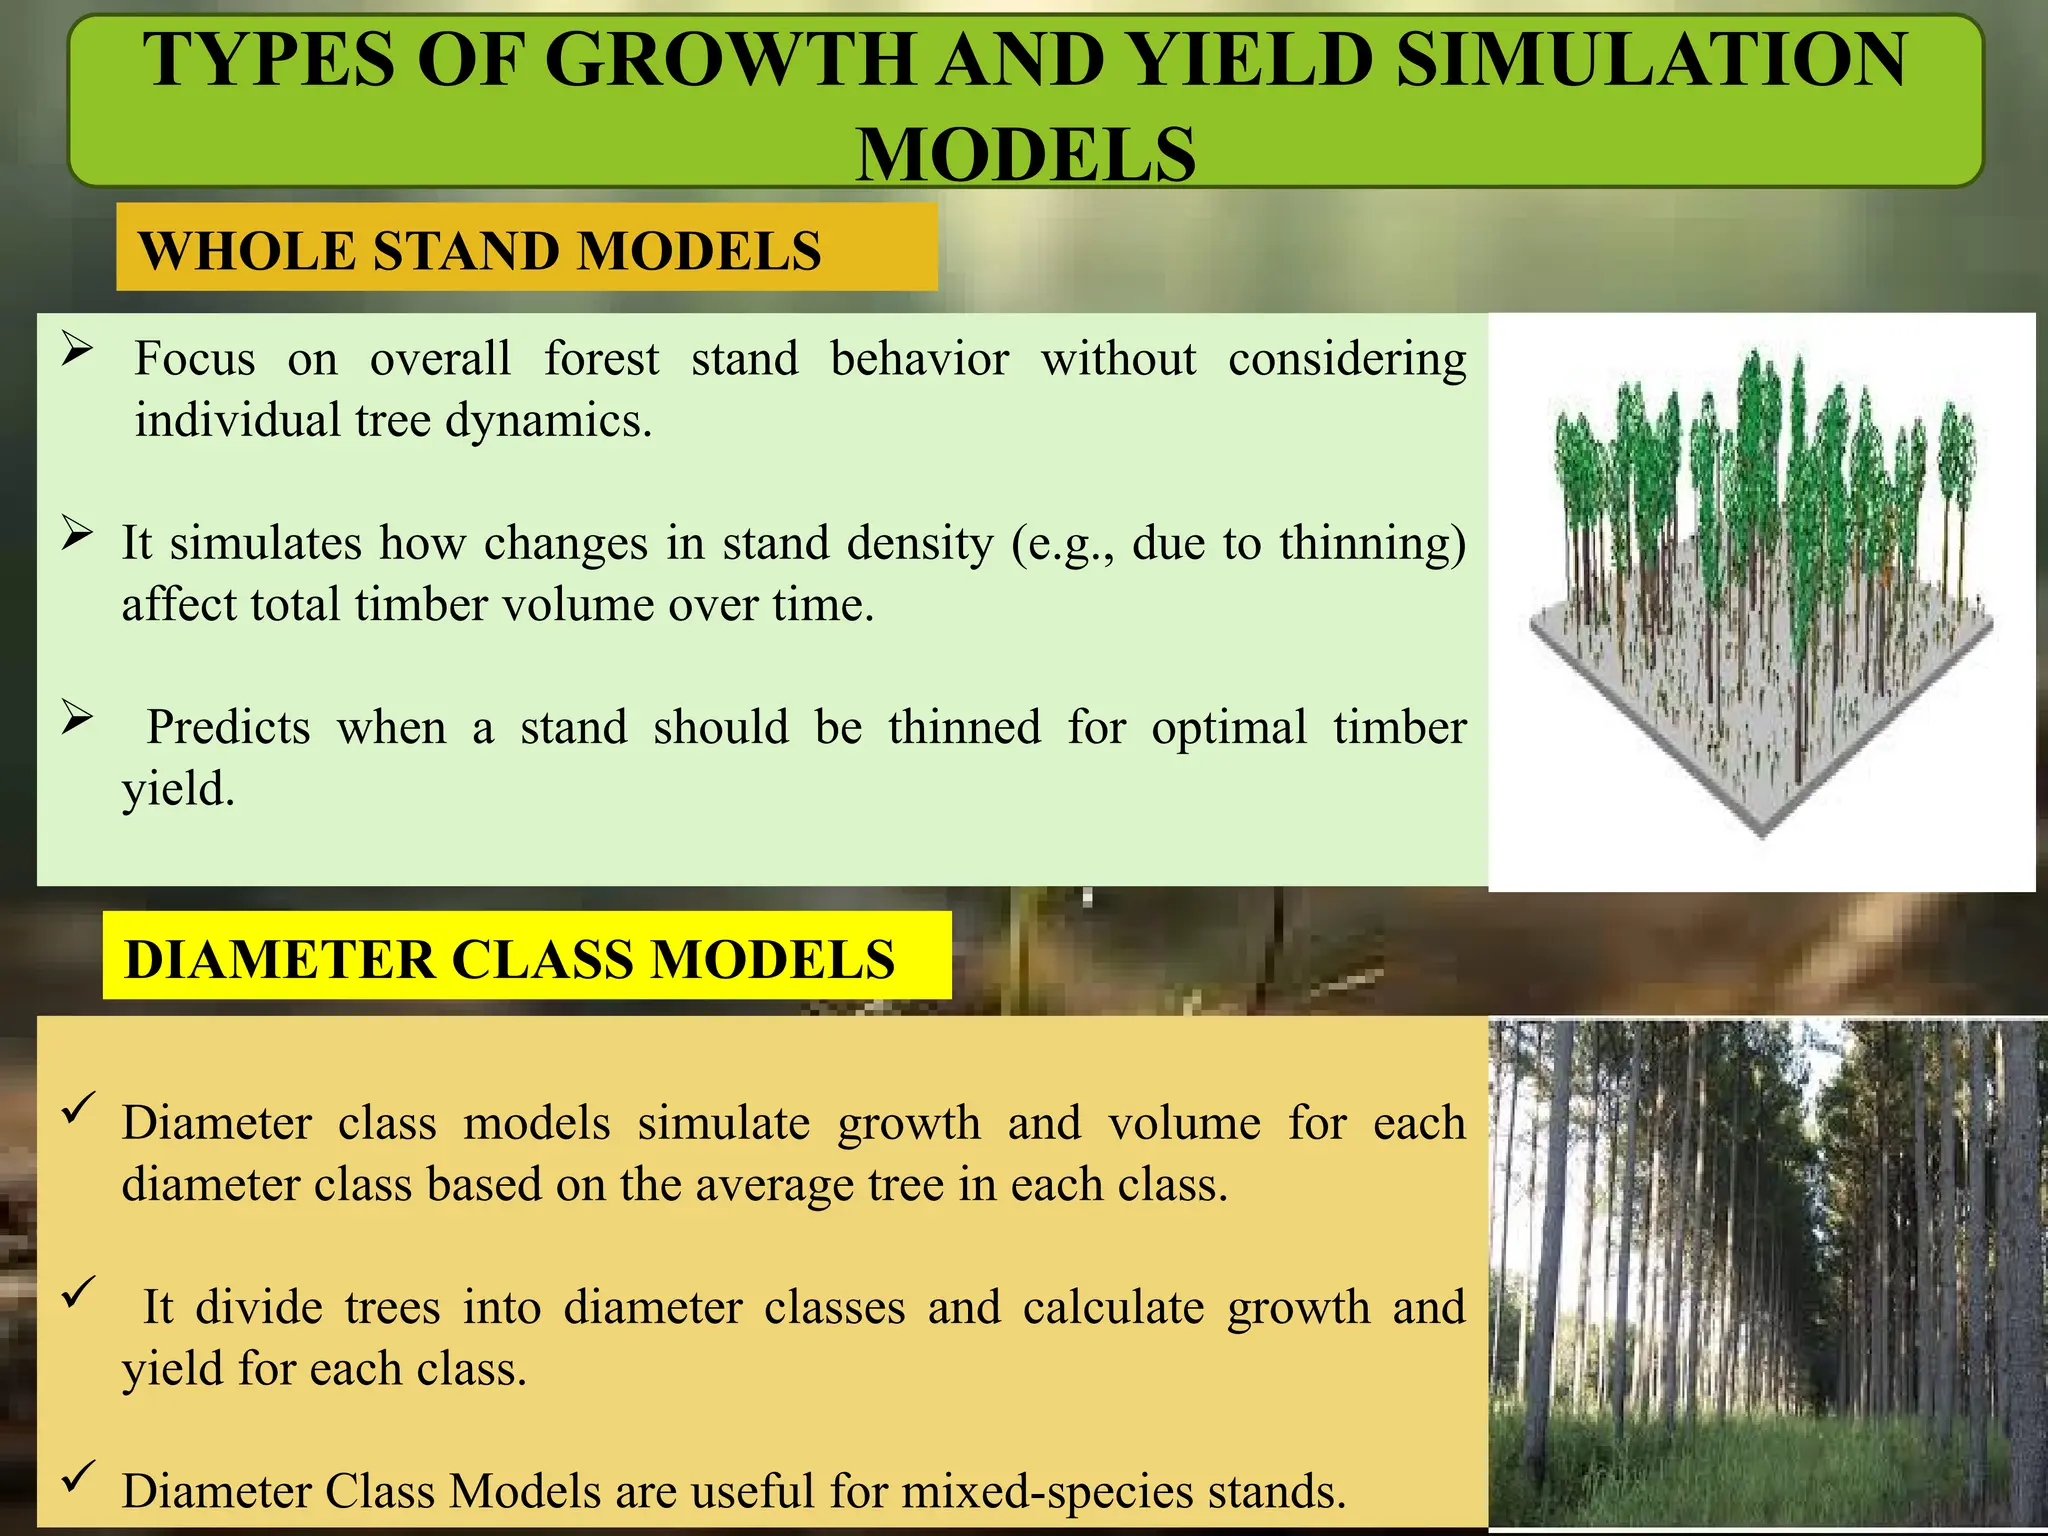
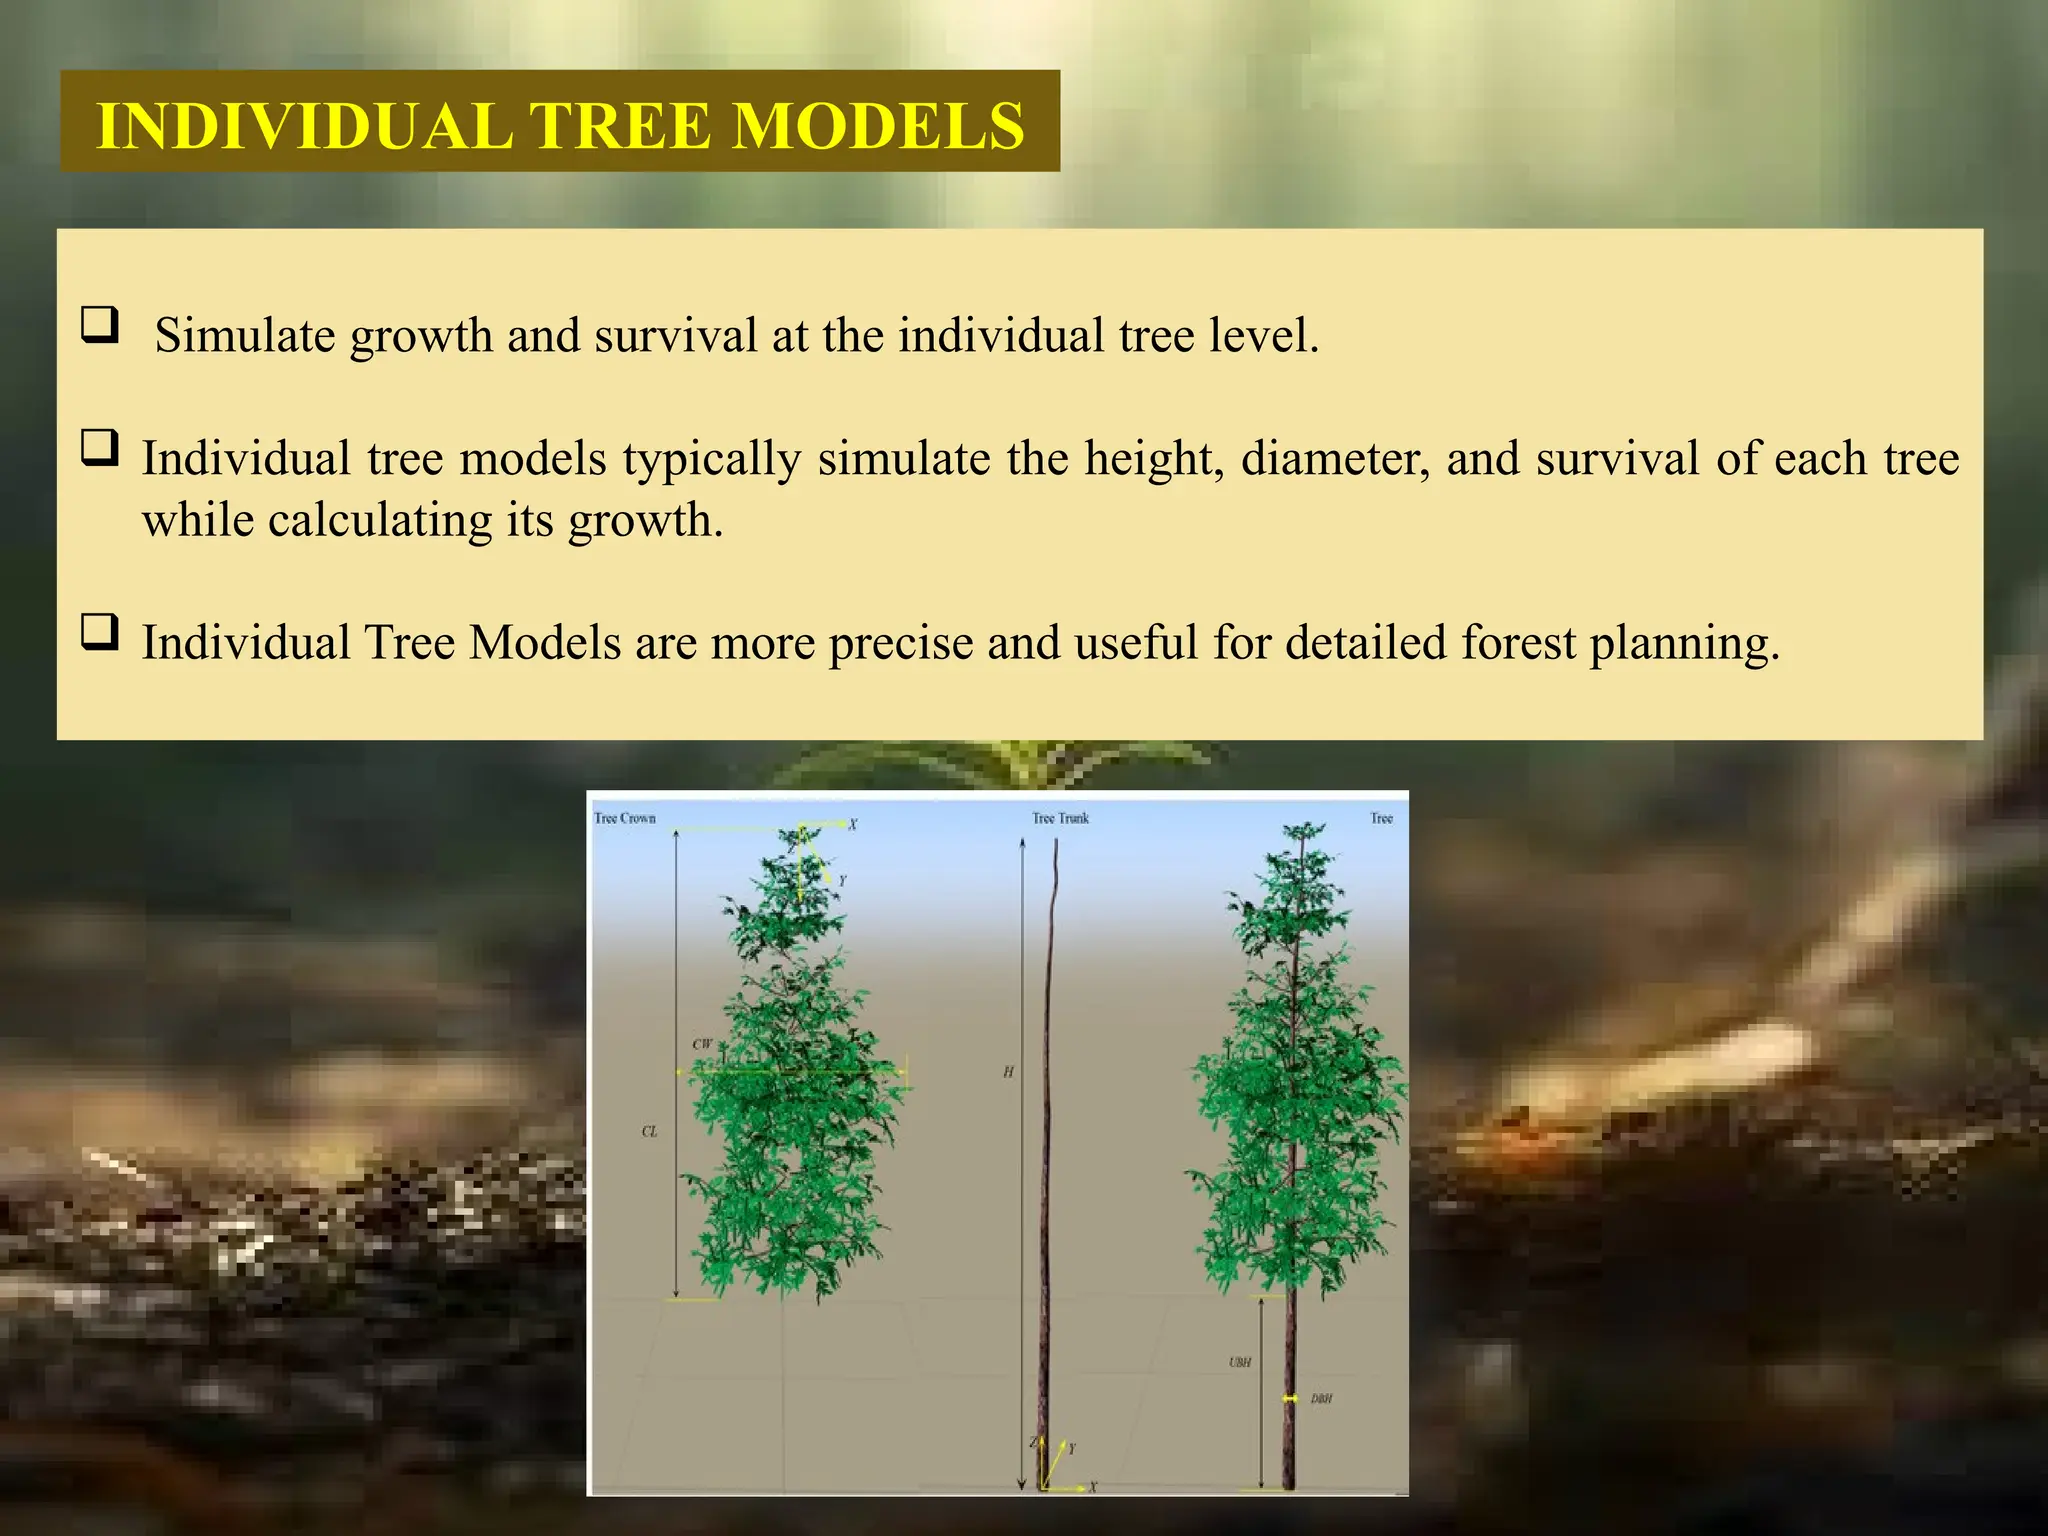
MANIKANT N
PGS23FOR9311
Dept. of Forest Resource Management
Growth Simulation Techniques, Growth and Yield Prediction
Models, integration of RS & GIS.
FOREST BIOMETRY SAF-502
INTRODUCTION
 Growth and yield prediction models are essential tools in agriculture, forestry, and
ecological studies.
 These models help predict how plants, trees, or crops will grow over time and
estimate the potential yield under different environmental, management conditions.
 Simulation techniques used for forecasting stand dynamics are collectively referred
to as growth and yield models
Simulation: is a method of using a computer program to simulate an abstract model of a
particular system. Such as to estimate stand development through time under alternative
conditions or silvicultural practices.
TYPES OF GROWTH AND YIELD SIMULATION
MODELS
 Focus on overall forest stand behavior without considering
individual tree dynamics.
 It simulates how changes in stand density (e.g., due to thinning)
affect total timber volume over time.
 Predicts when a stand should be thinned for optimal timber
yield.
WHOLE STAND MODELS
 Diameter class models simulate growth and volume for each
diameter class based on the average tree in each class.
 It divide trees into diameter classes and calculate growth and
yield for each class.
 Diameter Class Models are useful for mixed-species stands.
DIAMETER CLASS MODELS
 Simulate growth and survival at the individual tree level.
 Individual tree models typically simulate the height, diameter, and survival of each tree
while calculating its growth.
 Individual Tree Models are more precise and useful for detailed forest planning.
INDIVIDUAL TREE MODELS
REMOTE SENSING (RS) AND LIDAR IN GROWTH SIMULATION
 Remote sensing technologies such as satellite imagery and LiDAR play an essential role in
collecting data for growth simulations.
 LiDAR: Used to create 3D models of forest structure, helping estimate biomass, tree height,
canopy cover, and volume.
 Remote sensing provides accurate and large-scale data over time.
 LiDAR can map forest vertical structure, aiding in precise yield predictions.
A. DATA COLLECTION
Field Measurements: include data on height, diameter, biomass, plant population,
phenology, soil properties, weather conditions.
Historical Data: Past records of yield, environmental factors, and management practices
can help in training the model.
Remote Sensing: Satellites or drones can be used to capture large-scale data on vegetation
cover, growth stages, and health.
B. MODEL DEVELOPMENT
Empirical Models: These models are based on statistical relationships between observed
growth.
Mechanistic Models: These models simulate the biological processes of growth, such as
photosynthesis, respiration, and nutrient uptake.
Process-Based Models (PBMs): These account for physiological processes driving plant
growth under different environmental conditions.
PREPARATION OF GROWTH AND YIELD PREDICTION MODELS
C. MODEL CALIBRATION AND VALIDATION
Calibration: Fine-tuning the model to align with actual observations
Validation: Testing the model with unseen data to ensure accuracy and reliability.
Mean absolute error (MAE), root mean square error (RMSE), and other performance
indicators are used to evaluate the model’s accuracy.
THE ROLE OF GIS IN GROWTH SIMULATION
 GIS integrates spatial data with growth models to monitor forest changes over time.
 It allows forestry managers to visualize forest stand dynamics in real-time.
 GIS enhances the accuracy of growth simulations by incorporating topography,
climate, and land-use data.
 Enables scenario planning for management practices like thinning and harvesting.
Fig : GIS developed images
FOREST VEGETATION SIMULATOR
 The Forest Vegetation Simulator is a distance-independent method where projections
are made at the stand level.
 It project, stand growth over a period of time, accounting for tree competition and
environmental factors.
APPLICATION OF GROWTH SIMULATORS IN GROWTH AND
YIELD REGULATION/PREDICTION
Fig : Forest vegetation simulation
THE 4D-GIS MODEL
 It is model which integrates the different simulation algorithms in a 3D geo-
information system (3D-GIS) which results in a new kind of 4D-GIS.
 Which allows the user to look back into the data history and simulate what might
happen under different conditions in the future.
Fig : ground water mapping using 4D-GIS
SEMANTIC WORLD MODELING
 Here different models are used to Develop advanced forest simulation applications based
on "semantic world modeling.
 Which involves deriving of objects from remote sensing data and creating large-area tree
species classification maps.
Figure 3: Aspects of Semantic World Modeling in the forest
A.STAND INVENTORY
 Stand Inventory: Separation of forest into units and merging similar regions into stands.
 Single Tree Inventory: Delineation of algorithms for individual tree measurements using
nDSM (normalized Digital Surface Model).
Fig : Stand inventory
B.SINGLE TREE INVENTORY
 To get volumetric information the N-DSM filled with water. Then, inverted and in
turn, the point with the highest water-level is “opened”.
 The flow of the water is simulated and the amount of water that drains out of the
opening is measured.
Fig: Single Tree Inventory
SILVA FOREST SIMULATOR
For the simulation of realistic silvicultural activities the conventional thinning concepts are
embedded in the program along with guidelines for:
 Thinning intensity
 Harvesting intervals
 Upper limits for the harvested wood volume
fig : SILVA SIMULATION FOR
THINNING
 SILVA simulator software uses an individual tree model with a 5-year simulation period.
 Simulation of thinning operations and harvesting guidelines can be obtained.
HARVESTING COST SIMULATOR
The simulation results can be viewed either in an online visualization or as a table
summary
 It use Discrete event simulation (DES) to quickly calculate harvesting scenarios.
 It Incorporates marked trees, available roads, and resources in the simulation.
Fig : visualization of harvesting pattern
CHALLENGES IN GROWTH AND YIELD MODELING
Data Limitations: Insufficient or inaccurate data can lead to unreliable predictions.
Complexity of Natural Systems: Modeling biological processes is challenging due to
their complexity.
Model Generalization: Ensuring that models are applicable across different regions or
species can be difficult, often requiring site-specific calibration.
FUTURE DIRECTIONS
Integration of Big Data: Combining large datasets from various sources like satellite
imagery, will improve model precision.
AI-Powered Models: As machine learning techniques evolve, models are becoming more
adaptive, requiring less manual calibration.
Climate Change Adaptation: As environments become more variable due to climate
change, models will need to incorporate greater environmental uncertainty.
THANK YOU

growth simulation yield prediction using different simulation tecnique

  • 1.
    MANIKANT N PGS23FOR9311 Dept. ofForest Resource Management Growth Simulation Techniques, Growth and Yield Prediction Models, integration of RS & GIS. FOREST BIOMETRY SAF-502
  • 2.
    INTRODUCTION  Growth andyield prediction models are essential tools in agriculture, forestry, and ecological studies.  These models help predict how plants, trees, or crops will grow over time and estimate the potential yield under different environmental, management conditions.  Simulation techniques used for forecasting stand dynamics are collectively referred to as growth and yield models Simulation: is a method of using a computer program to simulate an abstract model of a particular system. Such as to estimate stand development through time under alternative conditions or silvicultural practices.
  • 3.
    TYPES OF GROWTHAND YIELD SIMULATION MODELS  Focus on overall forest stand behavior without considering individual tree dynamics.  It simulates how changes in stand density (e.g., due to thinning) affect total timber volume over time.  Predicts when a stand should be thinned for optimal timber yield. WHOLE STAND MODELS  Diameter class models simulate growth and volume for each diameter class based on the average tree in each class.  It divide trees into diameter classes and calculate growth and yield for each class.  Diameter Class Models are useful for mixed-species stands. DIAMETER CLASS MODELS
  • 4.
     Simulate growthand survival at the individual tree level.  Individual tree models typically simulate the height, diameter, and survival of each tree while calculating its growth.  Individual Tree Models are more precise and useful for detailed forest planning. INDIVIDUAL TREE MODELS
  • 5.
    REMOTE SENSING (RS)AND LIDAR IN GROWTH SIMULATION  Remote sensing technologies such as satellite imagery and LiDAR play an essential role in collecting data for growth simulations.  LiDAR: Used to create 3D models of forest structure, helping estimate biomass, tree height, canopy cover, and volume.  Remote sensing provides accurate and large-scale data over time.  LiDAR can map forest vertical structure, aiding in precise yield predictions.
  • 6.
    A. DATA COLLECTION FieldMeasurements: include data on height, diameter, biomass, plant population, phenology, soil properties, weather conditions. Historical Data: Past records of yield, environmental factors, and management practices can help in training the model. Remote Sensing: Satellites or drones can be used to capture large-scale data on vegetation cover, growth stages, and health. B. MODEL DEVELOPMENT Empirical Models: These models are based on statistical relationships between observed growth. Mechanistic Models: These models simulate the biological processes of growth, such as photosynthesis, respiration, and nutrient uptake. Process-Based Models (PBMs): These account for physiological processes driving plant growth under different environmental conditions. PREPARATION OF GROWTH AND YIELD PREDICTION MODELS
  • 7.
    C. MODEL CALIBRATIONAND VALIDATION Calibration: Fine-tuning the model to align with actual observations Validation: Testing the model with unseen data to ensure accuracy and reliability. Mean absolute error (MAE), root mean square error (RMSE), and other performance indicators are used to evaluate the model’s accuracy.
  • 8.
    THE ROLE OFGIS IN GROWTH SIMULATION  GIS integrates spatial data with growth models to monitor forest changes over time.  It allows forestry managers to visualize forest stand dynamics in real-time.  GIS enhances the accuracy of growth simulations by incorporating topography, climate, and land-use data.  Enables scenario planning for management practices like thinning and harvesting. Fig : GIS developed images
  • 9.
    FOREST VEGETATION SIMULATOR The Forest Vegetation Simulator is a distance-independent method where projections are made at the stand level.  It project, stand growth over a period of time, accounting for tree competition and environmental factors. APPLICATION OF GROWTH SIMULATORS IN GROWTH AND YIELD REGULATION/PREDICTION Fig : Forest vegetation simulation
  • 10.
    THE 4D-GIS MODEL It is model which integrates the different simulation algorithms in a 3D geo- information system (3D-GIS) which results in a new kind of 4D-GIS.  Which allows the user to look back into the data history and simulate what might happen under different conditions in the future. Fig : ground water mapping using 4D-GIS
  • 11.
    SEMANTIC WORLD MODELING Here different models are used to Develop advanced forest simulation applications based on "semantic world modeling.  Which involves deriving of objects from remote sensing data and creating large-area tree species classification maps. Figure 3: Aspects of Semantic World Modeling in the forest
  • 12.
    A.STAND INVENTORY  StandInventory: Separation of forest into units and merging similar regions into stands.  Single Tree Inventory: Delineation of algorithms for individual tree measurements using nDSM (normalized Digital Surface Model). Fig : Stand inventory
  • 13.
    B.SINGLE TREE INVENTORY To get volumetric information the N-DSM filled with water. Then, inverted and in turn, the point with the highest water-level is “opened”.  The flow of the water is simulated and the amount of water that drains out of the opening is measured. Fig: Single Tree Inventory
  • 14.
    SILVA FOREST SIMULATOR Forthe simulation of realistic silvicultural activities the conventional thinning concepts are embedded in the program along with guidelines for:  Thinning intensity  Harvesting intervals  Upper limits for the harvested wood volume fig : SILVA SIMULATION FOR THINNING  SILVA simulator software uses an individual tree model with a 5-year simulation period.  Simulation of thinning operations and harvesting guidelines can be obtained.
  • 15.
    HARVESTING COST SIMULATOR Thesimulation results can be viewed either in an online visualization or as a table summary  It use Discrete event simulation (DES) to quickly calculate harvesting scenarios.  It Incorporates marked trees, available roads, and resources in the simulation. Fig : visualization of harvesting pattern
  • 16.
    CHALLENGES IN GROWTHAND YIELD MODELING Data Limitations: Insufficient or inaccurate data can lead to unreliable predictions. Complexity of Natural Systems: Modeling biological processes is challenging due to their complexity. Model Generalization: Ensuring that models are applicable across different regions or species can be difficult, often requiring site-specific calibration. FUTURE DIRECTIONS Integration of Big Data: Combining large datasets from various sources like satellite imagery, will improve model precision. AI-Powered Models: As machine learning techniques evolve, models are becoming more adaptive, requiring less manual calibration. Climate Change Adaptation: As environments become more variable due to climate change, models will need to incorporate greater environmental uncertainty.
  • 17.