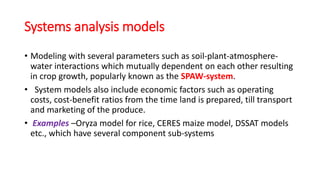
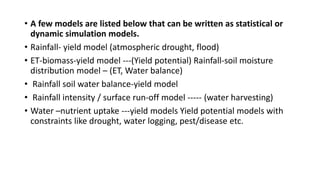
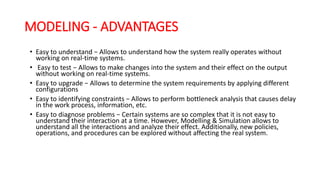
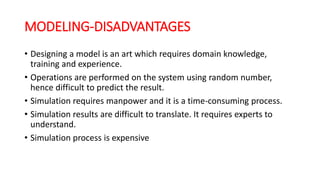
Lecture 15
Introduction to computer based agricultural
models
By
N. Pavithra
E.Shaki
Model
• A model is a schematic representation of the conception of a system
or an act of imitation or a set of equations, which represents the
behavior of a system.
• Model’ is expressed as a computer program that can be repeatedly
run seeral times for computing several designed mathematical or
statistical expressions (equations) governing crop growth-
environment relations, given appropriate input data.
• Act of building a model is Modelling. In other words,it is the process
of representing a model which includes its construction and working
Simulation
• Simulation of a system is the operation of a model in terms of time or
space, which helps analyze the performance of an existing or a
proposed system.
• In other words, simulation is the process of using a model to study
the performance of a system.
• It is an act of using a model for simulation.
• Ex-growth of biomass with time;
water use by a growing crop etc
Systems analysis models
• Modeling with several parameters such as soil-plant-atmosphere-
water interactions which mutually dependent on each other resulting
in crop growth, popularly known as the SPAW-system.
• System models also include economic factors such as operating
costs, cost-benefit ratios from the time land is prepared, till transport
and marketing of the produce.
• Examples –Oryza model for rice, CERES maize model, DSSAT models
etc., which have several component sub-systems
Subsystems
• These are parts of a complex ‘whole’ which themselves could be viewed
independently where needed.
• Rainfall-yield model,
• Soil moisture distribution model,
• rainfall-run off model,
• root growth model etc., are all sub-systems.
Mechanistic process models
• A Mechanistic process model is an depiction of the mechanism
involved in a process e.g., photosynthesis, green or dry matter
production, soil water uptake and transport by the root system etc.,
• Models for crop growth are designed to simulate daily growth of a
plant including all known processes in the soil-plant-water-
environment system. They include water-fertilizer uptake and their
transport, effect of flood and water logging, effect of pest-disease
incidence etc., popularly known as the dynamic crop growth
simulation models.
Operational models
Operational models which are for day-to-day field operations in relation
to the SPAW system can be developed to simulate crop growth using
known relations such as statistical, empirical, mathematical or graphical
models, based on data availability, regional and local crop-environmental
conditions .
For example, an operational model can be developed to answer a
question such as:
How many days would it take for the field to be free from water logging
after a heavy rainfall for a couple of days?
CROP WEATHER MODELING-TYPES
Crop-weather modelling is of two types. They are
(i) Statistical simulation modeling
(ii) Dynamic simulation modeling.
STATISTICAL MODELS
• Statistical simulation modeling approach is used as research tools for
yield forecasting rather than for field operations.
• Statistical models are developed using long term (say 20-30-year
series) average values over a long period between two or more
parameters, say rainfall and crop yield.
• Statistical functions like linear, curvilinear, multiple regression,
orthogonal polynomials etc., are used for modelling.
• Their variability and significance are tested using accurate
procedures.
LIMITATION
• These could assist in making long-term assessment of crop performance on
an average over a couple of decades but given the variations in monsoon
rainfall, such regressions, more often fail in an individual year.
• In practice, it becomes unusable except to understand the extent of
association between rainfall, temperature etc., and yield in general in a
locality over a long period. This is a limitation of such regression models in
the tropical or sub-tropical region like ours.
• Often the experience in the All India Coordinated field trials, is that one
year the crop-weather parameter association comes out as significant
while the very next year it could be non-significant association leading to
erroneous interpretation.
DYNAMIC MODEL
• Dynamic simulation model computes growth values on a day to day
basis using the relations between crop growth parameters and
weather parameters.
• It rebuilds the day to day crop growth in mathematical or mechanistic
terms (simulation) depending on the magnitude of rainfall (or any
other parameters) on a particular day and magnitude of a crop
parameter (or other parameters like physiological, soil,biological
parameters) representing crop growth till that day.
• Such simulation is continued till harvest time. “Growing the crop on
the computer” is a popular phrase.
OBJECTIVE
• Clarity of objective or purpose is significant and essential. Objective of developing a
particular model is the first step.
• The objective could be
(i) for academic understanding(research purpose) of crop growth dynamics
(ii) for monitoring crop growth for any possible field action including prediction of crop
growth and yield
(iii) for solving field level (extension) problems
(iv) for crop planning in relation to climate change or climate variation, for introduction and
assessment of new varieties etc.,
• Parameters used may remain same but depending on the purpose of developing a
model, the structure of the model differs.
• After the objective is decided, it is customary to prepare a flow chart. It is a framework
depicting the different steps to be followed like reading the data, computing different
components, repetition of calculations if any, print format desired etc., in achieving the
objective of the model.
LIST OF AGRICULTURAL MODELS
• Sub models
• Graphical and Checklist models
• Crop Environment models
SUB MODELS
• Sub-model is geared to provide quantitative relationship between the
parameters involved.
• For example, root growth subroutine provides information on root
growth rates with time, soil depth and moisture for a particular crop
and soil type, which are of practical utility in working out water
balance or irrigation depth and needs of a growing crop.
• Rainfall-runoff sub-model can provide information on how much of
the rain received on a day (a heavy shower) would infiltrate into the
soil and get redistributed depending on the rainfall intensity,
antecedent soil wetness and root growth.
GRAPHICAL AND CHECKLIST MODELS
• Besides simulation models, graphical, parametric or checklist models are
also useful in day-to-day work in field operational decisions.
• These are developed from thumb rules from past experience and simple
relations between crop growth and related environmental parameters.
• For example, at a particular growth stage of crop, afternoon humidity
more than 60percent, a brief rainfall of 3mm or more, temperature
between 25 to 30°C is known to initiate a pest/disease development, Such
information can be displayed in a graphical form everyday and marked
‘favourable’ or ‘unfavourable’ using weather data.
• A mere glance at the chart would reveal the situation. No computer model
need be run. The country needs such simple models, easy to develop into
“EXPERT” systems without much sophistication.
CROP ENVIRONMENT MODELS
• Crop weather models is designed as operational models that needs
weather and agronomic data with no genetic coefficients involved, or
not always requiring potential conditions of moisture or nutrients
etc.,
• Rainfed agriculture being a dominant practice in the country, with
potential conditions being absent in several seasons, rainfall driven
models are needed.
• A few models are listed below that can be written as statistical or
dynamic simulation models.
• Rainfall- yield model (atmospheric drought, flood)
• ET-biomass-yield model ---(Yield potential) Rainfall-soil moisture
distribution model – (ET, Water balance)
• Rainfall soil water balance-yield model
• Rainfall intensity / surface run-off model ----- (water harvesting)
• Water –nutrient uptake ---yield models Yield potential models with
constraints like drought, water logging, pest/disease etc.
MODELING - ADVANTAGES
• Easy to understand − Allows to understand how the system really operates without
working on real-time systems.
• Easy to test − Allows to make changes into the system and their effect on the output
without working on real-time systems.
• Easy to upgrade − Allows to determine the system requirements by applying different
configurations
• Easy to identifying constraints − Allows to perform bottleneck analysis that causes delay
in the work process, information, etc.
• Easy to diagnose problems − Certain systems are so complex that it is not easy to
understand their interaction at a time. However, Modelling & Simulation allows to
understand all the interactions and analyze their effect. Additionally, new policies,
operations, and procedures can be explored without affecting the real system.
MODELING-DISADVANTAGES
• Designing a model is an art which requires domain knowledge,
training and experience.
• Operations are performed on the system using random number,
hence difficult to predict the result.
• Simulation requires manpower and it is a time-consuming process.
• Simulation results are difficult to translate. It requires experts to
understand.
• Simulation process is expensive
THANK YOU

Introduction to computer based agricultural models

  • 1.
    Lecture 15 Introduction tocomputer based agricultural models By N. Pavithra E.Shaki
  • 2.
    Model • A modelis a schematic representation of the conception of a system or an act of imitation or a set of equations, which represents the behavior of a system. • Model’ is expressed as a computer program that can be repeatedly run seeral times for computing several designed mathematical or statistical expressions (equations) governing crop growth- environment relations, given appropriate input data. • Act of building a model is Modelling. In other words,it is the process of representing a model which includes its construction and working
  • 3.
    Simulation • Simulation ofa system is the operation of a model in terms of time or space, which helps analyze the performance of an existing or a proposed system. • In other words, simulation is the process of using a model to study the performance of a system. • It is an act of using a model for simulation. • Ex-growth of biomass with time; water use by a growing crop etc
  • 4.
    Systems analysis models •Modeling with several parameters such as soil-plant-atmosphere- water interactions which mutually dependent on each other resulting in crop growth, popularly known as the SPAW-system. • System models also include economic factors such as operating costs, cost-benefit ratios from the time land is prepared, till transport and marketing of the produce. • Examples –Oryza model for rice, CERES maize model, DSSAT models etc., which have several component sub-systems
  • 5.
    Subsystems • These areparts of a complex ‘whole’ which themselves could be viewed independently where needed. • Rainfall-yield model, • Soil moisture distribution model, • rainfall-run off model, • root growth model etc., are all sub-systems.
  • 6.
    Mechanistic process models •A Mechanistic process model is an depiction of the mechanism involved in a process e.g., photosynthesis, green or dry matter production, soil water uptake and transport by the root system etc., • Models for crop growth are designed to simulate daily growth of a plant including all known processes in the soil-plant-water- environment system. They include water-fertilizer uptake and their transport, effect of flood and water logging, effect of pest-disease incidence etc., popularly known as the dynamic crop growth simulation models.
  • 7.
    Operational models Operational modelswhich are for day-to-day field operations in relation to the SPAW system can be developed to simulate crop growth using known relations such as statistical, empirical, mathematical or graphical models, based on data availability, regional and local crop-environmental conditions . For example, an operational model can be developed to answer a question such as: How many days would it take for the field to be free from water logging after a heavy rainfall for a couple of days?
  • 8.
    CROP WEATHER MODELING-TYPES Crop-weathermodelling is of two types. They are (i) Statistical simulation modeling (ii) Dynamic simulation modeling.
  • 9.
    STATISTICAL MODELS • Statisticalsimulation modeling approach is used as research tools for yield forecasting rather than for field operations. • Statistical models are developed using long term (say 20-30-year series) average values over a long period between two or more parameters, say rainfall and crop yield. • Statistical functions like linear, curvilinear, multiple regression, orthogonal polynomials etc., are used for modelling. • Their variability and significance are tested using accurate procedures.
  • 10.
    LIMITATION • These couldassist in making long-term assessment of crop performance on an average over a couple of decades but given the variations in monsoon rainfall, such regressions, more often fail in an individual year. • In practice, it becomes unusable except to understand the extent of association between rainfall, temperature etc., and yield in general in a locality over a long period. This is a limitation of such regression models in the tropical or sub-tropical region like ours. • Often the experience in the All India Coordinated field trials, is that one year the crop-weather parameter association comes out as significant while the very next year it could be non-significant association leading to erroneous interpretation.
  • 11.
    DYNAMIC MODEL • Dynamicsimulation model computes growth values on a day to day basis using the relations between crop growth parameters and weather parameters. • It rebuilds the day to day crop growth in mathematical or mechanistic terms (simulation) depending on the magnitude of rainfall (or any other parameters) on a particular day and magnitude of a crop parameter (or other parameters like physiological, soil,biological parameters) representing crop growth till that day. • Such simulation is continued till harvest time. “Growing the crop on the computer” is a popular phrase.
  • 12.
    OBJECTIVE • Clarity ofobjective or purpose is significant and essential. Objective of developing a particular model is the first step. • The objective could be (i) for academic understanding(research purpose) of crop growth dynamics (ii) for monitoring crop growth for any possible field action including prediction of crop growth and yield (iii) for solving field level (extension) problems (iv) for crop planning in relation to climate change or climate variation, for introduction and assessment of new varieties etc., • Parameters used may remain same but depending on the purpose of developing a model, the structure of the model differs. • After the objective is decided, it is customary to prepare a flow chart. It is a framework depicting the different steps to be followed like reading the data, computing different components, repetition of calculations if any, print format desired etc., in achieving the objective of the model.
  • 13.
    LIST OF AGRICULTURALMODELS • Sub models • Graphical and Checklist models • Crop Environment models
  • 14.
    SUB MODELS • Sub-modelis geared to provide quantitative relationship between the parameters involved. • For example, root growth subroutine provides information on root growth rates with time, soil depth and moisture for a particular crop and soil type, which are of practical utility in working out water balance or irrigation depth and needs of a growing crop. • Rainfall-runoff sub-model can provide information on how much of the rain received on a day (a heavy shower) would infiltrate into the soil and get redistributed depending on the rainfall intensity, antecedent soil wetness and root growth.
  • 15.
    GRAPHICAL AND CHECKLISTMODELS • Besides simulation models, graphical, parametric or checklist models are also useful in day-to-day work in field operational decisions. • These are developed from thumb rules from past experience and simple relations between crop growth and related environmental parameters. • For example, at a particular growth stage of crop, afternoon humidity more than 60percent, a brief rainfall of 3mm or more, temperature between 25 to 30°C is known to initiate a pest/disease development, Such information can be displayed in a graphical form everyday and marked ‘favourable’ or ‘unfavourable’ using weather data. • A mere glance at the chart would reveal the situation. No computer model need be run. The country needs such simple models, easy to develop into “EXPERT” systems without much sophistication.
  • 16.
    CROP ENVIRONMENT MODELS •Crop weather models is designed as operational models that needs weather and agronomic data with no genetic coefficients involved, or not always requiring potential conditions of moisture or nutrients etc., • Rainfed agriculture being a dominant practice in the country, with potential conditions being absent in several seasons, rainfall driven models are needed.
  • 17.
    • A fewmodels are listed below that can be written as statistical or dynamic simulation models. • Rainfall- yield model (atmospheric drought, flood) • ET-biomass-yield model ---(Yield potential) Rainfall-soil moisture distribution model – (ET, Water balance) • Rainfall soil water balance-yield model • Rainfall intensity / surface run-off model ----- (water harvesting) • Water –nutrient uptake ---yield models Yield potential models with constraints like drought, water logging, pest/disease etc.
  • 18.
    MODELING - ADVANTAGES •Easy to understand − Allows to understand how the system really operates without working on real-time systems. • Easy to test − Allows to make changes into the system and their effect on the output without working on real-time systems. • Easy to upgrade − Allows to determine the system requirements by applying different configurations • Easy to identifying constraints − Allows to perform bottleneck analysis that causes delay in the work process, information, etc. • Easy to diagnose problems − Certain systems are so complex that it is not easy to understand their interaction at a time. However, Modelling & Simulation allows to understand all the interactions and analyze their effect. Additionally, new policies, operations, and procedures can be explored without affecting the real system.
  • 19.
    MODELING-DISADVANTAGES • Designing amodel is an art which requires domain knowledge, training and experience. • Operations are performed on the system using random number, hence difficult to predict the result. • Simulation requires manpower and it is a time-consuming process. • Simulation results are difficult to translate. It requires experts to understand. • Simulation process is expensive
  • 20.