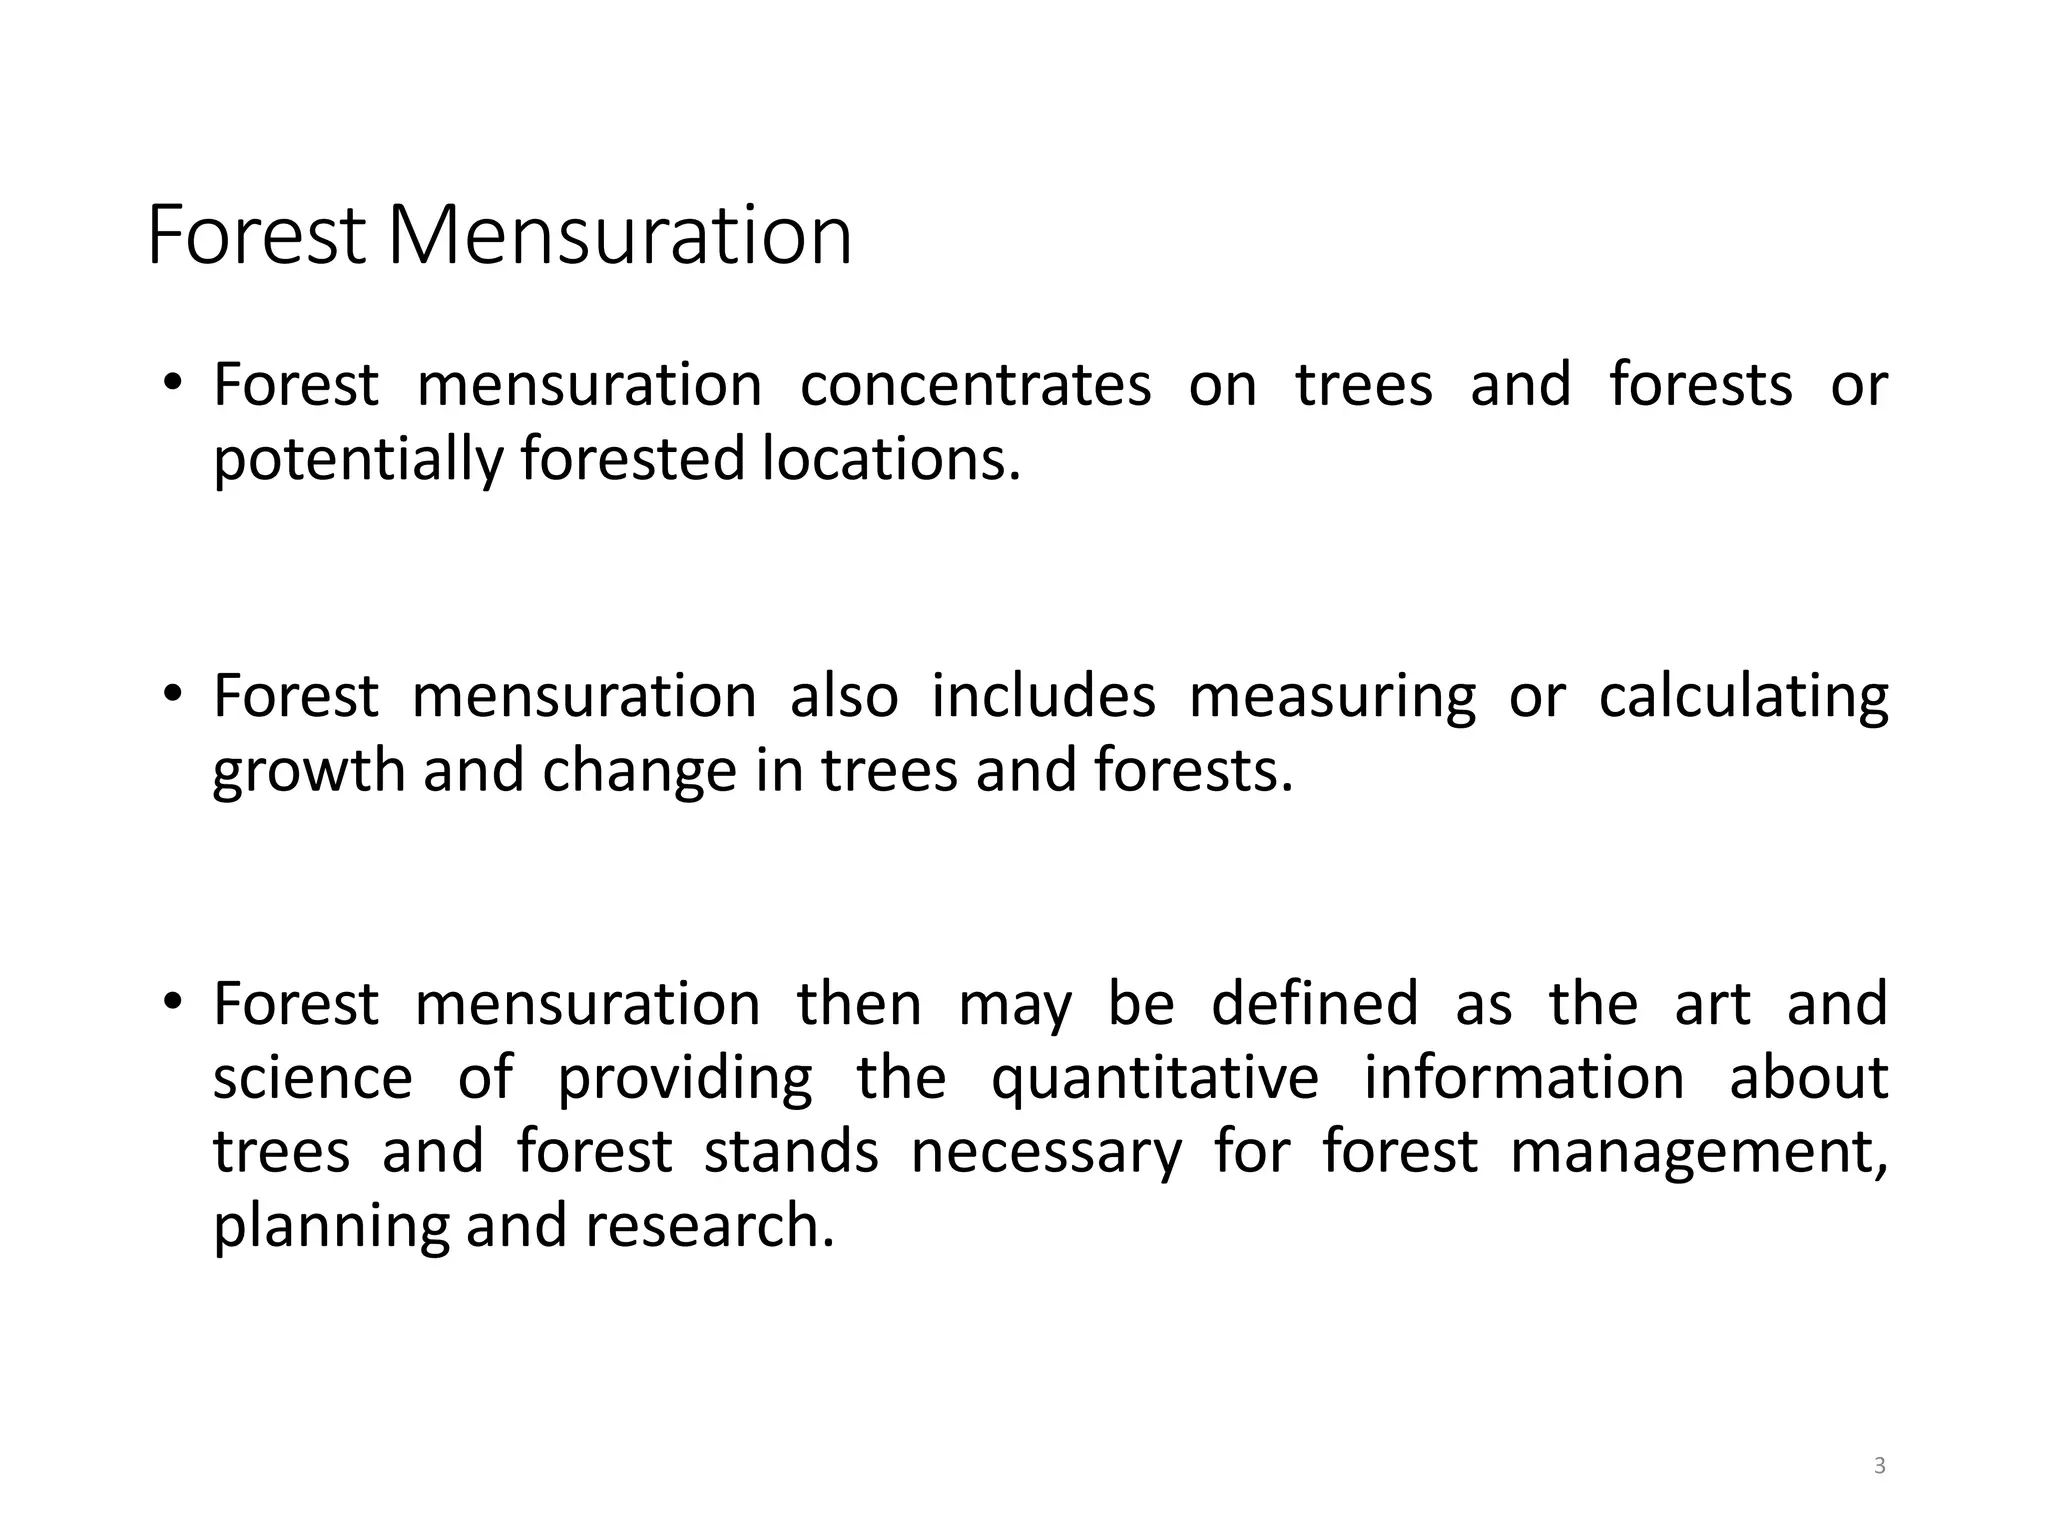
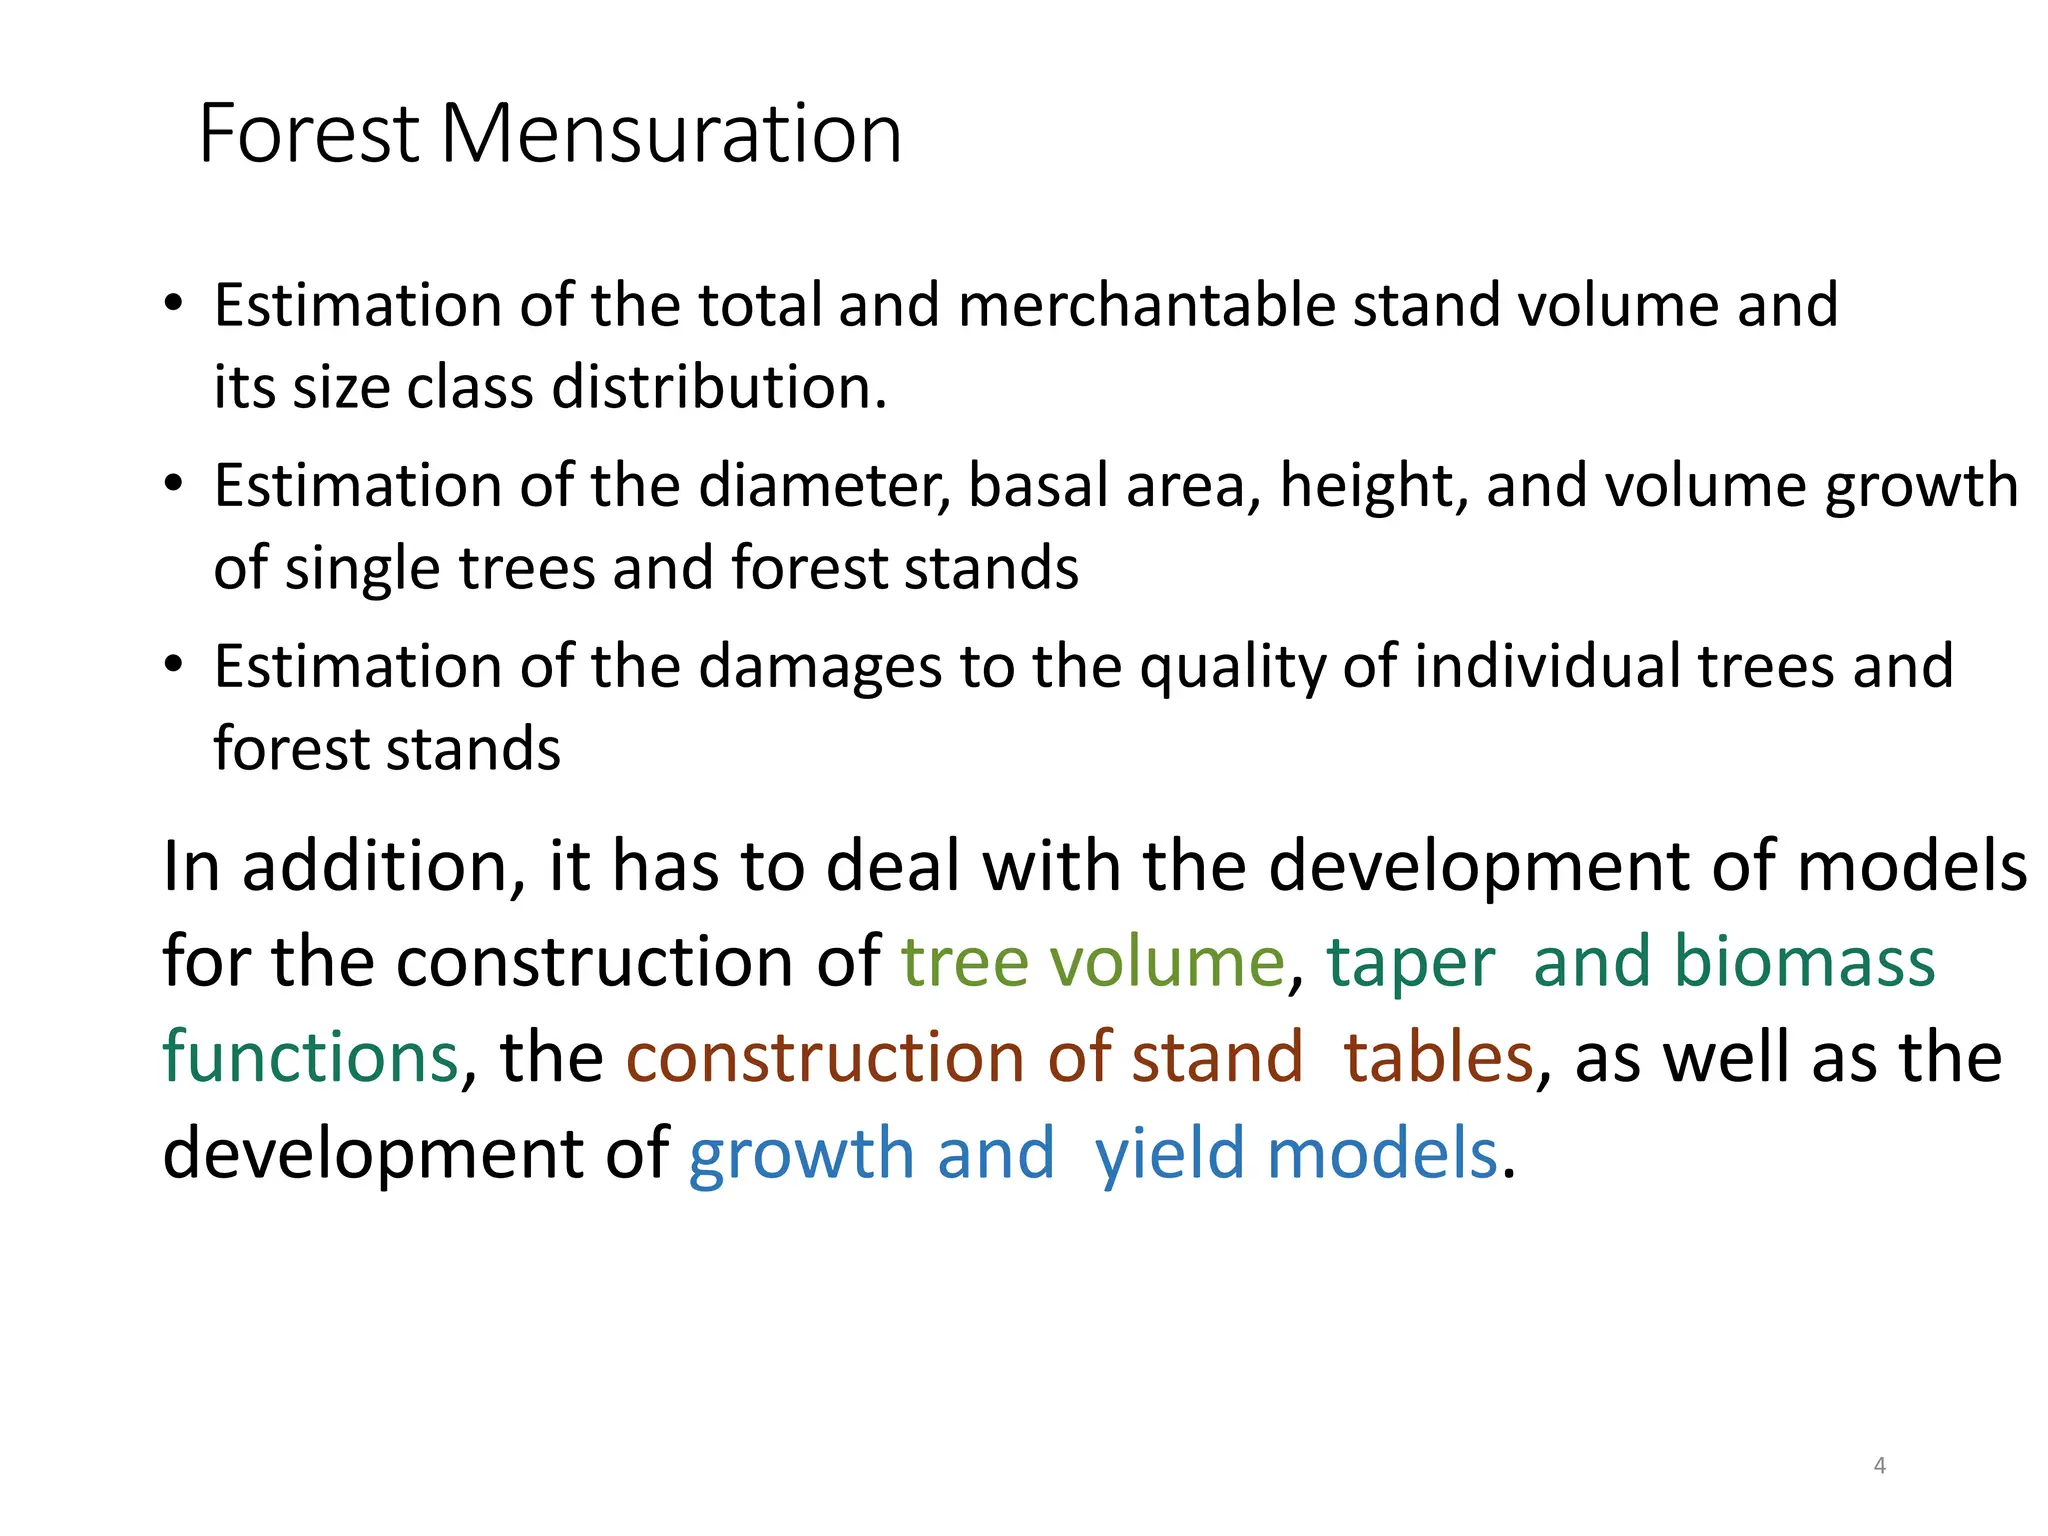
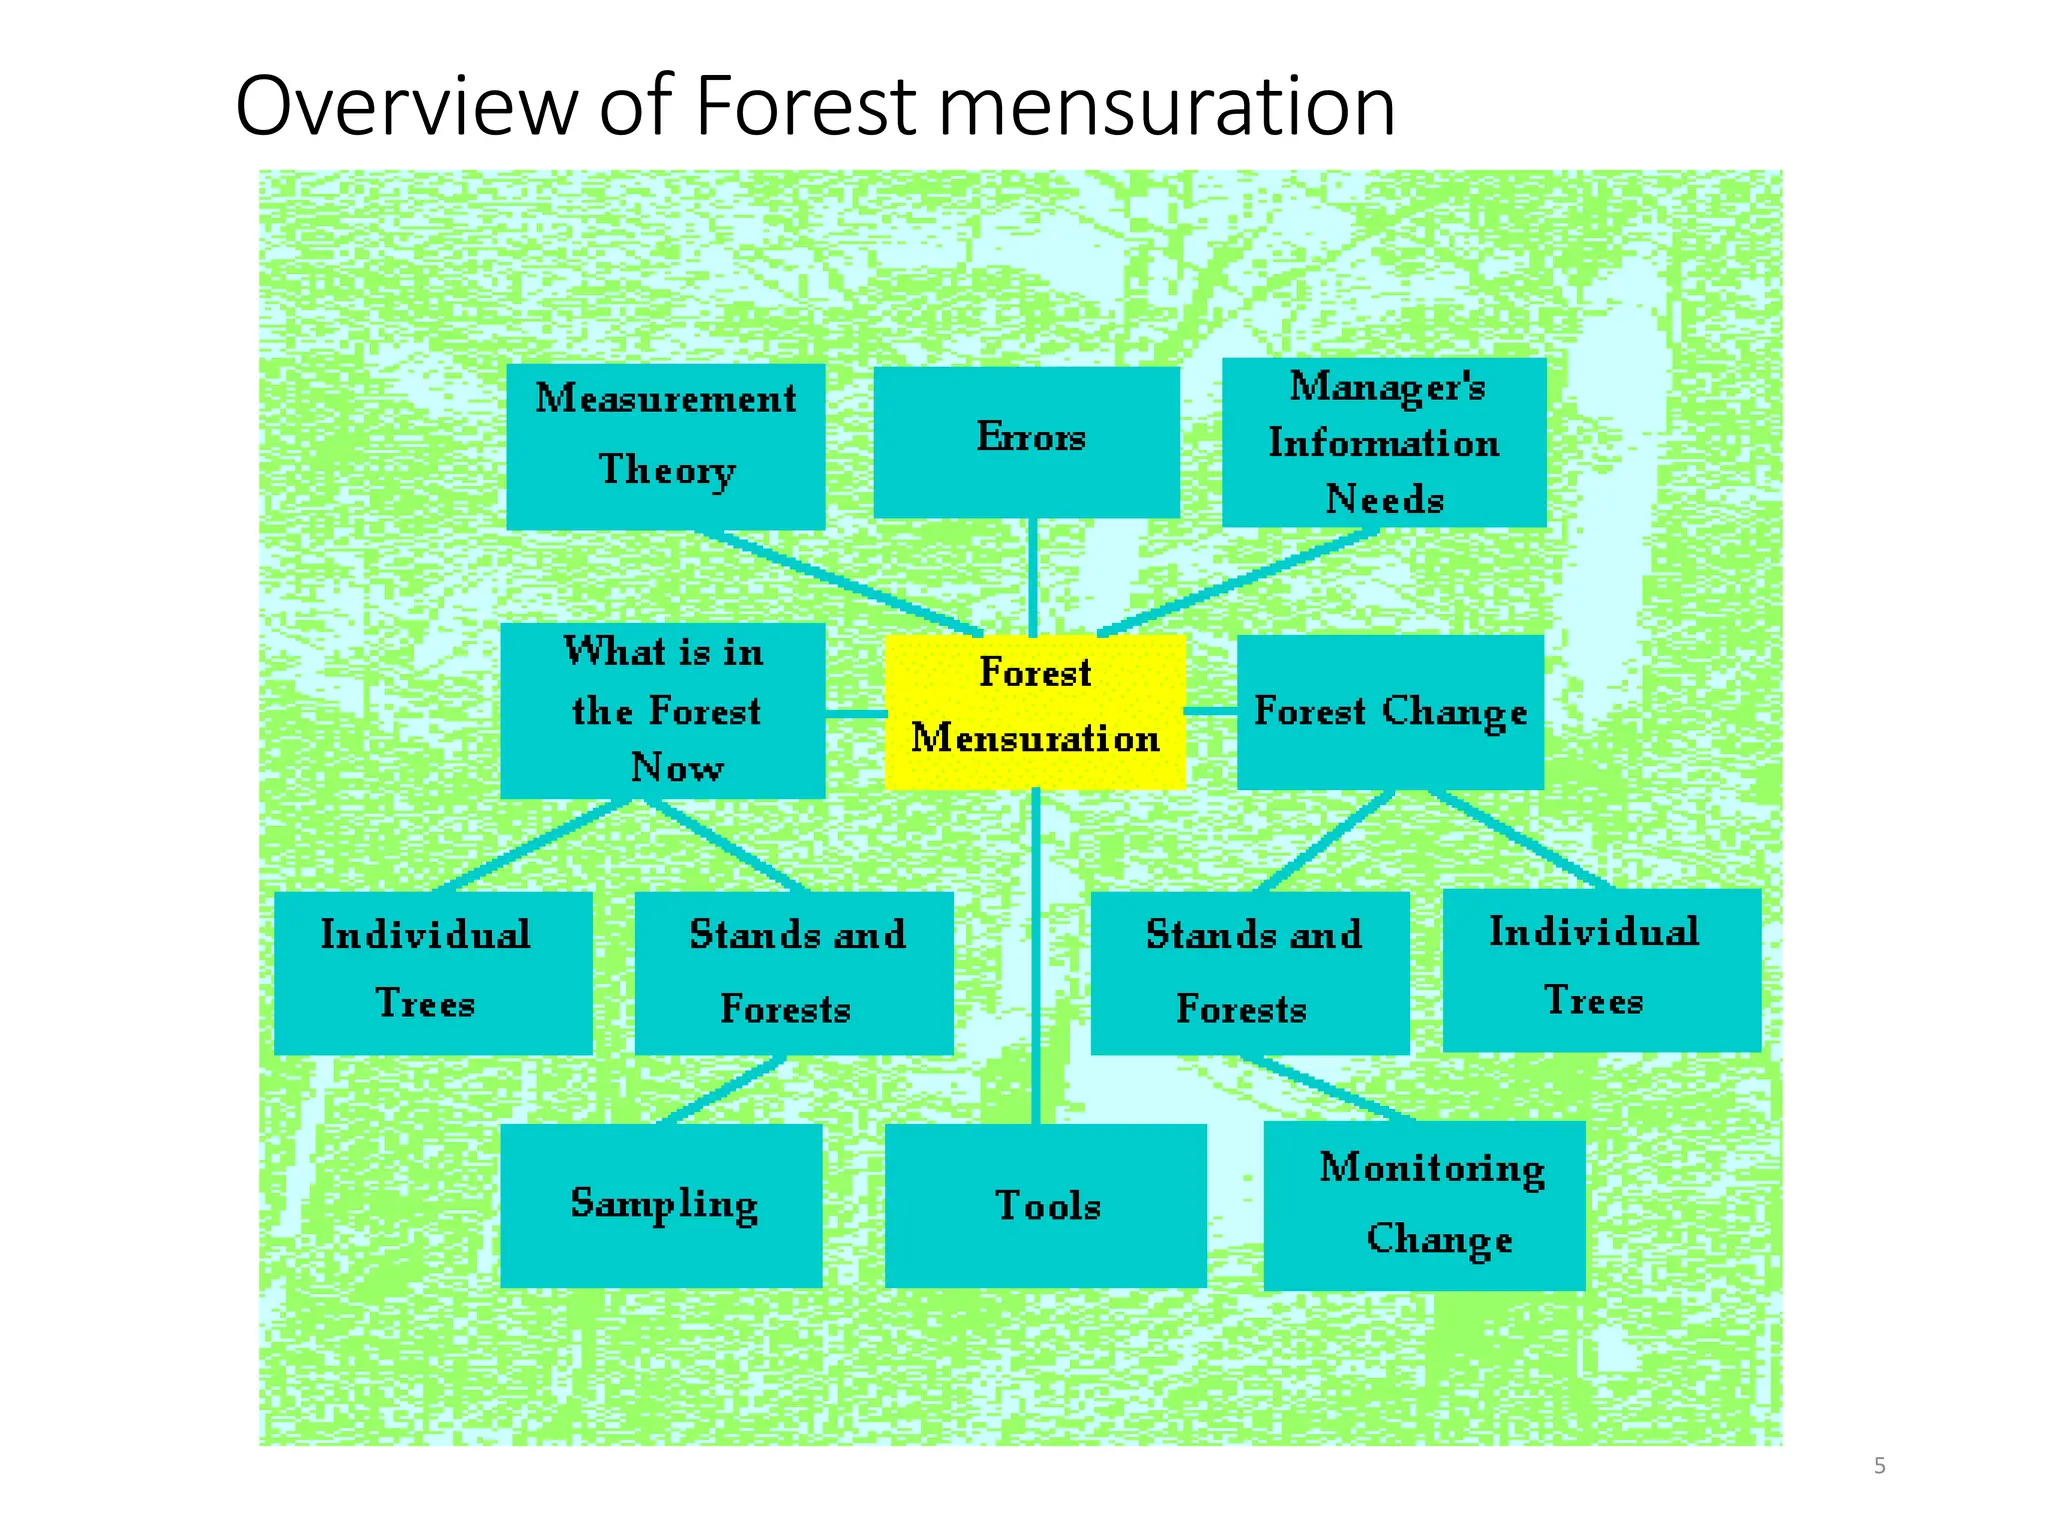
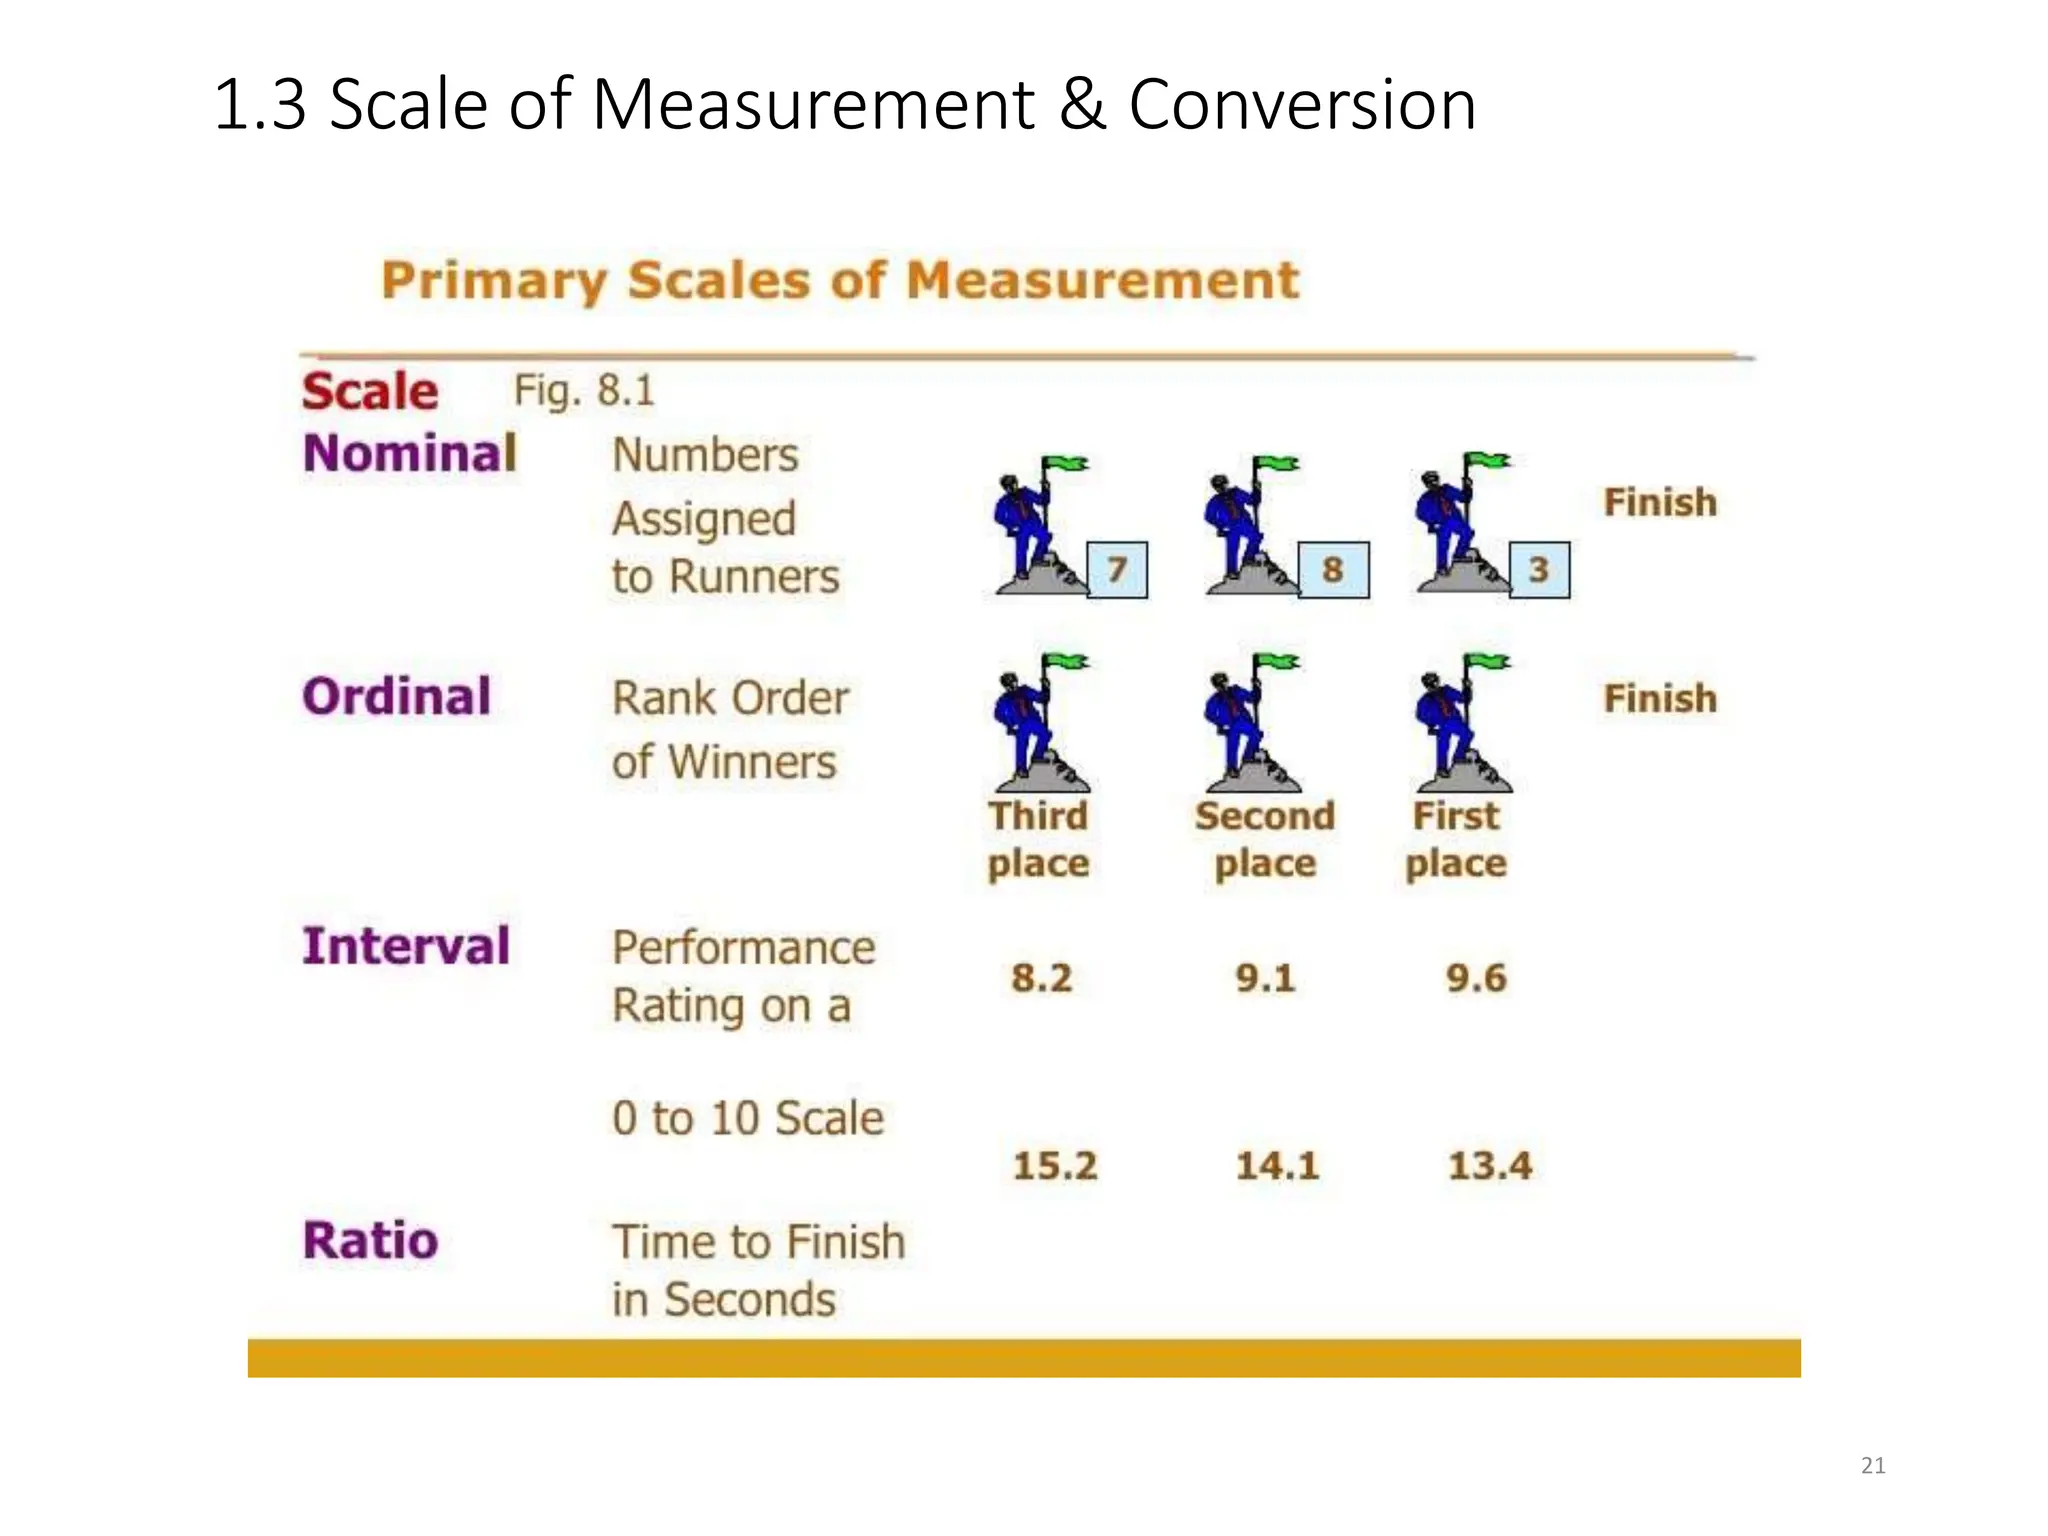
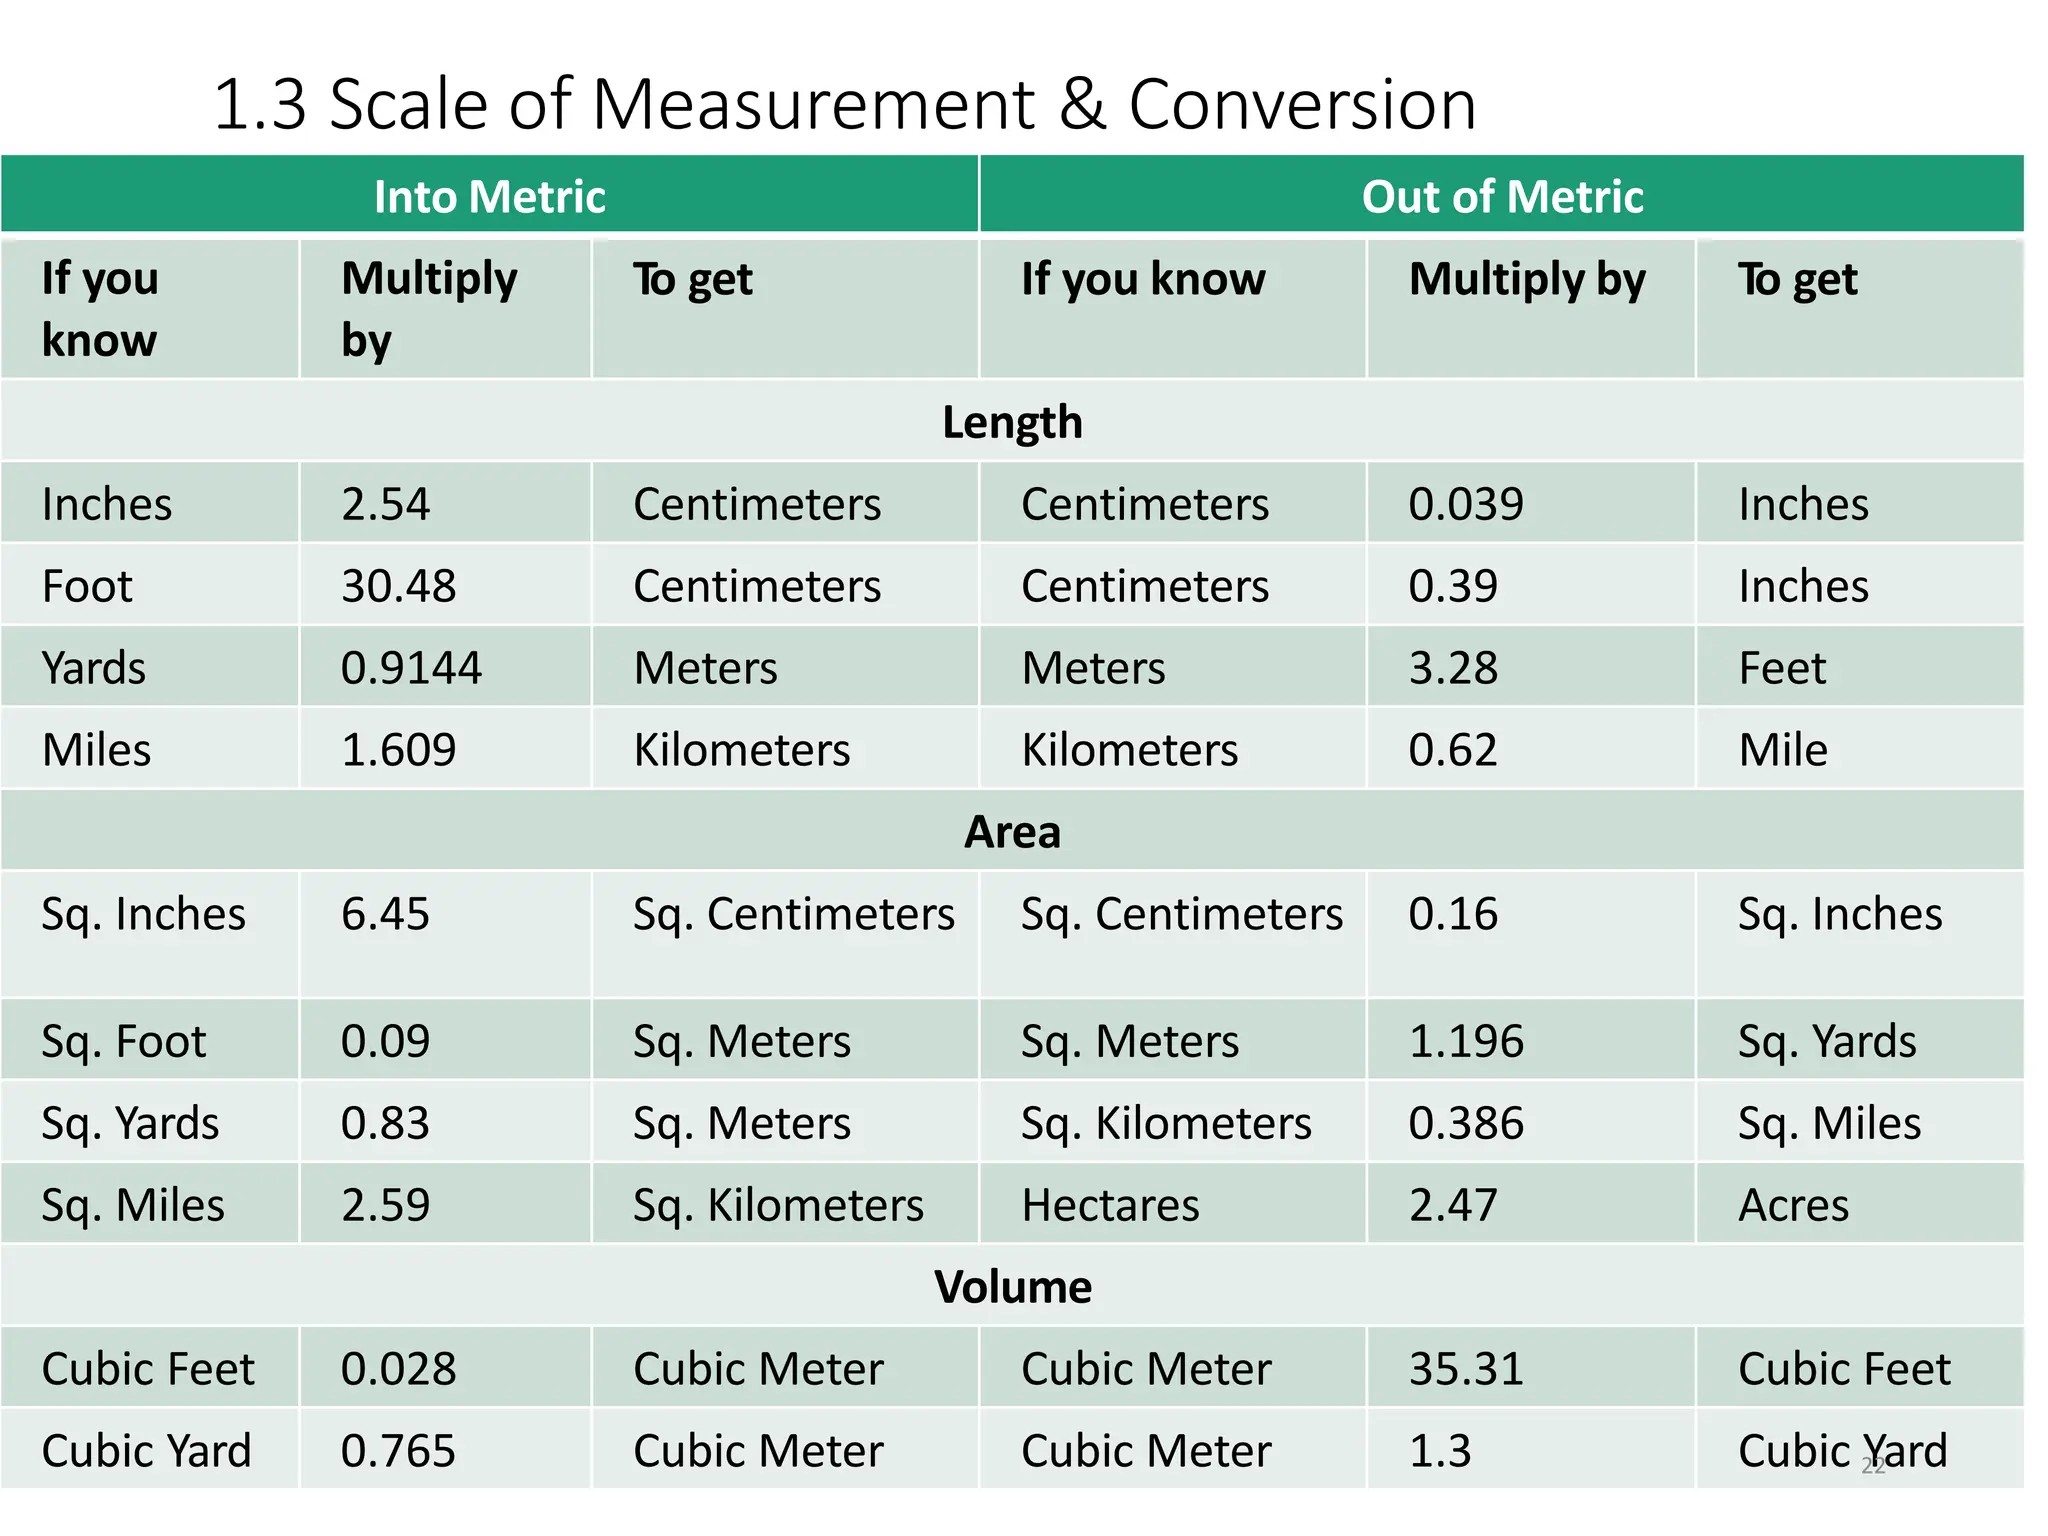
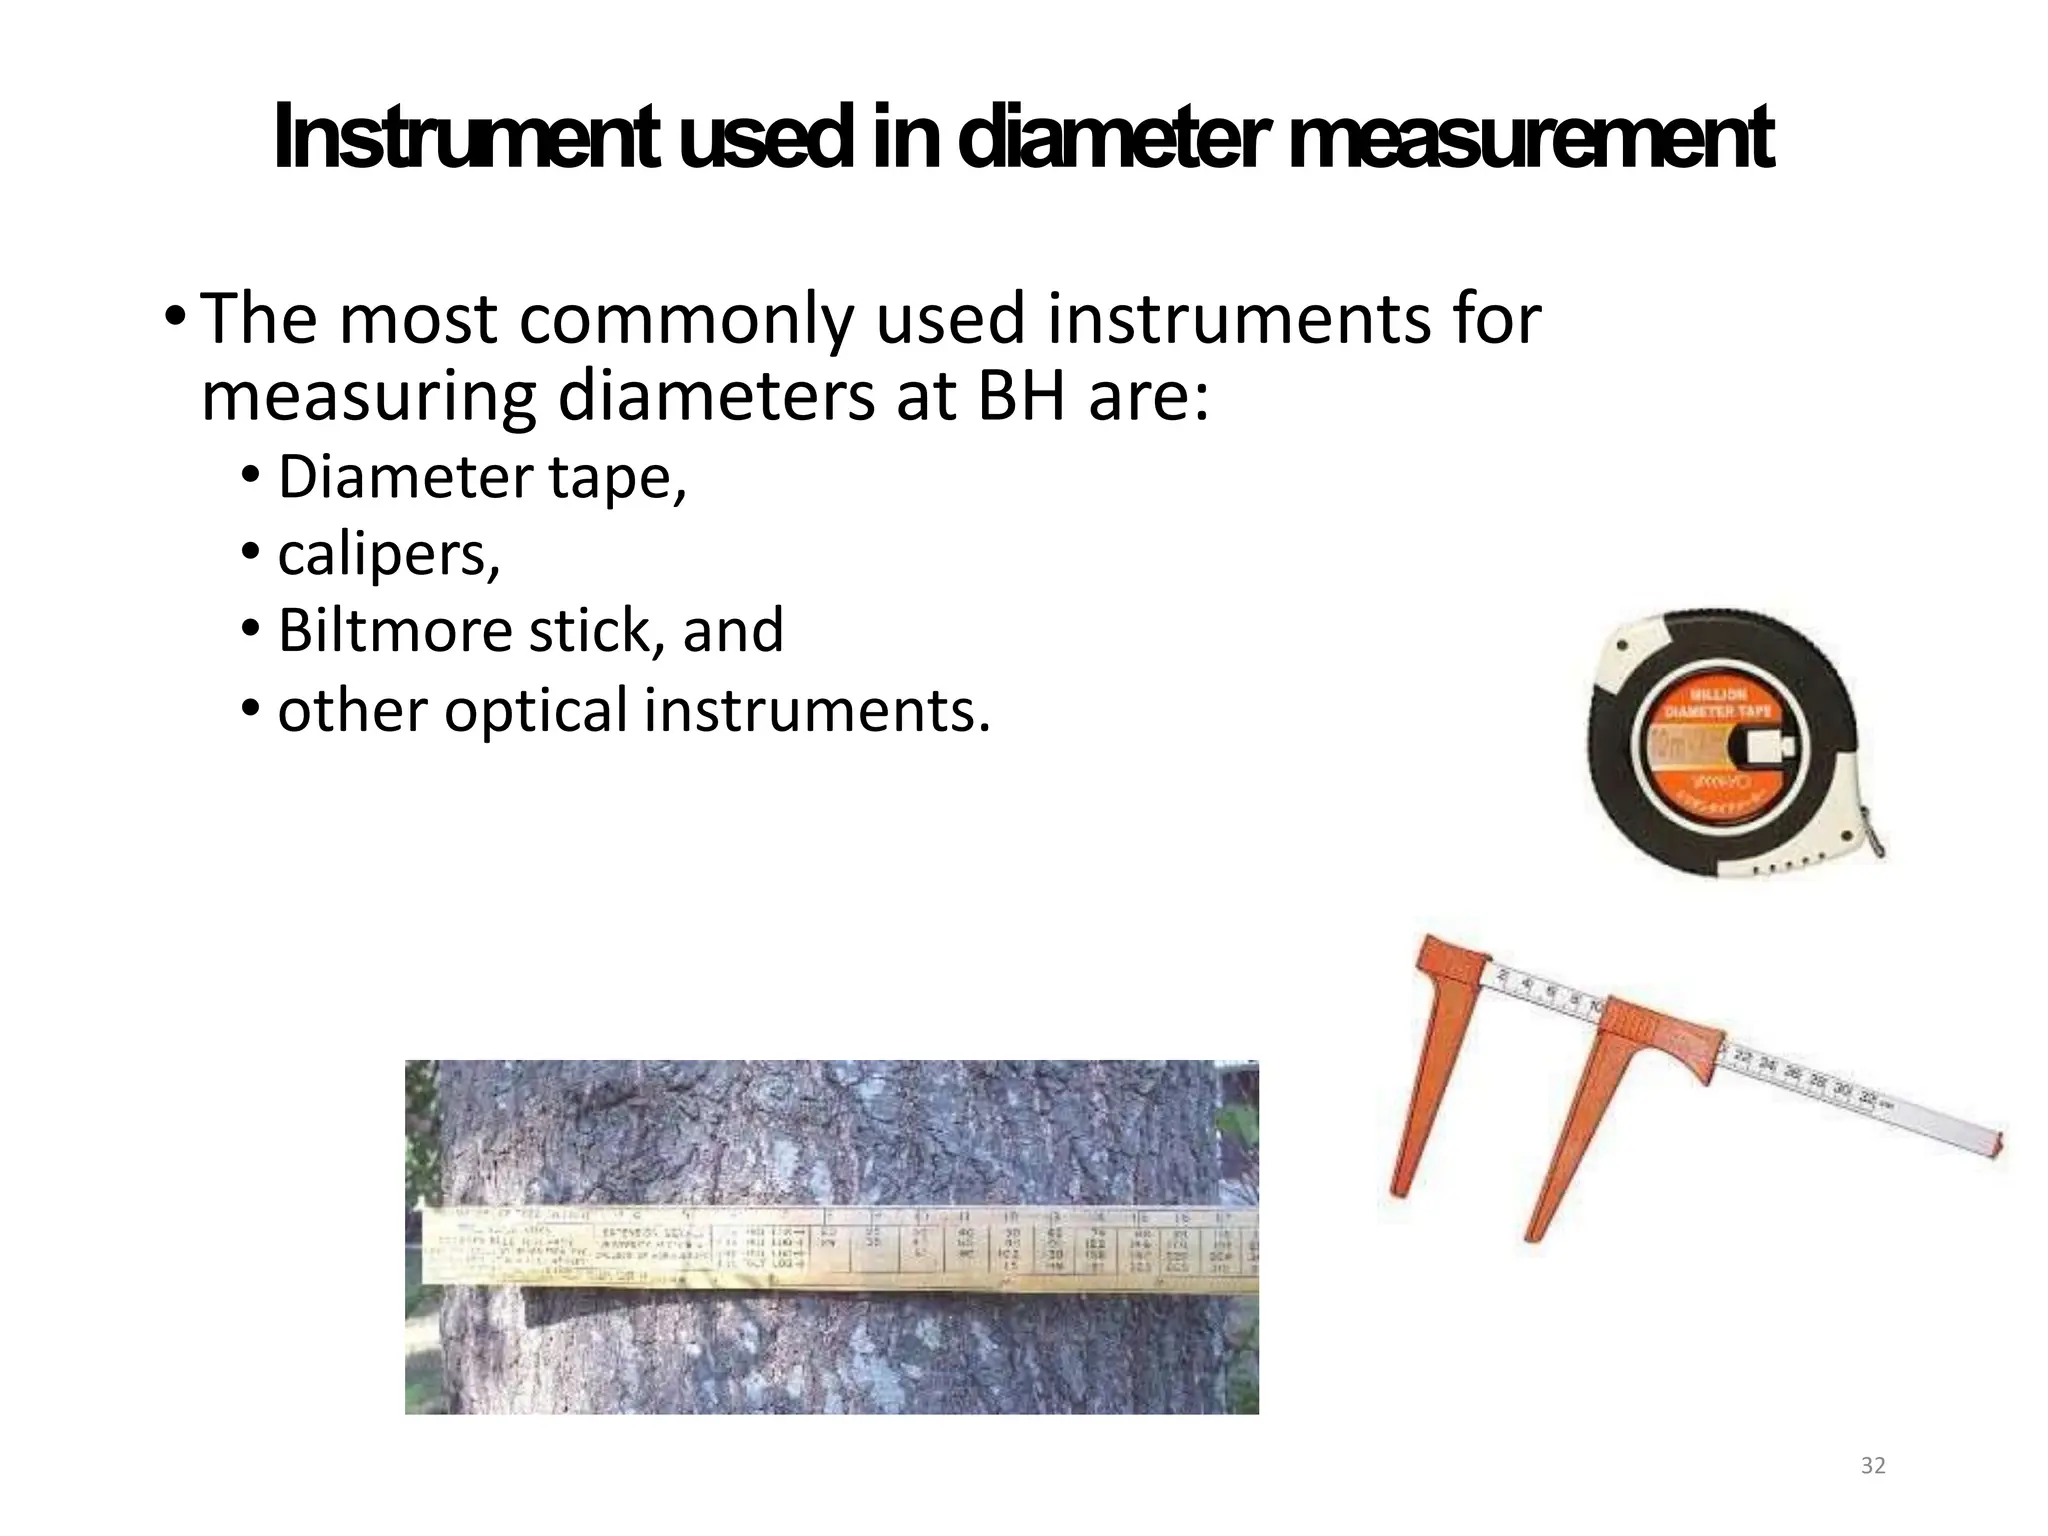
The document provides an introduction to forest mensuration, which focuses on measuring trees and forests to gather quantitative data essential for forest management and planning. It covers the importance of mensuration in assessing forest health, potential yields, damage evaluations, and biodiversity status, along with methods for measuring key parameters such as diameter and height of trees. Furthermore, the document discusses factors related to accuracy, precision, and bias in measurements, as well as various scales of measurement and standard practices.


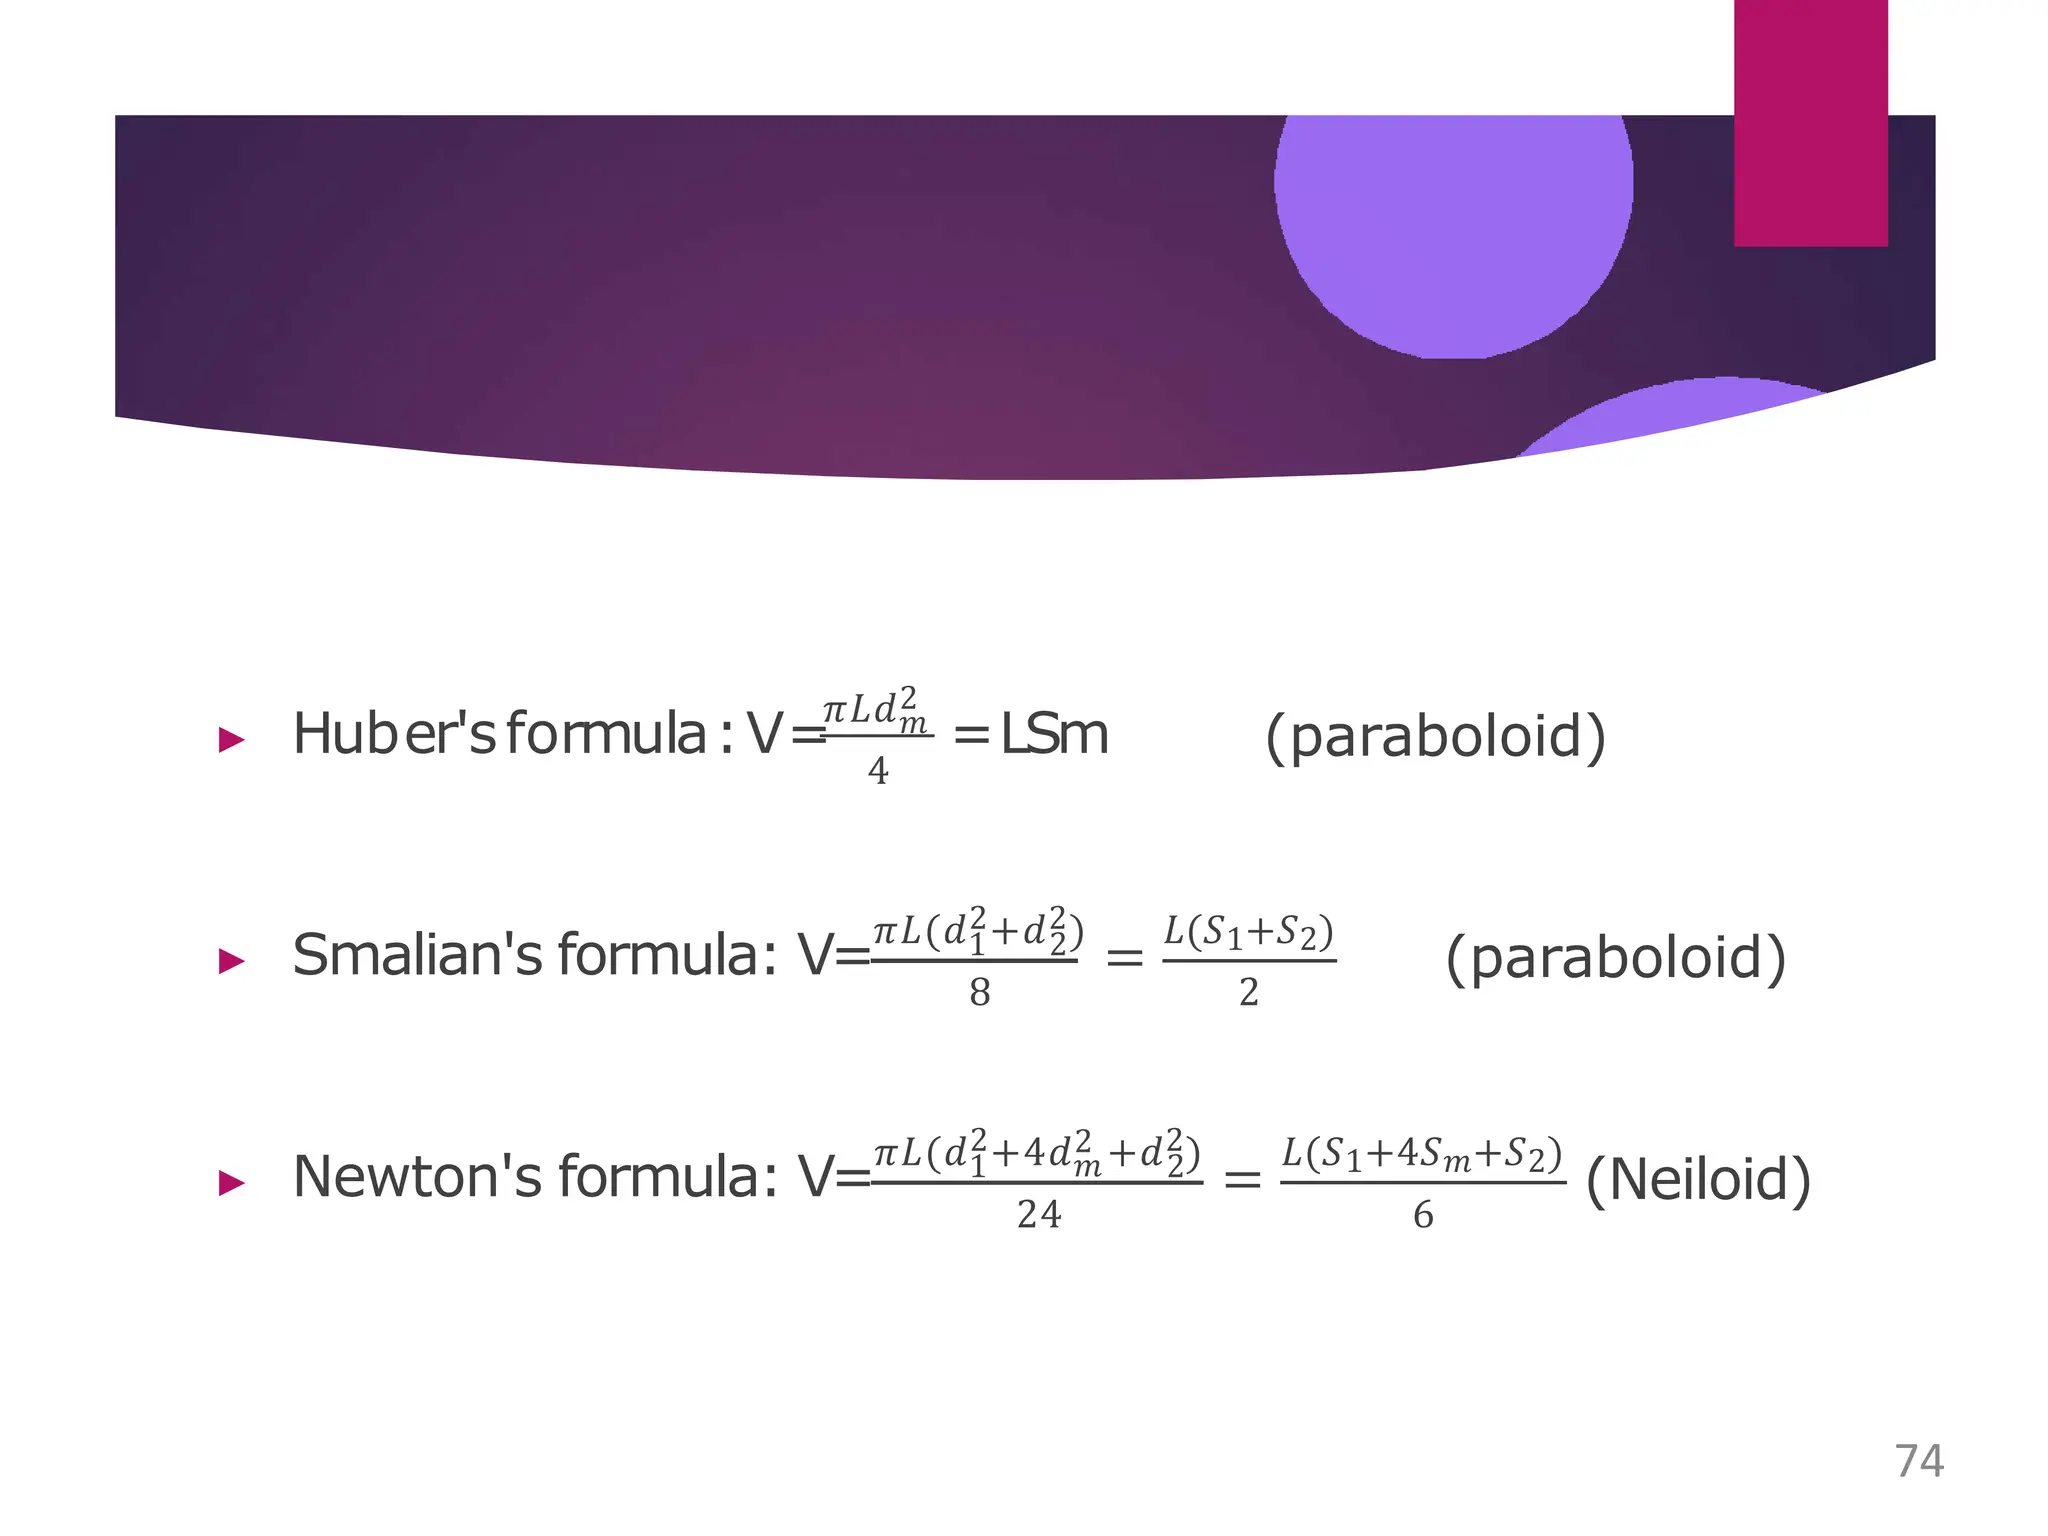


![Huber'sFormula
▶ gives the volume of the frustum of
paraboloid (&cylinder)
▶ underestimates the volume
▶ difficult to apply particularlywhen the
logs are stacked
▶ more easy and accurate than
smalian’s formula
▶ Negative error
Difference between H & N
= 𝑆𝑚 × 𝐿 −
6
𝑆1+ 4𝑆𝑚+𝑆2
× 𝐿
=𝐿
6
6𝑆𝑚 − 𝑆1 − 4𝑆𝑚 − 𝑆2
6
=𝐿
[2𝑆𝑚 − (𝑆1 + 𝑆2)]
77](https://image.slidesharecdn.com/introductoryforestmensuration-240122111011-2e944cb2/75/Forestry-Introductory-Forest-Mensuration-pptx-77-2048.jpg)


![Metzger’s Theory
or Girder Theory
▶ T
hiscan be proved mathematically asfollows:
then by the rule of mechanics,
▶ S=[(P ×l)/d3] ×(32/π)
▶ As the force P in case of trees consists of components W =wind pressure
per unit area and F =crown area, it will be P =W ×F
. Then,
▶ S=[(W ×
F ×l)/d3] ×(32/π)
▶ Or
, d3 =(32 ×W ×
F×l)/ π ×S
▶ For a given tree W
, F and Scan be considered as constant. Therefore,
▶ d3 =kl, where k isa constant.
▶ Thus, the diameter rose to the third power increases proportionately with
lengthening of the lever or with the increasing distance from the central
point of application of wind force, which can be assumed to be at the
centre of gravity of the crown.
17
P =force applied to a
cantileverbeam at itsfree
end
l =the distance of a given
crosssection from the point
of application of thisforce,
D =the diameter of the
beam at thispoint and
S=the bending stress
kg/cm2,
99](https://image.slidesharecdn.com/introductoryforestmensuration-240122111011-2e944cb2/75/Forestry-Introductory-Forest-Mensuration-pptx-99-2048.jpg)


![Taper Table and Formulae
▶ The rate of tree taper varies not only by species but also by age, dbh
and tree height.
▶ Taper tables are compiled by a series of diameter measurements
taken at intervalsalong the bole.
Formulae
▶ Kozak et al. (1996) have shown that for certain coniferous species,
upper stem diameters (dib) can be reliably predicted from this
parabolic function:
▶ d2/dbh2 =b0 +b1 (h/H) +b2 (h2/H2)
▶ T
herefore, d =dbh √[b0 +b1 (h/H) +b2 (h2/H2)]
▶ Where d =stem diameter at any given height h above ground
▶ H =total tree height
▶ b0, b1, b2 =Régression coefficients
112](https://image.slidesharecdn.com/introductoryforestmensuration-240122111011-2e944cb2/75/Forestry-Introductory-Forest-Mensuration-pptx-112-2048.jpg)