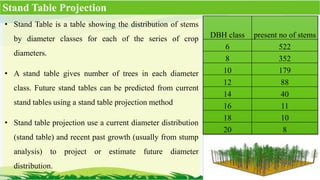
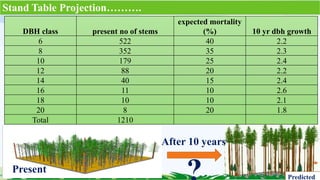
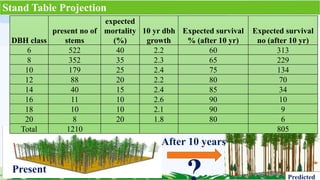
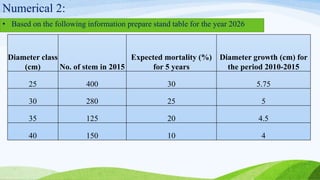
- Forest growth and yield models are used to predict future timber growth and distribution based on past and present data
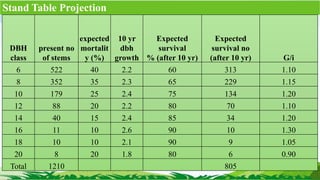
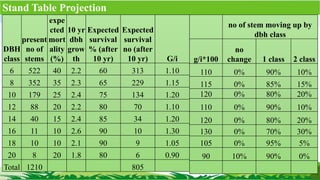
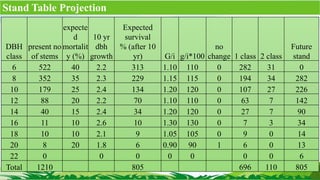
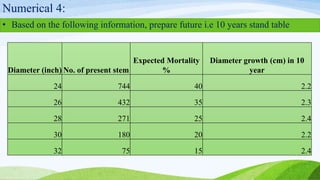
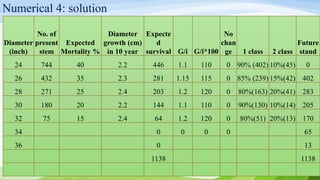
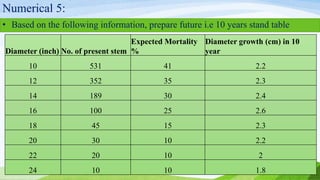
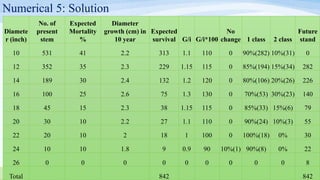
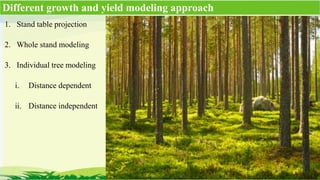
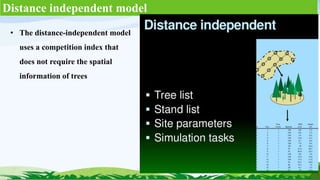
- There are different approaches to growth and yield modeling including stand table projection, whole stand modeling, and individual tree modeling
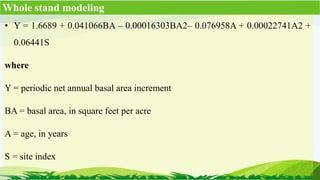
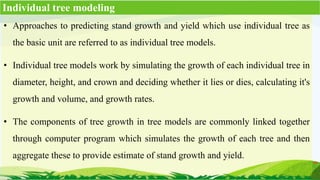
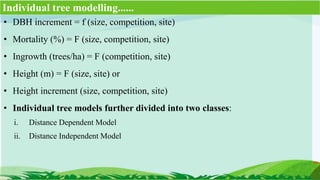
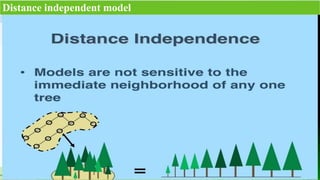
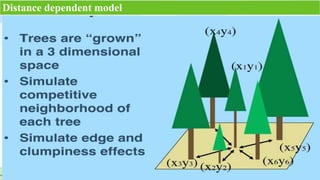
- Whole stand modeling relates growth and yield to stand-level variables like basal area, age, and site index while individual tree modeling simulates growth at the tree level accounting for size, competition, and site factors