
Download as PDF, PPTX
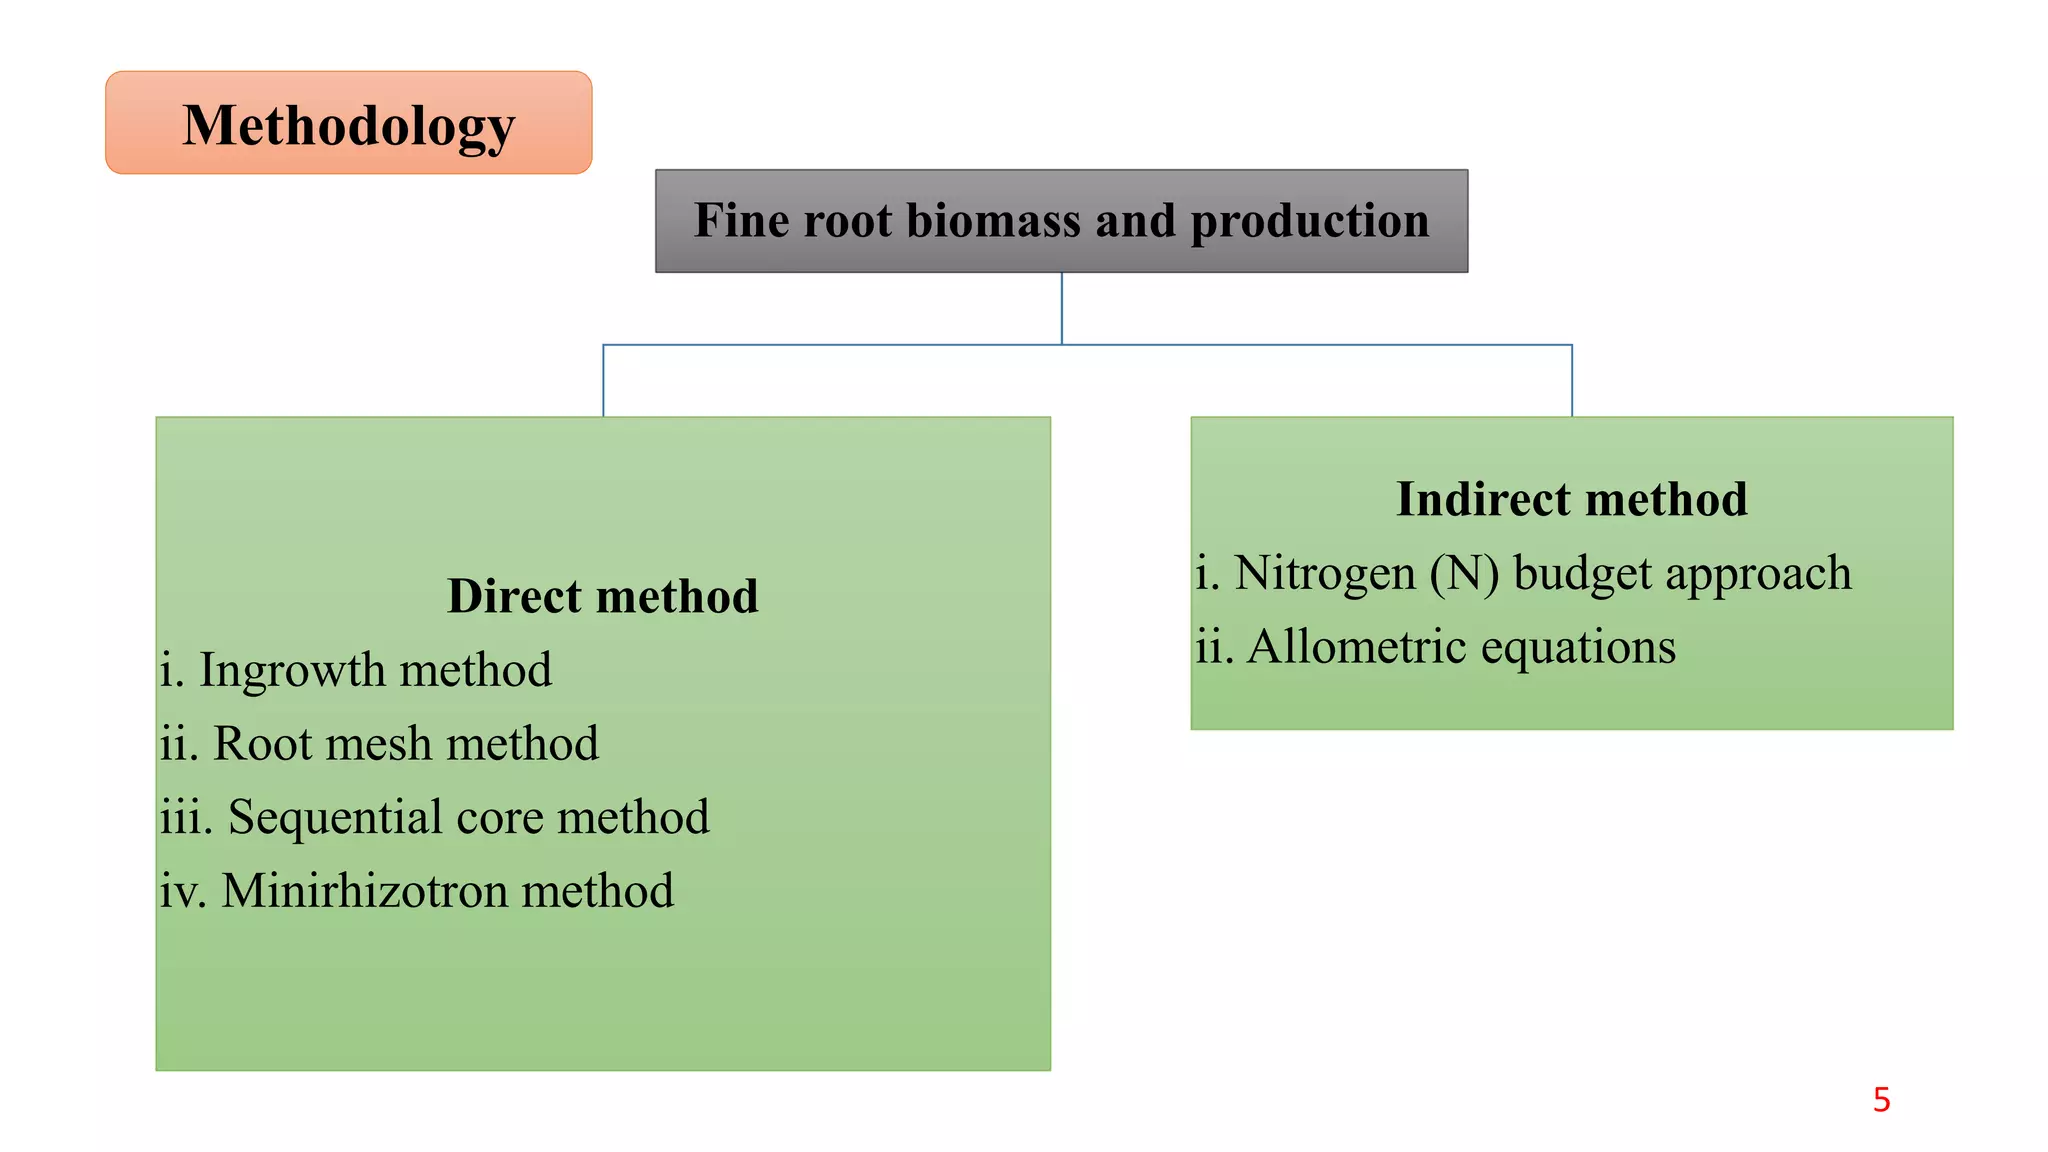
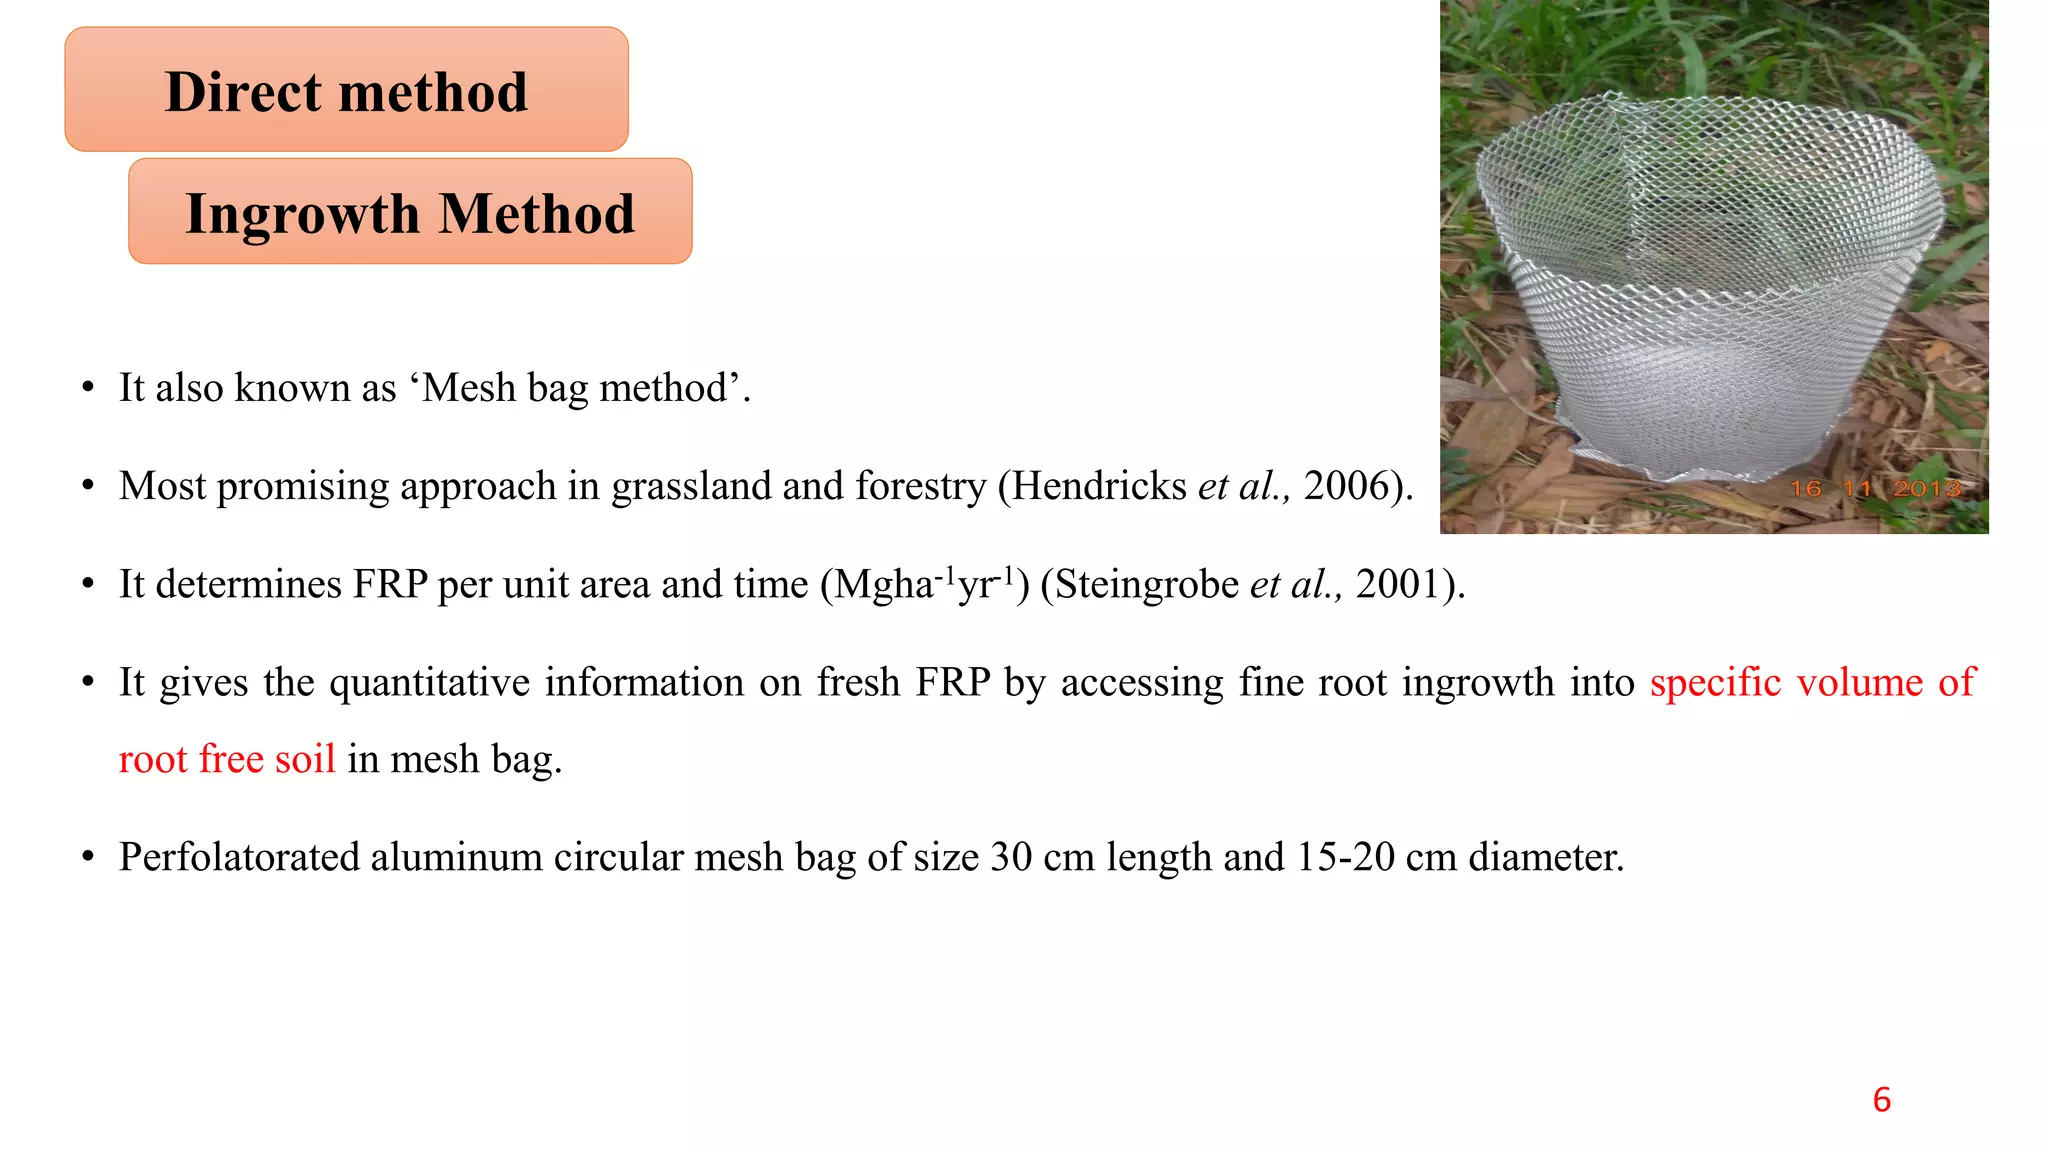
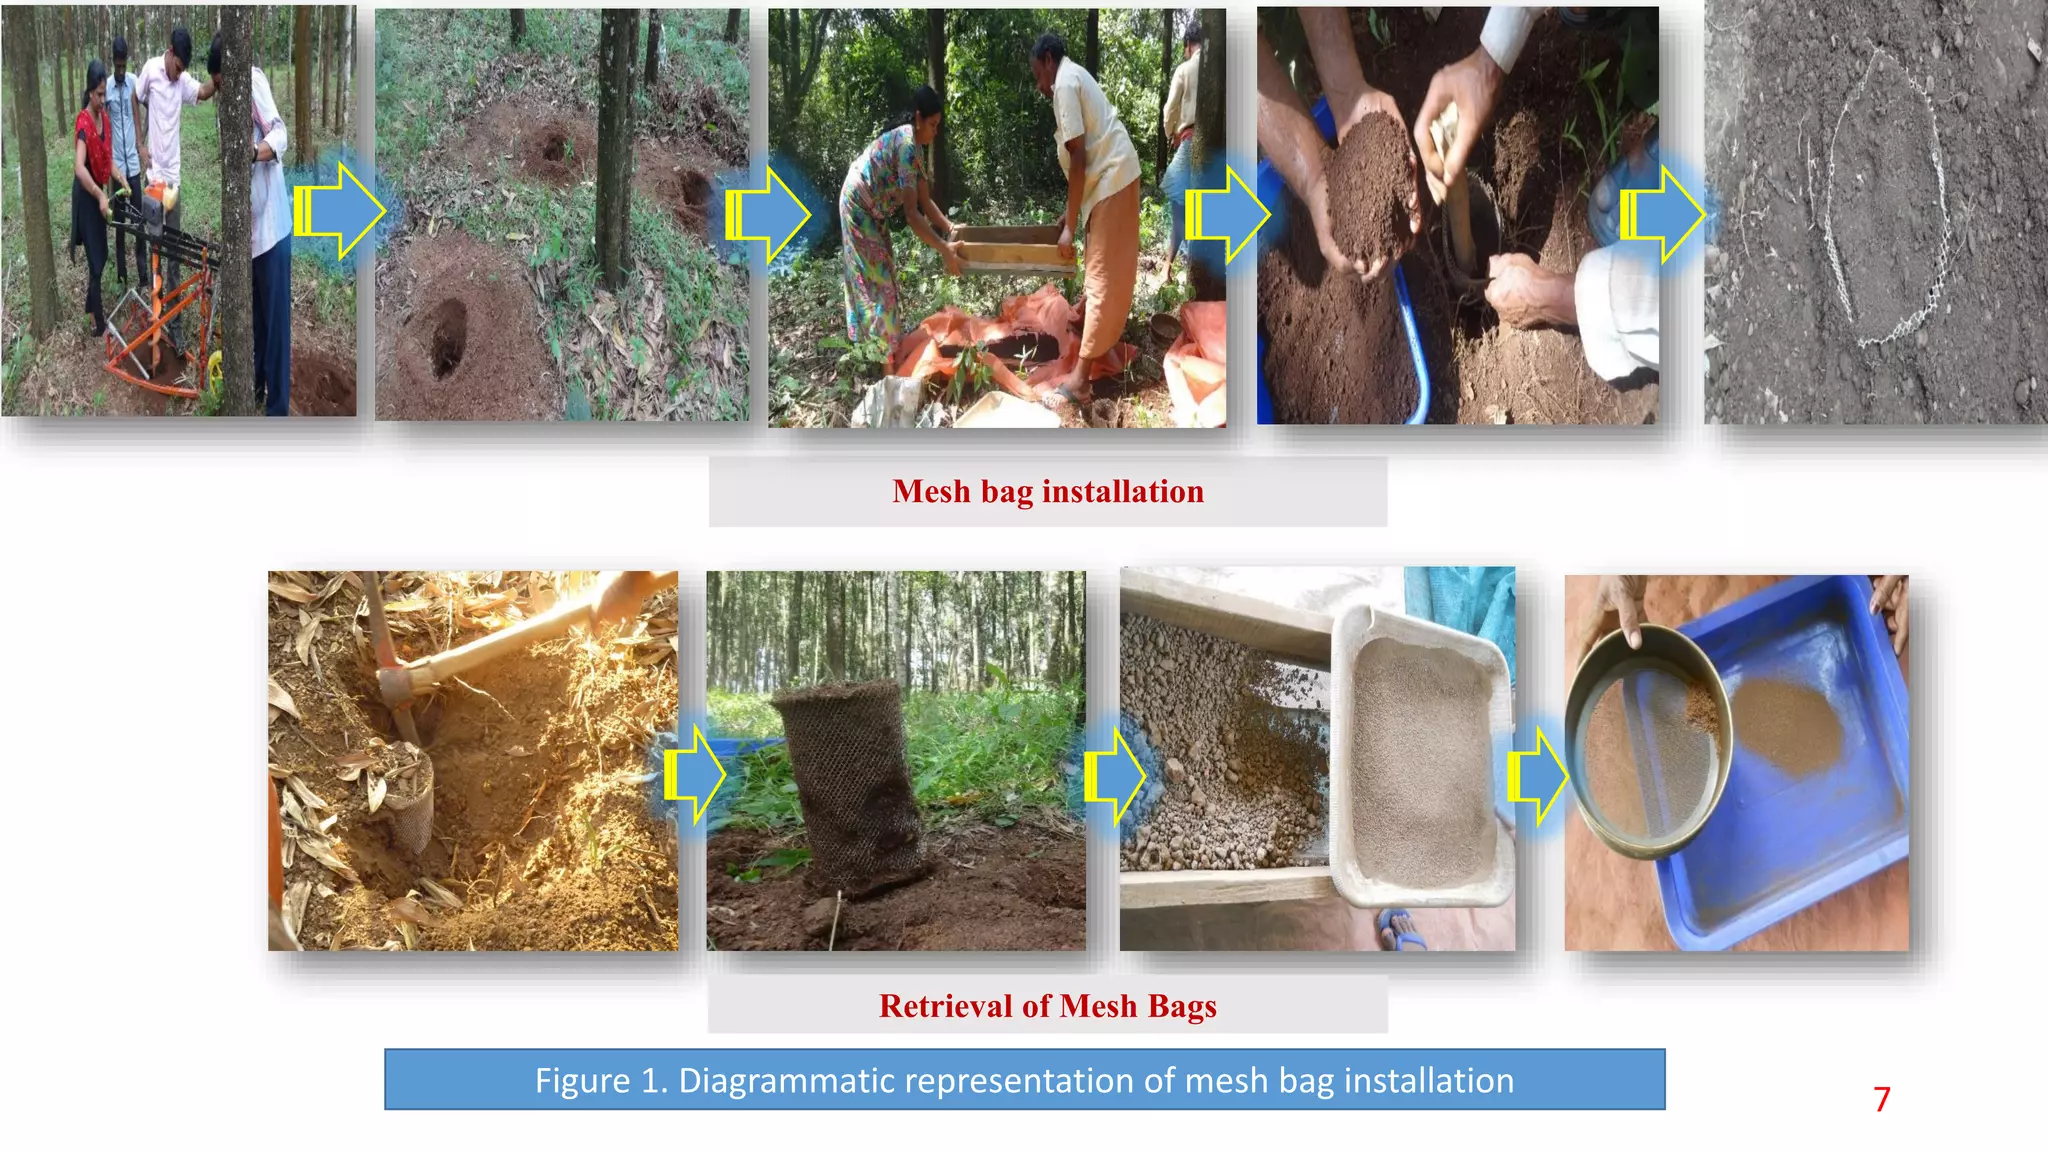
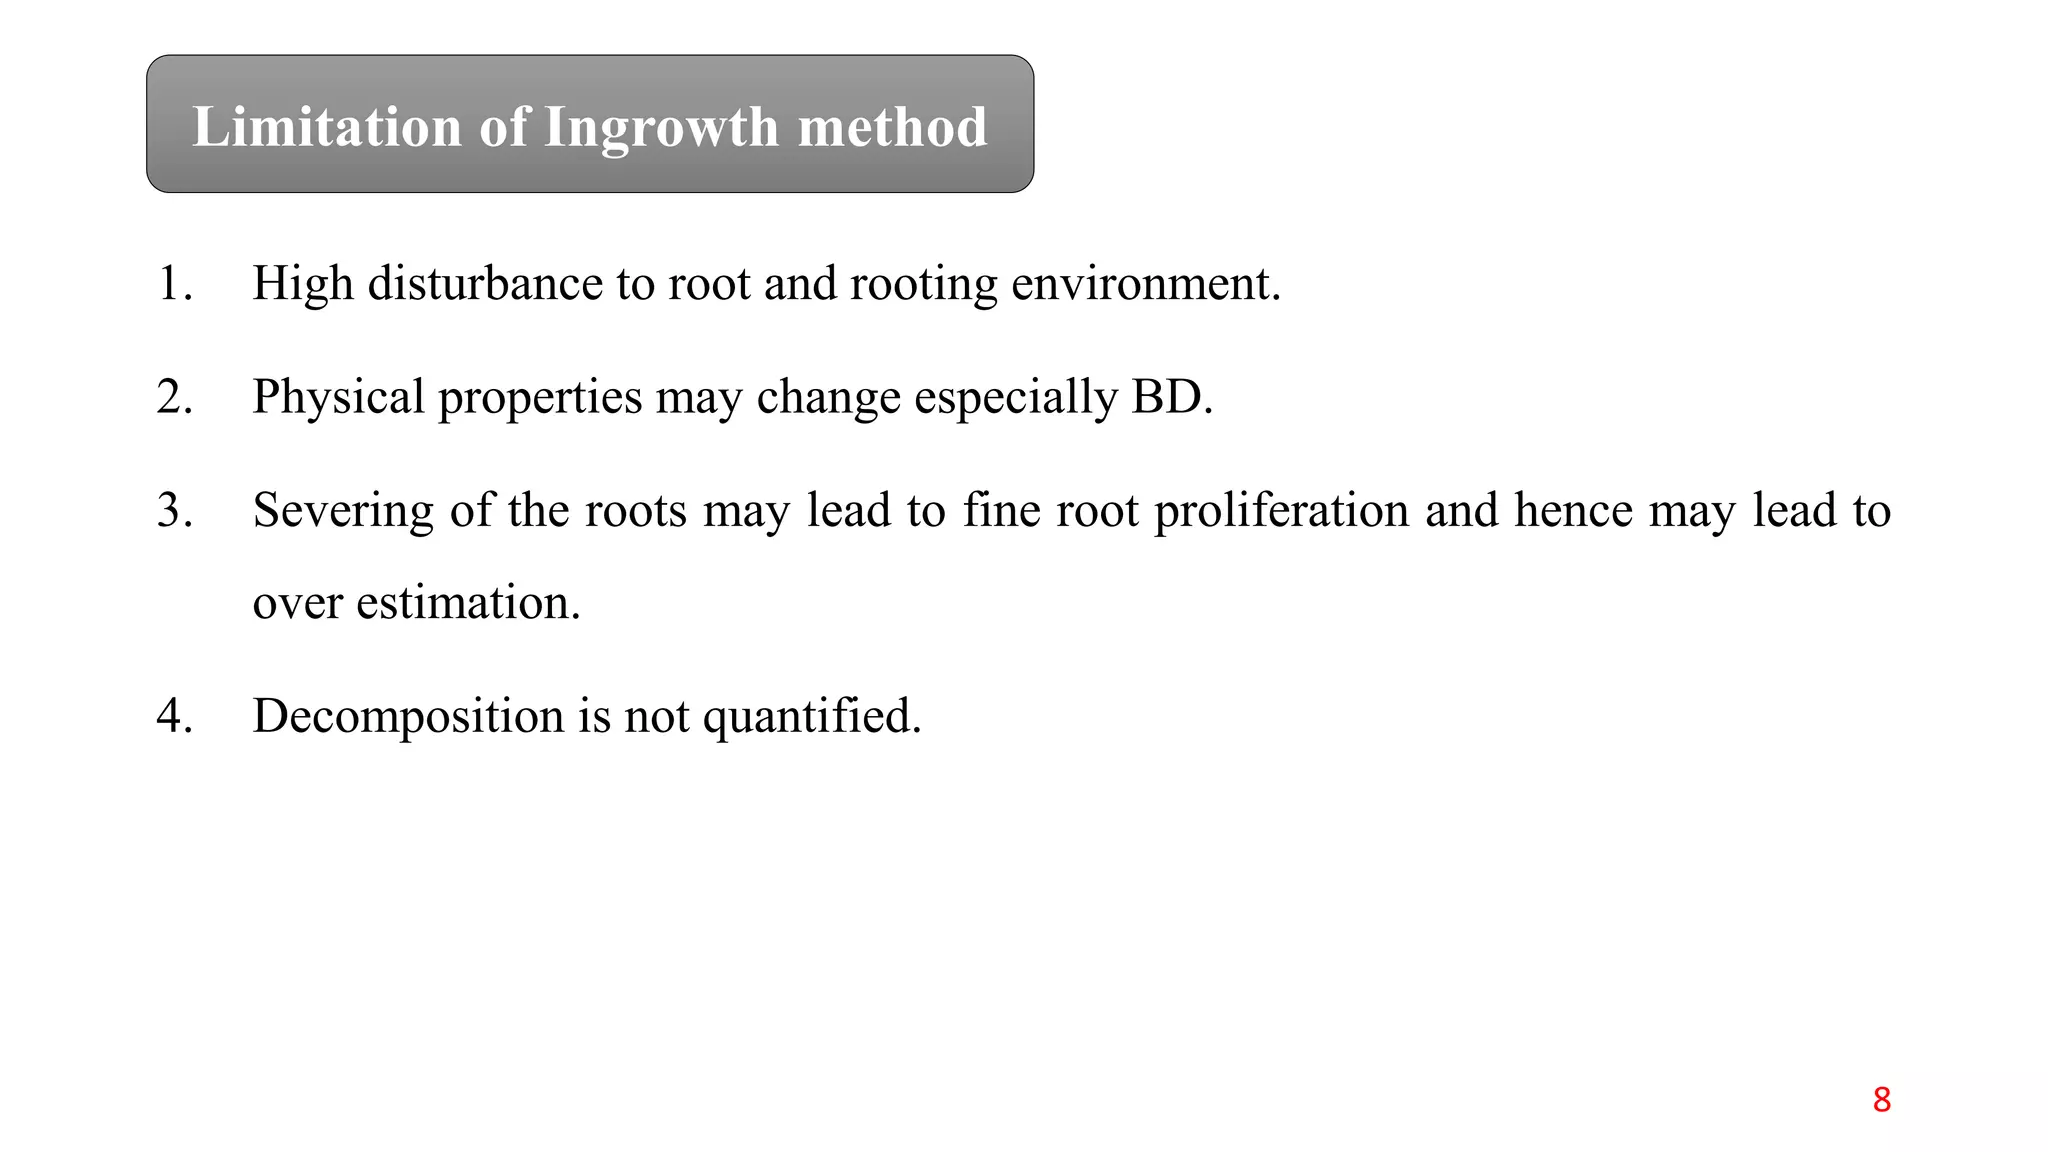
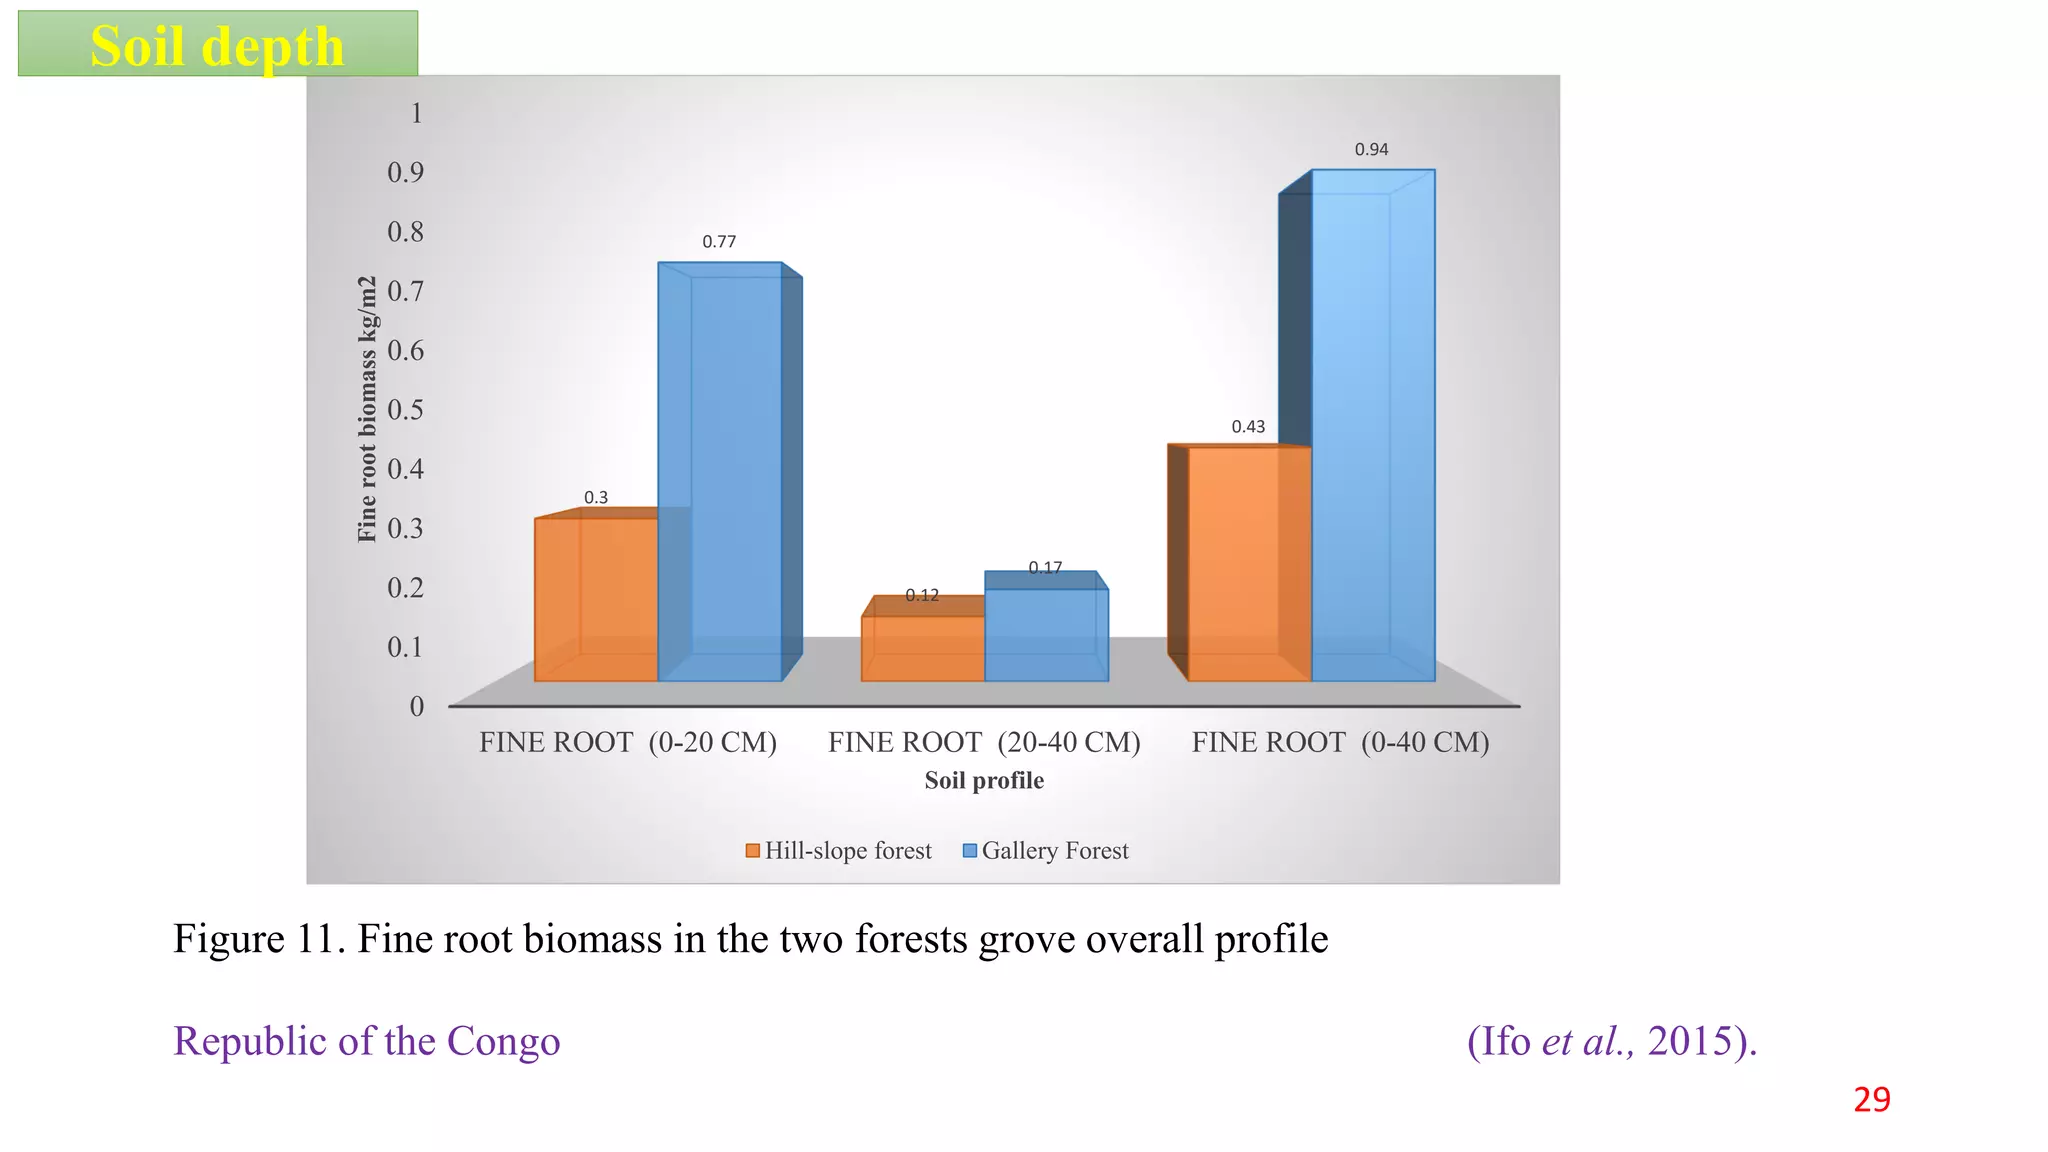
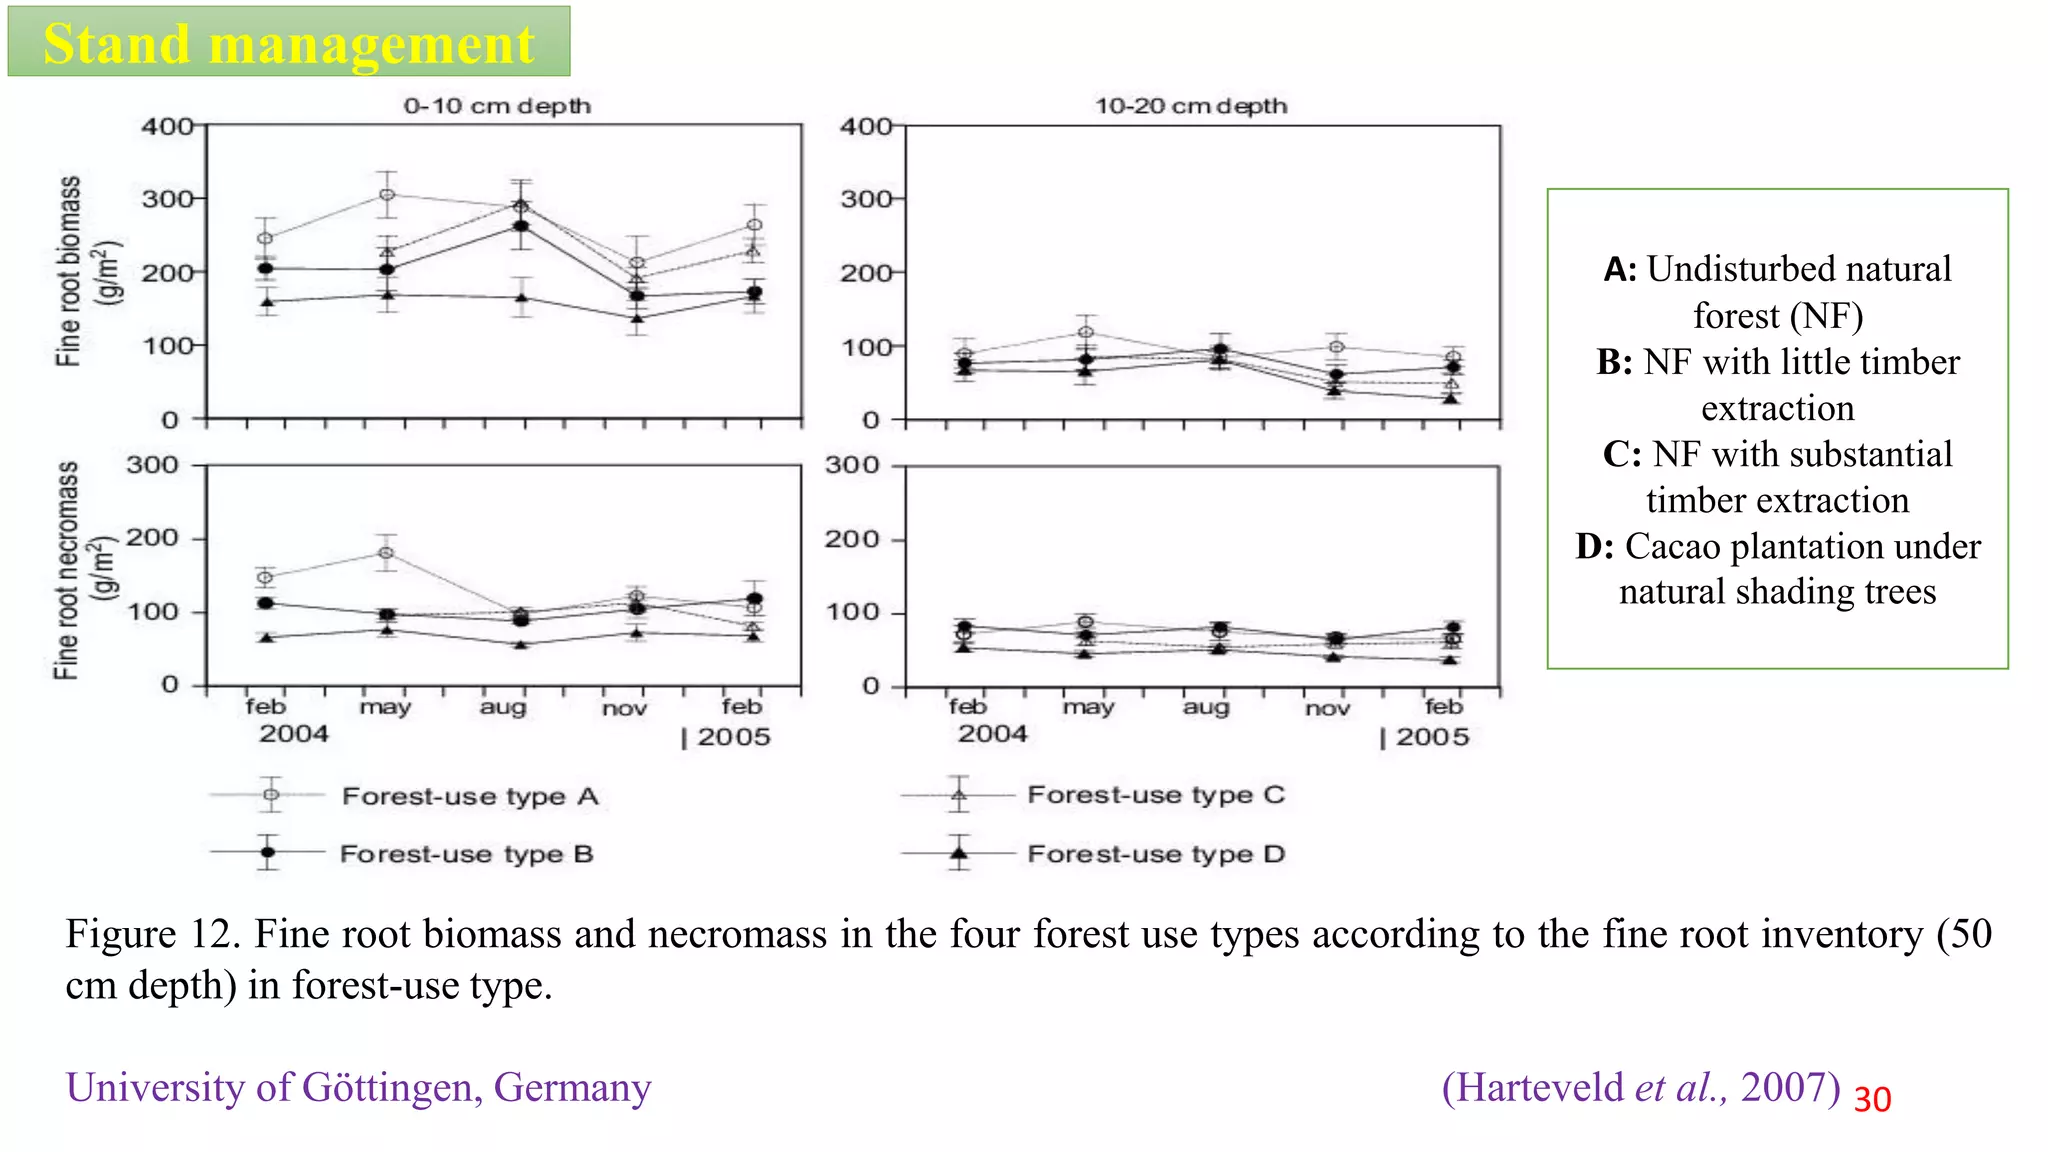
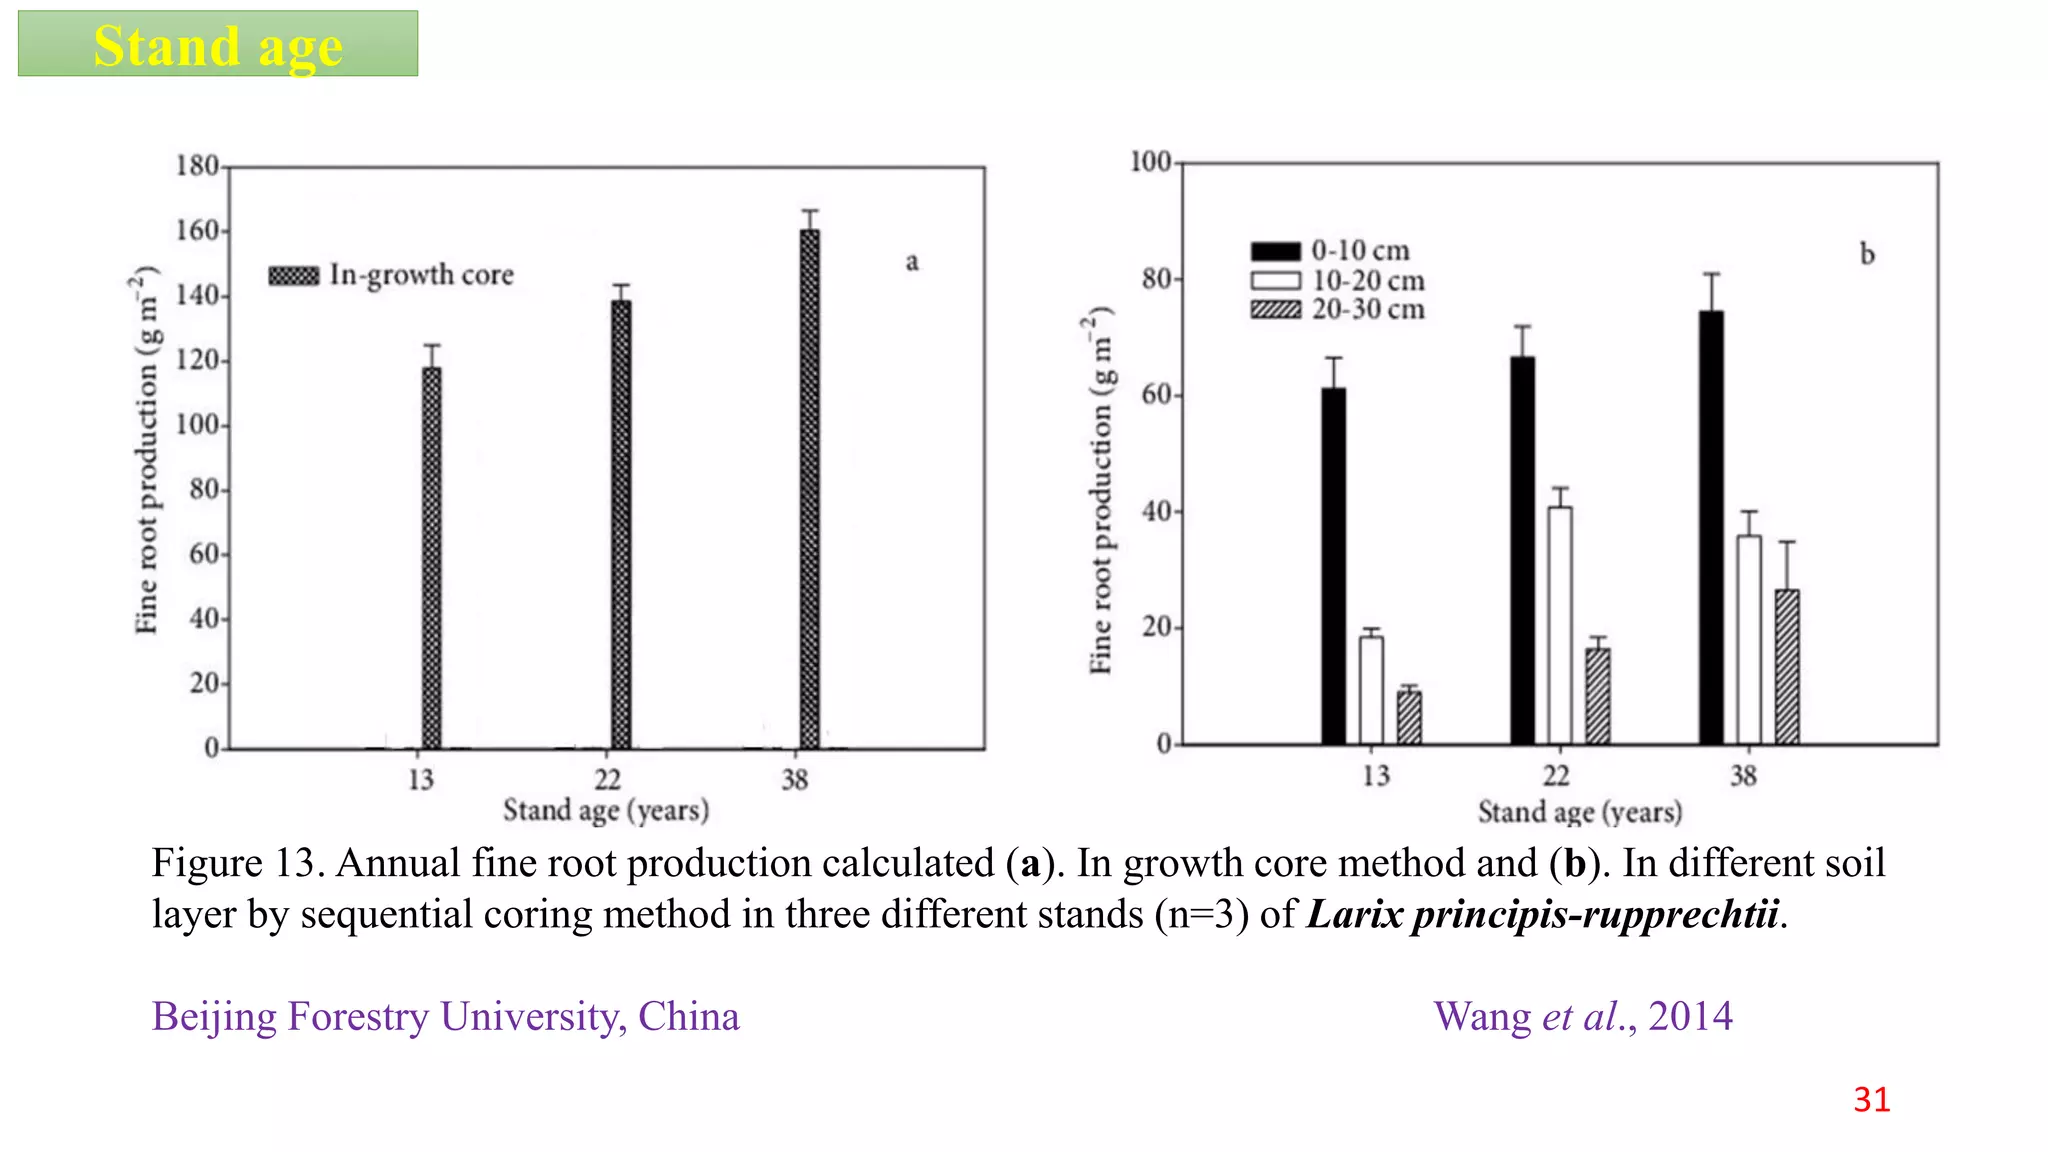
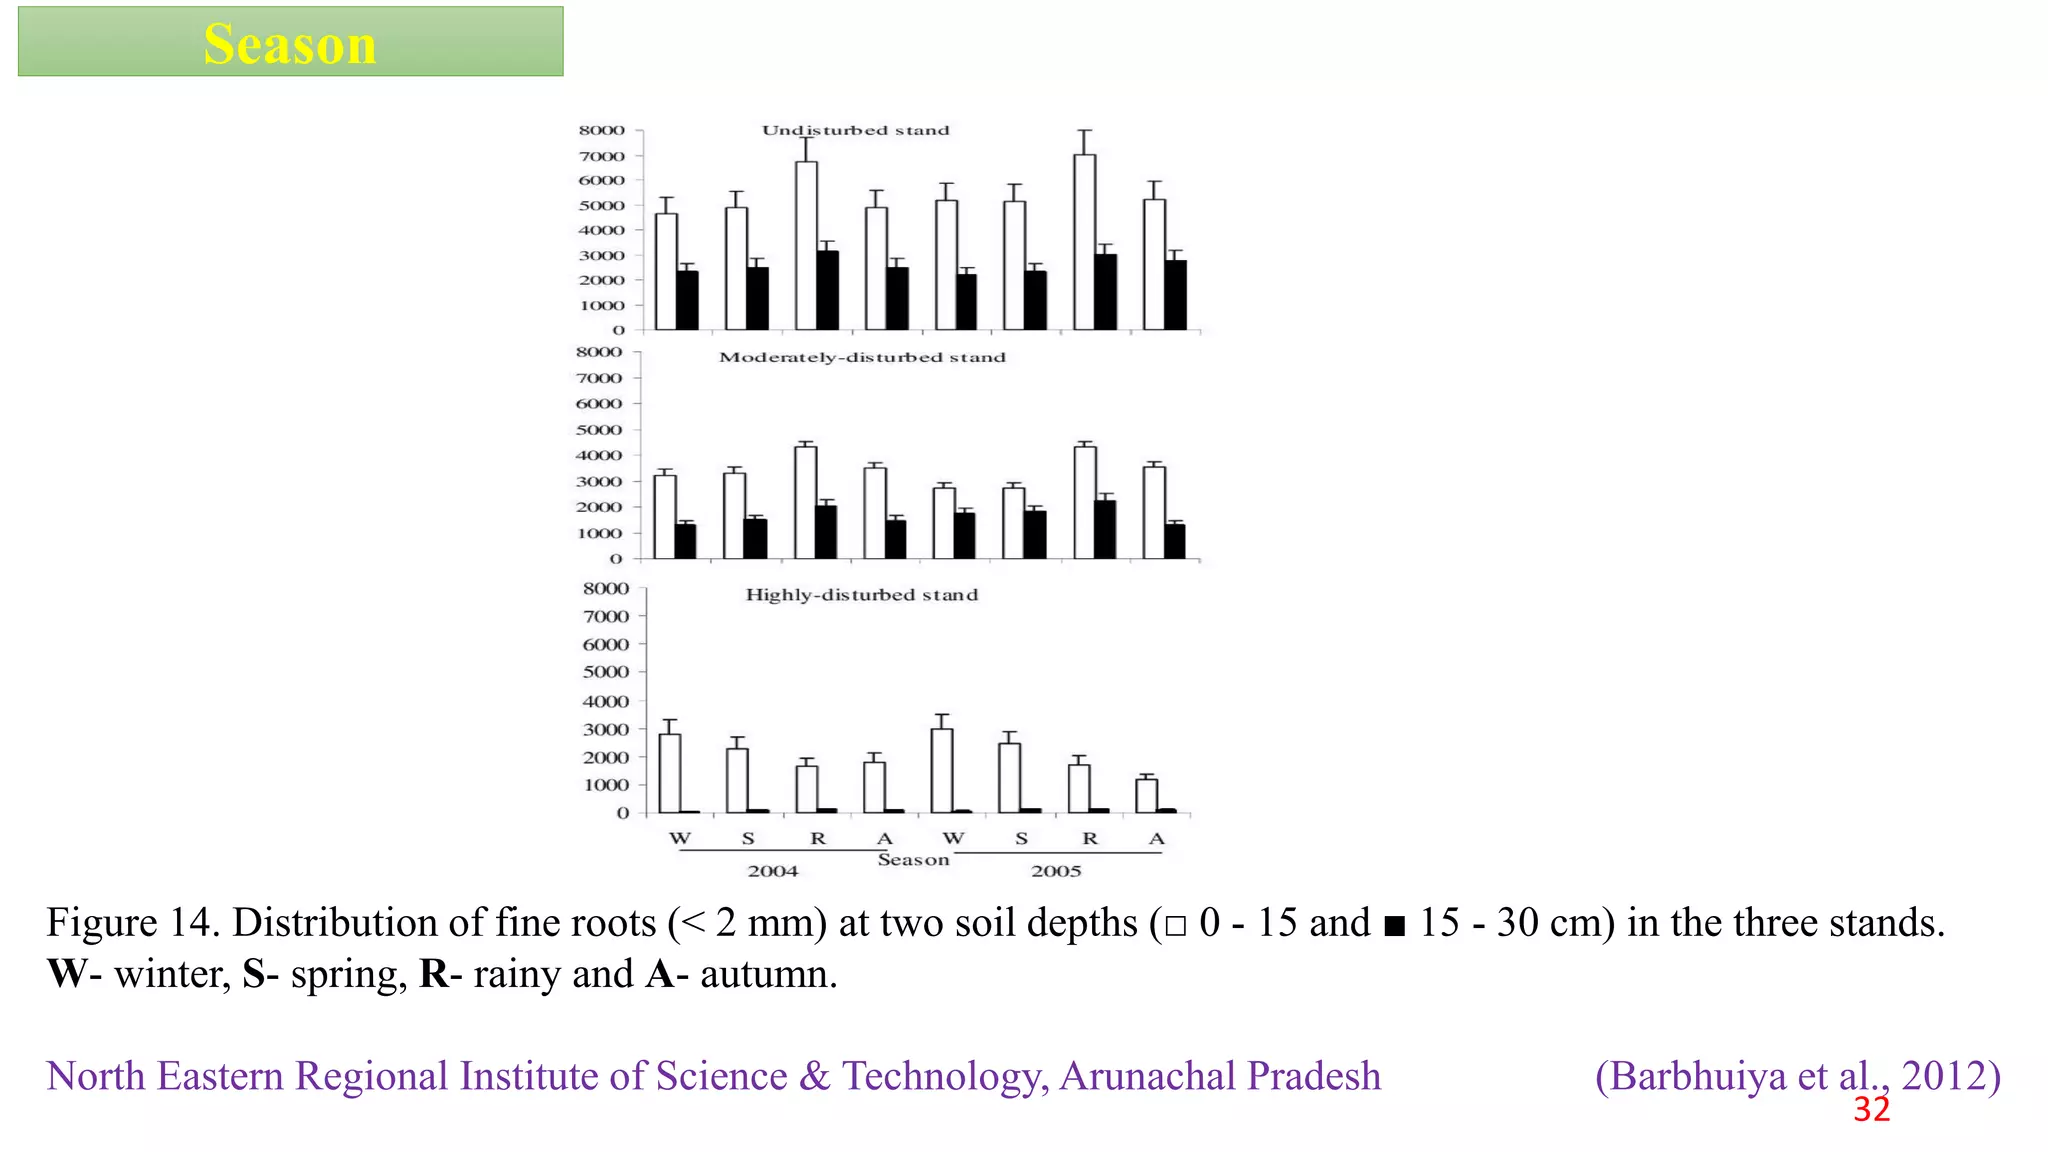
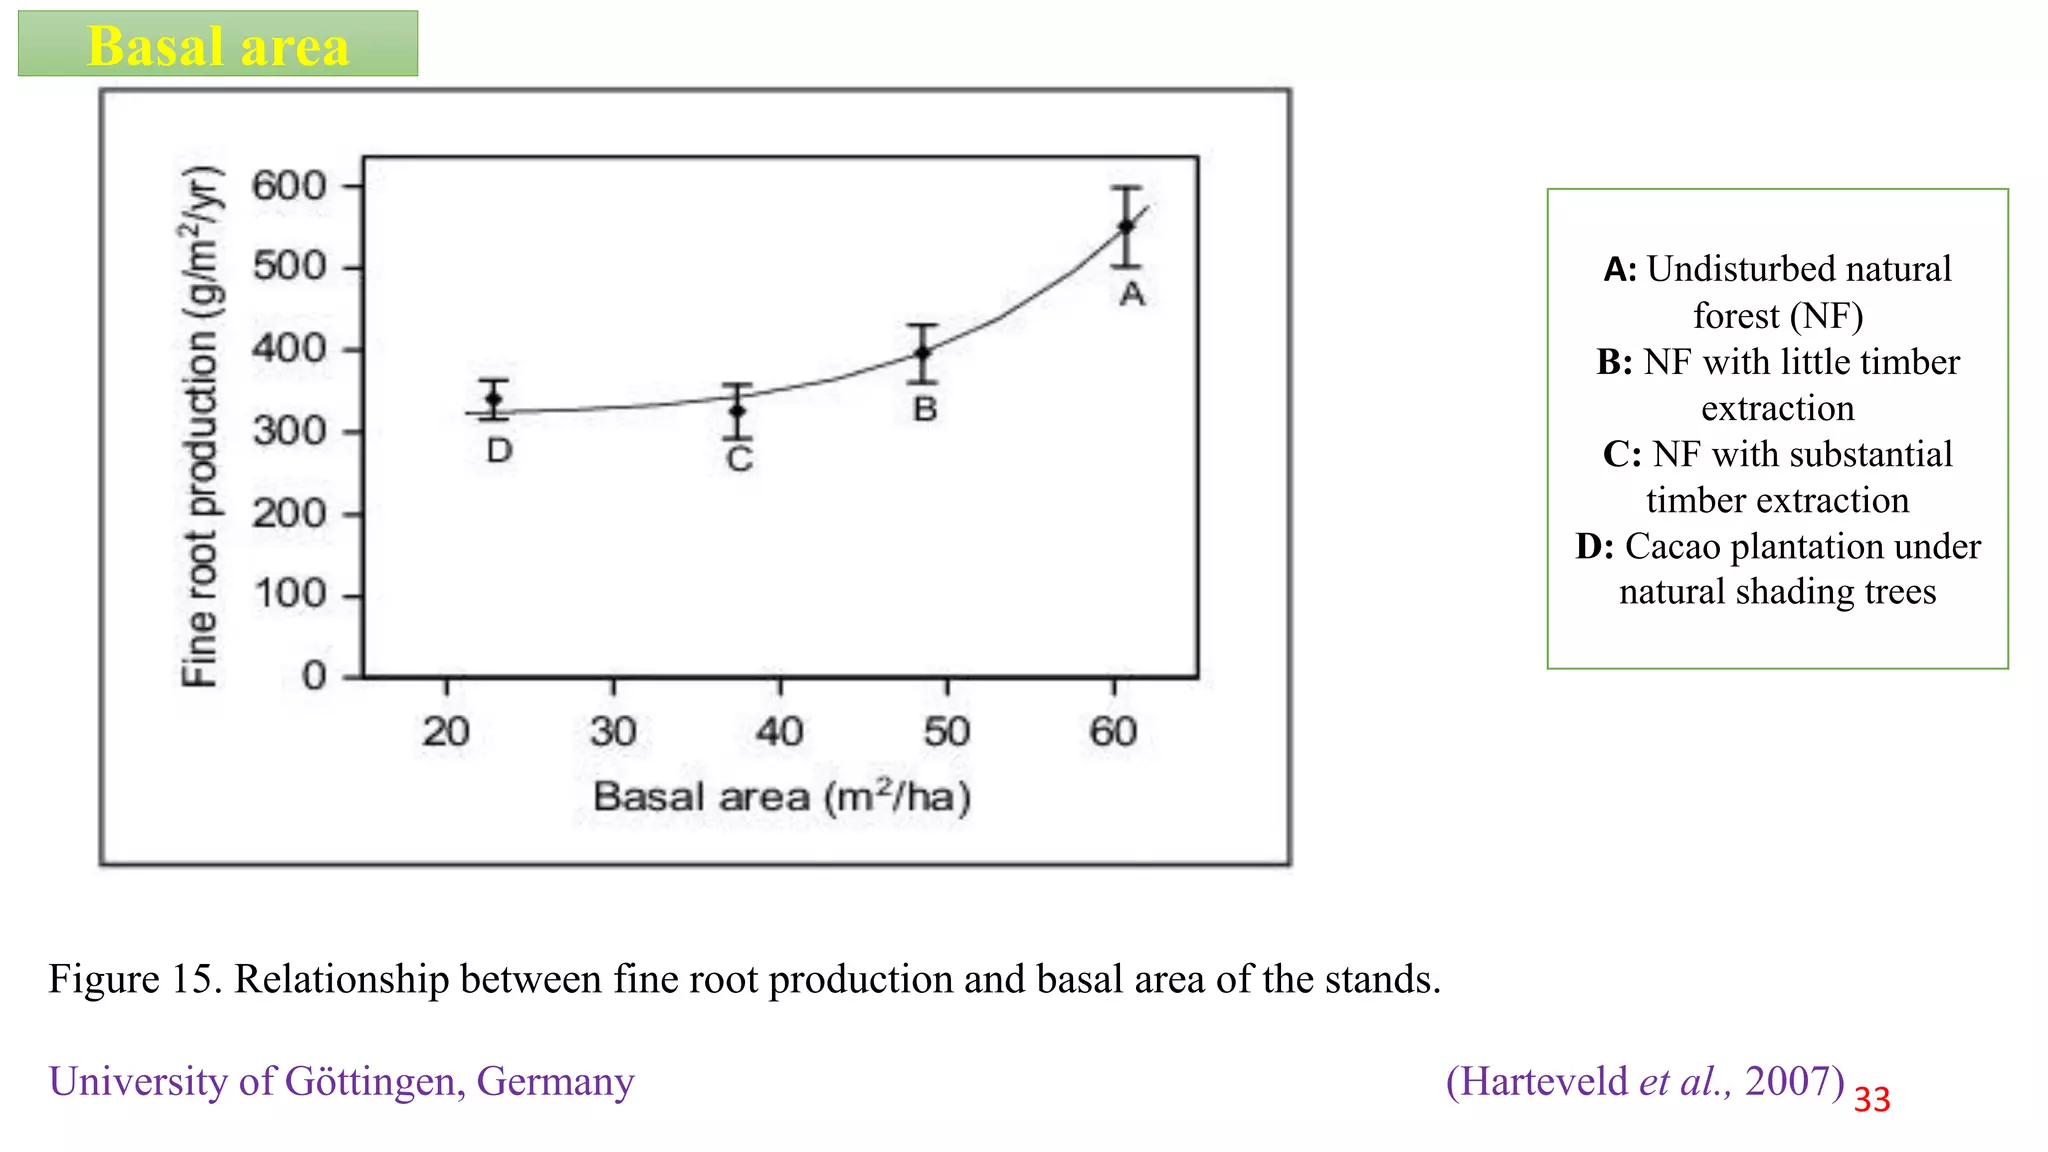
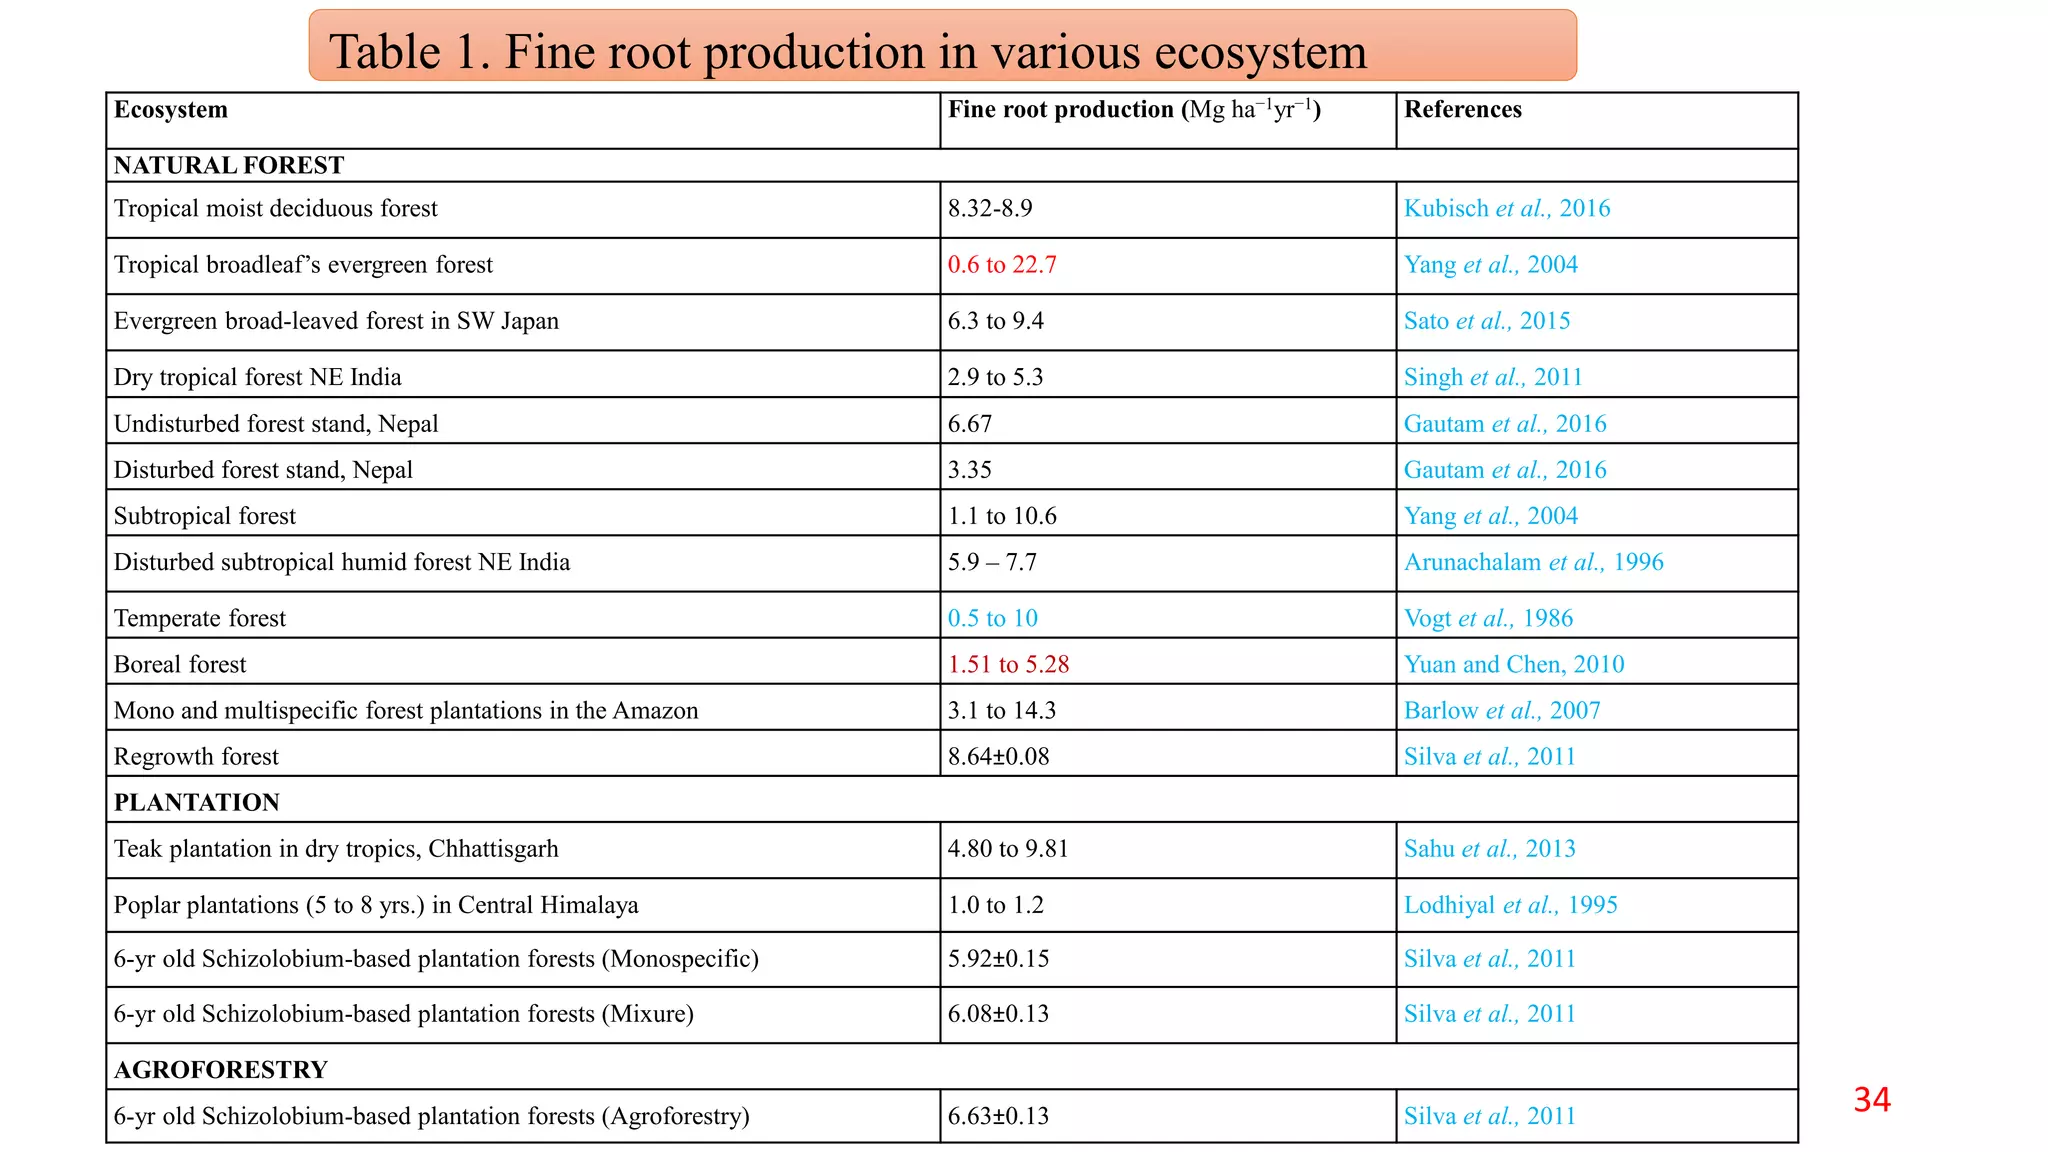
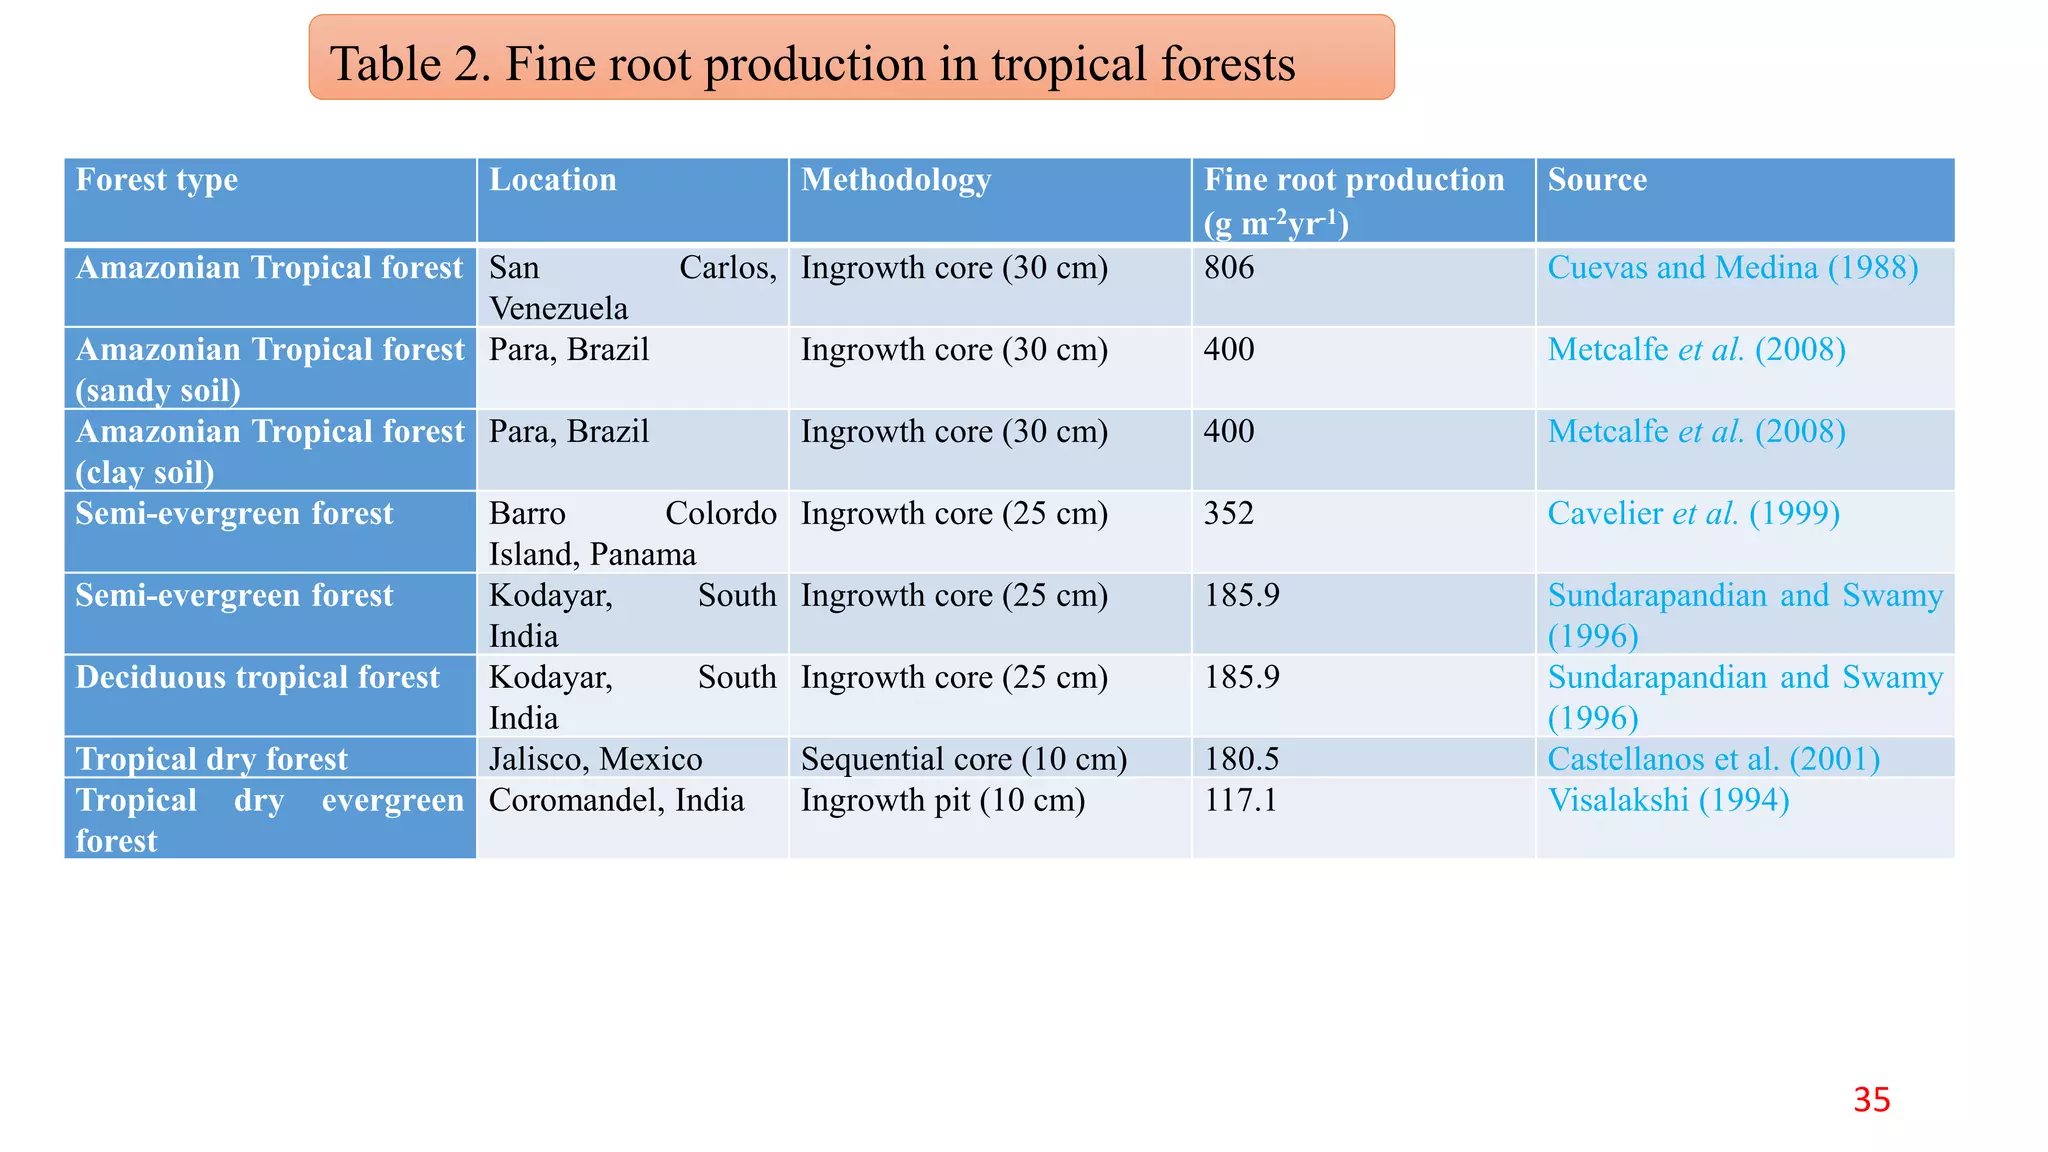

This document discusses fine root dynamics in trees. It begins with an introduction to fine roots, noting their key characteristics and role in nutrient cycling. It then covers various methods to estimate fine root production and biomass, including direct methods like ingrowth bags and sequential coring, and indirect methods like nitrogen budgeting and allometric equations. Factors that influence fine root production are also examined, such as CO2, soil depth, stand management, and stand age. The document concludes with tables summarizing estimated fine root production values across different ecosystems and forests. It identifies a need for more research on fine root production of tropical species and their nutrient recycling roles at the ecosystem scale.


![Fred[1]](https://cdn.slidesharecdn.com/ss_thumbnails/fred1-170308172302-thumbnail.jpg?width=640&height=640&fit=bounds)


