Growth and Instability of OIlseeds Production in Odisha

This document analyzes the growth and instability of oilseed production, with a focus on groundnut, across districts in Odisha, India over two time periods: 1995-1996 to 2004-2005 and 2005-2006 to 2014-2015. It finds that while groundnut production experienced overall negative growth in the first period, the second period saw remarkable improvement in growth rates for both groundnut and total oilseed production across most districts. However, 9 districts still saw negative growth rates for groundnut in the second period. Instability in production generally improved over the two periods as well, but 13 districts faced high instability levels in the second period that require targeted policy interventions. The study aims to identify clusters of districts by instability levels to

Recommended
More Related Content
What's hot
What's hot (20)
Similar to Growth and Instability of OIlseeds Production in Odisha
Similar to Growth and Instability of OIlseeds Production in Odisha (20)
More from Southern Range, Berhampur, Odisha
More from Southern Range, Berhampur, Odisha (20)
Recently uploaded
Recently uploaded (9)
Growth and Instability of OIlseeds Production in Odisha
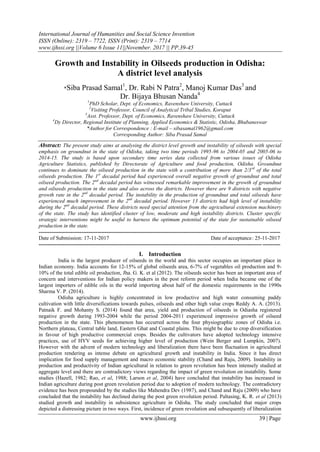
- 1. International Journal of Humanities and Social Science Invention ISSN (Online): 2319 – 7722, ISSN (Print): 2319 – 7714 www.ijhssi.org ||Volume 6 Issue 11||November. 2017 || PP.39-45 www.ijhssi.org 39 | Page Growth and Instability in Oilseeds production in Odisha: A district level analysis *Siba Prasad Samal1 , Dr. Rabi N Patra2 , Manoj Kumar Das3 and Dr. Bijaya Bhusan Nanda4 1 PhD Scholar, Dept. of Economics, Ravenshaw University, Cuttack 2 Visiting Professor, Council of Analytical Tribal Studies, Koraput 3 Asst. Professor, Dept. of Economics, Ravenshaw University, Cuttack 4 Dy Director, Regional Institute of Planning, Applied Economics & Statistic, Odisha, Bhubaneswar *Author for Correspondence : E-mail – sibasamal1962@gmail.com Corresponding Author: Siba Prasad Samal Abstract: The present study aims at analysing the district level growth and instability of oilseeds with special emphasis on groundnut in the state of Odisha, taking two time periods 1995-96 to 2004-05 and 2005-06 to 2014-15. The study is based upon secondary time series data collected from various issues of Odisha Agriculture Statistics, published by Directorate of Agriculture and food production, Odisha. Groundnut continues to dominate the oilseed production in the state with a contribution of more than 2/3rd of the total oilseeds production. The 1st decadal period had experienced overall negative growth of groundnut and total oilseed production. The 2nd decadal period has witnessed remarkable improvement in the growth of groundnut and oilseeds production in the state and also across the districts. However there are 9 districts with negative growth rate in the 2nd decadal period. The instability in the production of groundnut and total oilseeds have experienced much improvement in the 2nd decadal period. However 13 districts had high level of instability during the 2nd decadal period. These districts need special attention from the agricultural extension machinery of the state. The study has identified cluster of low, moderate and high instability districts. Cluster specific strategic interventions might be useful to harness the optimum potential of the state for sustainable oilseed production in the state. --------------------------------------------------------------------------------------------------------------------------------------- Date of Submission: 17-11-2017 Date of acceptance: 25-11-2017 --------------------------------------------------------------------------------------------------------------------------------------- I. Introduction India is the largest producer of oilseeds in the world and this sector occupies an important place in Indian economy. India accounts for 12-15% of global oilseeds area, 6-7% of vegetables oil production and 9- 10% of the total edible oil production, Jha. G. K. et al (2012). The oilseeds sector has been an important area of concern and interventions for Indian policy makers in the post reform period when India became one of the largest importers of edible oils in the world importing about half of the domestic requirements in the 1990s Sharma V. P. (2014). Odisha agriculture is highly concentrated in low productive and high water consuming paddy cultivation with little diversifications towards pulses, oilseeds and other high value crops Reddy A. A. (2013). Patnaik F. and Mohanty S. (2014) found that area, yield and production of oilseeds in Odiasha registered negative growth during 1993-2004 while the period 2004-2011 experienced impressive growth of oilseed production in the state. This phenomenon has occurred across the four physiographic zones of Odisha i.e. Northern plateau, Central table land, Eastern Ghat and Coastal plains. This might be due to crop diversification in favour of high productive commercial crops. Besides the cultivators have adopted technology intensive practices, use of HYV seeds for achieving higher level of production (Wein Berger and Lumpkin, 2007). However with the advent of modern technology and liberalization there have been fluctuation in agricultural production rendering as intense debate on agricultural growth and instability in India. Since it has direct implication for food supply management and macro economic stability (Chand and Raju, 2009). Instability in production and productivity of Indian agricultural in relation to green revolution has been intensely studied at aggregate level and there are contradictory views regarding the impact of green revolution on instability. Some studies (Hazell, 1982; Rao, et al, 1988; Larson et al, 2004) have concluded that instability has increased in Indian agriculture during post green revolution period due to adoption of modern technology. The contradictory evidence has been propounded by the studies like Mahendra Dev (1987), and Chand and Raju (2009) who have concluded that the instability has declined during the post green revolution period. Paltasing, K. R. et al (2013) studied growth and instability in subsistence agriculture in Odisha. The study concluded that major crops depicted a distressing picture in two ways. First, incidence of green revolution and subsequently of liberalization
- 2. Growth and Instability in Oilseeds production in Odisha…… www.ijhssi.org 40 | Page have not provided and improvement in agricultural sector. Second, the irrigation development has been very slow and consequently much of the cultivated land is still rain fed in Odisha. This hinders the growth of agriculture on one hand and augments risk on the other. Even though production of oilseeds has great economic and nutritional value, its growth and instability need to be studied thoroughly. However there are limited studies on growth performance oilseeds at national and state level. Specifically district level of growth of production of oilseeds in the content of Odisha is lacking. More over the research on instability in oilseed production is also lacking. The present study aims at analysing the district level growth and instability of oilseeds with special emphasis on groundnut in the state of Odisha, taking two time periods 1995-96 to 2004-05 and 2005-06 to 2014-15. II. Data Base and Methodology The study made use of secondary time series data collected from various issues of Odisha Agriculture Statistics, published by Directorate of Agriculture and food production, Odisha. To examine growth and instability of total oilseeds across the districts of the state, annual compound growth rates have been calculated for two decadal periods, viz, period I (1995-96 to 2004-05) and period II (2005-06 to 2014-16). Analysis has been made crop wise with respect to production. ACGR for production was estimated as follows: 𝑌𝑡 = 𝐴𝑏 𝑡 Where 𝑌𝑡 = Production in tth period. B = 1+r and r = Compound growth rate of Y. A = Initial year production and t = Time in years After log transformation and estimation of the above function as In 𝑌𝑡 = lnA + t.lnb, Compound growth rate has been estimated as r = {antilog (lnb) – 1} x100 III. Instability Index: Cuddy-Della Valle Index The instability in production at total oilseeds in Odisha was examined by estimating Cuddy-Della Valle Index for production. To measure the instability of economic variables, Cuddy-Della Valle Index (corrected coefficient of variation) is used which considers the long term trend. Therefore, to examine the extent of risk involved in total oilseeds production the instability in the total oilseeds. Production in Odisha was estimated by using Cuddy-Della Valle Index as: 𝐼 = 𝐶𝑉 × 1 − 𝑅2 0.5 Where I = Instability index (percent); CV = Coefficient of variation (percent); from a time trend regression adjusted by the number of degrees of freedom and R = Coefficient of determination. IV. Results And Discussion 4.1 Growth performance of groundnut Table 1 and Fig. 1 present trend of production of groundnut and total oilseeds during the period 1995- 96 to 2014-15. Erratic fluctuations in the production of groundnut and total oilseeds is noticed from the figure however the fluctuation appears to have smoothen during the period 2005-06 to 2014-15. Production of groundnut was 52.6% of the total oilseeds in the year 1995-96 which have increased to 68.1% in the year 2014- 15. Groundnut has assumed significant importance among the oilseeds in the state. In the year 1995-96 the production of groundnut was 450.2 000’ MT. This became 351.3 000’ MT in the year 2004-05 and increased to 463.3 000’ MT in the year 2014-15 using this 20 year period 1995-96 to 2014-15 groundnut production experienced 2.6% ACGR (Table 2). The growth rate in the 1st decadal period from 1995-96 to 2004-05 was - 1.6% while the growth rate in the 2nd decadal period was impressive at 2.8%. Table 1 Trend of Production of Groundnut and Total oilseeds in Odisha (In 000’ MT) Year Groundnut Total Oilseeds Groundnut as % of Total oilseeds 1995-96 450.2 855.3 52.6 1996-97 285.0 497.3 57.3 1997-98 315.5 545.7 57.8 1998-99 260.9 454.4 57.4
- 3. Growth and Instability in Oilseeds production in Odisha…… www.ijhssi.org 41 | Page 1999-00 360.3 568.4 63.4 2000-01 228.4 373.6 61.1 2001-02 333.6 539.6 61.8 2002-03 217.2 322.6 67.3 2003-04 336.7 498.4 67.6 2004-05 351.3 527.3 66.6 2005-06 342.4 550.8 62.2 2006-07 378.9 599.8 63.2 2007-08 428.9 676.1 63.4 2008-09 458.6 702.7 65.3 2009-10 398.9 619.1 64.4 2010-11 416.1 638.0 65.2 2011-12 435.4 663.7 65.6 2012-13 467.3 689.9 67.7 2013-14 478.3 698.6 68.5 2014-15 463.3 679.9 68.1 Source : Various issues of Odisha Agriculture Statistics, Directorate of Agriculture and Food Production, Odisha, Bhubaneswar MT : Metric Ton District wise ACGR of production of groundnut is presented in Table 3. In the 1st decadal period the minimum ACGR of -17.1% was observed in Keonjhar district and maximum of 11% was observed in Boudh district. The median ACGR was -2.8% (Q1 – Q3 = -6.3% - 1.28%). As many as 20 districts had experienced negative growth rate while 10 districts had positive growth rate. In the 2nd decadal period minimum growth rate was -10.8% in Nawarangpur district and maximum was 15% in Sonepur district. The median was 2.85 % with IQ : -0.7% to 6.18%. This implied much better performance in the growth of groundnut production across the districts. Nevertheless 10 districts had negative growth rate in the 2nd decadal period in comparison to 20 in the 1st decade. Table 2 Annual compound growth rate of Groundnut Total Oilseeds in Odisha (In Percentage) Crops Time period 1995-96 to 2014- 15 1995-96 to 2004-05 2005-06 to 2014-15 Groundnut 2.6 -1.6 2.8 Total Oilseeds 1.6 -4.1 1.8 Source : Author’s calculation from Odisha Agriculture Statistics (various issues) ACGR : Annual Compound Growth Rate 4.2Growth performance of Total oilseeds Total oilseeds comprised of groundnut, till, mustard and other oilseeds in Odisha. Total oilseed production in the state was 855.3 000’ MT in the year 1995-96 which became 527.3 000’ MT in 2004-05 and 679.9 000’ MT in the year 2014-15. During the entire 20 years period total oilseed production has increased at as ACGR 1.6% (Table 2). However in the 1st decadal period there was a negative growth rate of -4.1% and the 0 500 1000 1995-96 1996-97 1997-98 1998-99 1999-00 2000-01 2001-02 2002-03 2003-04 2004-05 2005-06 2006-07 2007-08 2008-09 2009-10 2010-11 2011-12 2012-13 2013-14 2014-15 000'MT Fig. 1 Trend of Production of Groundnut and Total oilseed in Odisha Groundnut Total Oilseeds
- 4. Growth and Instability in Oilseeds production in Odisha…… www.ijhssi.org 42 | Page 2nd decadal period has witnessed a better growth performance of total oilseed production in the state with as ACGR of 1.8%. District wise ACGR of total oilseeds production is presented in Table 3. During the 1st decade minimum ACGR was -14% in Kandhamal district and maximum of 6.6% was in Jajpur district. The median value was -5.7% with IQR: -8.03% to -1.7%. During this period 25 districts had negative ACGR. In the 2nd decade the minimum ACGR was -8.1% in Nawarangpur and maximum was 9.2% in Sonepur districts. This implied much better performance during the 2nd decadal period in comparison to 1st decade. However there were 9 districts with negative growth rate in the 2nd decadal period. Both groundnut and total oilseeds have experienced negative growth rate in the 1st decadal period and impressive positive growth rate during the 2nd decadal period. The poor performance of growth during the 1st decadal period was attributed to manifestation of vagaries of natural calamities like super cyclone in 1999-2000, severe drought in 2002-03 and low investment on agriculture during this period. On the other hand the better performance of growth in the 2nd decadal period was achieved because greater focus by Government both center and state by way of lunching several schemes of the programs like NFM, RKVY etc. Besides various state agricultural policies were also implemented for the development of agriculture. Focus was given on input management, agricultural research and education, creation of irrigation potential and promotion of agricultural entrepreneurship agricultural marketing technology up gradation etc. Table 3 District wise Annual Compound Growth Rate of Production Groundnut and Total oilseeds in Odisha Districts Groundnut Total Oilseeds 1995-96 to 2004-05 2005-06 to 2014-15 1995-96 to 2004-05 2005-06 to 2014- 15 Angul -4.4 7.4 -5.4 3.9 Balasore 0.5 5.4 -1.4 6.5 Bargarh -8.2 -2.1 -8.2 -1.7 Bhadrak 3.1 4 1 4.6 Bolangir -6.4 2.9 -6.4 0.4 Boudh 11 -2.9 2.6 0.2 Cuttack -6 3.1 -6.3 2.6 Deogarh 2.1 -0.6 -3.4 -2.9 Dhenkanal -1.3 2.6 -6 2.7 Gajapati -6.6 9.5 -3.2 2.7 Ganjam 0 2.8 1 1.4 Jagatsinghpur 0.9 -0.7 -0.1 -1 Jajpur 7.9 0.3 6.6 0.2 Jharsuguda -3.3 -1.9 -3.8 -4.3 Kalahandi -3.5 4.7 -4.4 1.5 Kandhamal -8.4 2.5 -14 1.8 Kendrapara -0.9 -3.4 -0.8 -3.1 Keonjhar -17.1 6.1 -13.8 4.2 Khurda -8.1 -3.4 -7.5 -3 Koraput 5.8 13.8 -9.2 -3.3 Malkangiri 9.9 11.9 3.7 5.7 Mayurbhanj -0.5 12.2 -6.3 6.4 Nayagarh -5.6 -2.6 -10.6 1.7 Nowrangpur 1.4 -10.8 -8.3 -8.1 Nuapada -5.6 6.2 -5.4 4.9 Puri -2.3 5 -2.6 5.2 Raygada 10.1 2.2 -6.9 1.4 Sambalpur -13.6 -0.7 -9.6 -5.9 Sonepur -4.3 15 -6.7 9.2 Sundargarh -14.9 7.7 -11.8 7.8 Min -17.1 -10.8 -14 -8.1 Max 11 15 6.6 9.2 Q1 -6.3 -0.7 -8.03 -1.53 Q2 (Median) -2.8 2.85 -5.7 1.6 Q3 1.28 6.18 -1.7 4.5 Source : Author’s calculation from Odisha Agriculture Statistics (various issues) 4.3 Instability in groundnut production
- 5. Growth and Instability in Oilseeds production in Odisha…… www.ijhssi.org 43 | Page Instability in groundnut production is presented in Table 4 over the entire period of 20 years the instability was 16.5%. The instability in the 1st decade was 22.7% and 6.32% in the 2nd decade. The instability was very low in the 2nd decade while it was moderate in the 1st decade. Table 4 Instability of Production of Groundnut and Total oilseeds in Odisha (In Percentage) Crops Time period 1995-96 to 2014-17 1995-96 to 2004-07 2005-06 to 2014-17 Ground Nut 16.50 22.71 6.32 All Oilseeds 19.96 24.89 5.92 Source : Author’s calculation from Odisha Agriculture Statistics (various issues) ACGR : Annual Compound Growth Rate District wise instability is presented in Table 5. Table 6 provides classification of districts according to low, moderate and high instability. During the 1st decadal period only one district had low, 14 moderate and 15 high level of instability in the production of groundnut. In the 2nd decadal period 7 districts had low, 10 moderate and 13 high level of instability. The level of instability has reduced during the 2nd decadal nevertheless there are many districts with high and moderate level of instability. The overall analysis implied that even though the instability which is a measure of risk has reduced at the aggregate level (state), it was larger ramification at district level. 4.4 Instability in total oilseed production Instability in total oilseed production at the state level is furnished in Table 4. For the entire time period the instability in oilseed production was 19.96%. This was 24.89% in the 1st decade and reduced to 5.92% in the 2nd decade. During the 2nd decadal period instability was very low which implied lesser fluctuation in the oilseed production indicating lower risk. Instability of oilseed production across the district is presented in Table 5 and Table 7. During the 1st decadal period instability was moderate in 12 and high in 18 districts. While in the 2nd decadal period instability was low in one moderate in 13 and high in 16 districts. Both in the production of groundnut and total oilseeds the instability has reduced to a very low level at the state level in the 2nd decadal period but across the district even though instability has reduced nevertheless many districts are in the moderate and high level of instability. Table 5 District wise Instability of Production of Groundnut and Total oilseeds in Odisha Districts Groundnut Total Oilseeds 1995-96 to 2004-05 2005-06 to 2014-15 1995-96 to 2004-05 2005-06 to 2014-15 Angul 23.01 6.52 33.98 23.05 Balasore 30.02 23.85 32.51 25.22 Bargarh 26.66 37.32 24.76 36.49 Bhadrak 26.22 24.88 24.09 21.05 Bolangir 21.38 23.93 27.01 35.92 Boudh 27.83 28.45 42.37 42.69 Cuttack 49.11 40.68 44.96 40.09 Deogarh 32.59 33.67 37.56 30.49 Dhenkanal 26.20 8.44 32.51 18.51 Gajapati 14.92 7.91 17.10 15.34 Ganjam 22.36 19.49 20.76 19.87 Jagatsinghpur 43.04 42.31 36.86 35.93 Jajpur 35.35 41.77 33.40 38.53 Jharsuguda 31.70 33.76 41.46 32.56 Kalahandi 20.75 9.34 23.63 24.40 Kandhamal 44.22 51.63 49.50 61.13 Kendrapara 39.57 26.47 39.16 27.39 Keonjhar 42.63 62.88 28.73 28.47 Khurda 55.06 61.21 50.68 57.23 Koraput 21.50 11.00 29.23 37.03 Malkangiri 58.80 66.49 53.58 55.28 Mayurbhanj 25.28 10.42 29.86 17.19 Nayagarh 18.84 26.46 35.06 46.29 Nowrangpur 50.88 24.01 37.47 15.79 Nuapada 31.50 18.16 34.76 22.66
- 6. Growth and Instability in Oilseeds production in Odisha…… www.ijhssi.org 44 | Page Puri 28.97 15.21 28.93 14.87 Raygada 38.83 41.93 44.94 45.67 Sambalpur 39.43 65.73 44.22 37.94 Sonepur 23.28 13.90 23.42 17.65 Sundargarh 26.29 48.02 22.19 30.12 Source: Author’s calculation from Odisha Agriculture Statistics (various issues) Table 6 Classification of Districts according to instability in the production of groundnut 1995-96 to 2004-05 2005-06 to 2014-15 Low (0-15) Moderate (15.01-29.99) High (>=30) Low (0-15) Moderate (15.01-29.99) High (>=30) Gajapati Angul Balasore Angul Balasore Bargarh Bargarh Cuttack Dhenkanal Bhadrak Cuttack Bhadrak Deogarh Gajapati Bolangir Deogarh Bolangir Jagatsinghpur Kalahandi Boudh Jagatsinghpur Boudh Jajpur Koraput Ganjam Jajpur Dhenkanal Jharsuguda Mayurbhanj Kendrapara Jharsuguda Ganjam Kandhamal Sonepur Nayagarh Kandhamal Kalahandi Kendrapara Nowrangpur Keonjhar Koraput Keonjhar Nuapada Khurda Mayurbhanj Khurda Puri Malkangiri Nayagarh Malkangiri Raygada Puri Nowrangpur Sambalpur Sonepur Nuapada Sundargarh Sundargarh Raygada Sambalpur Source : Author’s own calculation Table 7 Classification of Districts according to instability in the production of total oilseeds 1995-96 to 2004-05 2005-06 to 2014-15 Moderate (15.01-29.99) High (>=30) Low (0-15) Moderate (15.01-29.99) High (>=30) Bargarh Angul Puri Angul Bargarh Bhadrak Balasore Balasore Bolangir Bolangir Boudh Bhadrak Boudh Gajapati Cuttack Dhenkanal Cuttack Ganjam Deogarh Gajapati Deogarh Kalahandi Dhenkanal Ganjam Jagatsinghpur Keonjhar Jagatsinghpur Kalahandi Jajpur Koraput Jajpur Kendrapara Jharsuguda Mayurbhanj Jharsuguda Keonjhar Kandhamal Puri Kandhamal Mayurbhanj Khurda Sonepur Kendrapara Nowrangpur Koraput Sundargarh Khurda Nuapada Malkangiri Malkangiri Sonepur Nayagarh Nayagarh Raygada Nowrangpur Sambalpur Nuapada Sundargarh Raygada Sambalpur Source : Author’s own calculation V. Major Findings Groundnut production continues to dominate the oilseed production in the state. It contributes more than 2/3rd oilseed production. The growth performance of groundnut and oilseeds production at the state level and also across the districts has improved remarkably in the 2nd decadal period. The 1st decadal period had experienced overall negative growth of groundnut and total oilseed production. However there are 9 districts with negative growth rate in the 2nd decadal period.
- 7. Growth and Instability in Oilseeds production in Odisha…… www.ijhssi.org 45 | Page The instability in the production of groundnut and total oilseeds has experienced much improvement in the 2nd decadal period. However 13 districts had high level of instability during the 2nd decadal period. VI. Conclusion The oilseed crops have been the back bone of agricultural economy in view of its commercial as well as consumption value. This is encouraging scenario that the decadal period from 1995-96 to 2014-15 have experienced exemplary growth in the production of oilseeds in the state. The instability has also reduced significantly at aggregate level however 13 districts had high instability. Similarly 9 districts observed negative growth in the production. These districts need special attention from the agricultural extension machinery of the state.the study has identified cluster of low, moderate and high instability districts. Cluster specific strategic interventions might be useful to harness the optimum potential of the state for sustainable oilseed production in the state. References [1] Bhalla, G.S. and Singh, G. (2009) Economic liberalization and Indian agriculture: A state-wise analysis. Economic and Political Weekly. 54 (52): 34-44. [2] Bhattacharya, S. and Bhattacharya M. (2007), Agrarian impasse in West Bengal in the liberalization era. Economic and Political Weekly. 42(52): 65-71. [3] Chand K., Mathhur V. C. and Kumar S. 2001. An Economic Inquiry into Growth and Instability of India’s Agricultural Exports. Vol. 35(1) 25-30. http://agricoop.nic.in. [4] Chand, R. (2001) Emerging trends and issues in public and private investments in Indian agriculture: A state wise analysis. Indian Journal of Agricultural Economics. 56(2): 161-184. [5] Chand, R. (2003) Government Intervention in Foodgrain Markets in the Changing Context. Policy Paper No. 19. National Centre for Agricultural Economics and Policy Research, New Delhi. [6] Chand, R. and Raju, S. S. (2009) Instability in Indian agriculture during phases of technology and policy. Indian Journal of Agricultural Economics, 64(2): 187-207. [7] Das, P. S. (1978) Growth and Instability in crop output in Eastern India. Economic and Political Weekly, 13(41): 1741-1748. [8] Hazel, P. B. R. (1982) Instability in Indian Foodgrains Production. Research Report No. 30, International Food Policy Research Institute, Washington D. C. [9] Jha. G. K. et al (2012), Changing Energy-use Pattern and the Demand Projection for Indian Agriculture, Agricultural Economics Research Review, Vo l. 25 (No. 1) pp. 61-68. [10] Lenka, J. (2010) Crop diversification in Orissa: An econometric analysis. In: Current Issues in Indian Agriculture, Eds: J. Lenka. Serials Publication, New Delhi. [11] Mahendradev, S. (1987), Growth and instability in Foodgrains production: An interstate analysis. Economic and Political Weekly, 22(39): A82-A92. [12] Mehra Shakuntala, (1981), Instability in India agriculture in the context of new technology Research Report 25, Washington D. C. International Food Policy Research Institute. [13] Mohanty. S., Pattanaik. F. and Patra. R.N. (2013), Agricultural diversification in Odisha during post reform period. Agricultural Situation in India, 70(6):5-14. [14] Mohanty. S., Pattanaik. F. and Patra. R.N. (2014), Agricultural Instability in Odisha during Post Reform Period, International Journal of Food, Agriculture and Veterinary Sciences, Vol. 4 (1) pp. 62-70. [15] Paltasingh, K. R. and Goyari, P. (2013) Analysing growth and instability in subsistence agriculture of Odisha: Evidence from major crops. Agricultural Economics Research Review, 26 (Conference Number): 67-78. [16] Paltasingh, K. R. and Goyari, P. and Mishra, R. K. (2012) Measuring weather impact on crop yield using aridity index: Evidence from Odisha. Agricultural Economics Research Review, 25(2): 205-2016. [17] Pattanaik. F. and Nayak, N. C. (2010), Experiences of structural transformation in Odisha. Indian Journal of Regional Science, 43(1): 17-26. [18] Pattanaik. F. and Nayak, N. C. (2014), Agricultural growth in Odisha during 1970-2008: An analysis. Journal of Applied Economics, 13(1): 1-19. [19] Reddy A. A. (2013), ICRISAT Research Program, Markets, Institutions and Policies ICRISAT is a member of the CGIAR Consortium www.icrisat.org. [20] Reddy A. Amarender (2014), Agricultural productivity in Orissa, India: Crop diversification to pulses, oilseeds and other high value crops, African Journal of Agriculture, Vol. 8 (19) pp. 2272-2284. [21] Roa, C. H. H., S. K. Ray and K Subbarao (1988): Unstable Agriculture and Droughts: Implications for Policy, Vikas Publishing House. [22] Sihmar, Rakesh (2014), Growth and Instability in Agricultural Production in Haryana: A District level analysis. International Journal of Scientific Research Publications, Vol. 4, Issue 7: 1-12. [23] Subrahmanyam, S. and Satya Sekhar, P. (2003), Agricultural growth: Pattern and prospects. Economic and Political Weekly, 38(12/13): 1202-1211. [24] Weinberger, K. and Lumpkin, T. (2007), Diversification into horticulture and poverty reduction: A research agenda. World Development, 35(8): 1464-1480. Siba Prasad Samal Growth and Instability in Oilseeds production in Odisha: A district level analysis. International Journal of Humanities and Social Science Invention(IJHSSI), vol. 6, no. 11, 2017, pp. 39-45