Downloaded 52 times

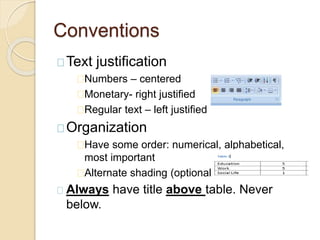
![How to label equations
1. At the end of the sentence where the
equation goes, hit enter.
2. Insert the equation desired.
3. Add either a comma, period, and/or
space.
4. Type in the label [(1.1) etc.].
5. Right Justify the line, put cursor in
between the label and equation and tab
equation to center it.
6. Click at end of label, enter and left justify.](https://image.slidesharecdn.com/group3-howtocreatetablesfiguresandequations-140728172221-phpapp01/85/Group-3-how-to-create-tables-figures-and-equations-23-320.jpg)


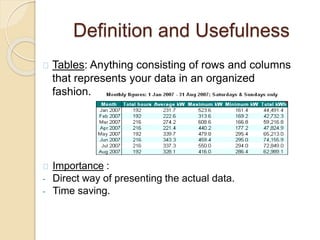
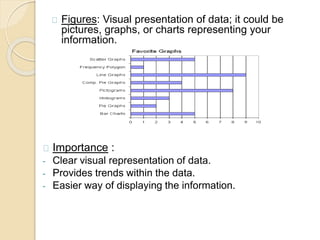
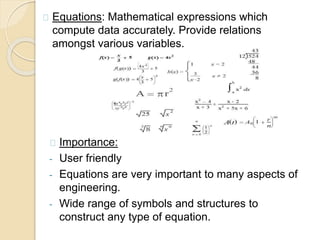
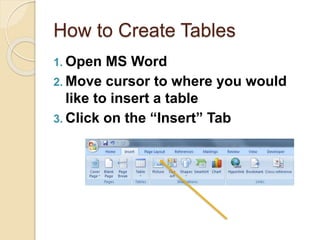
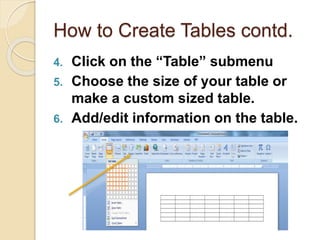
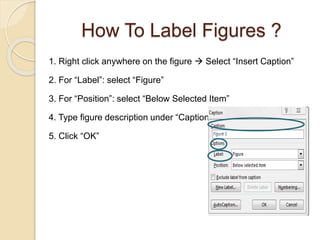
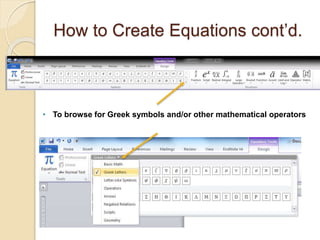
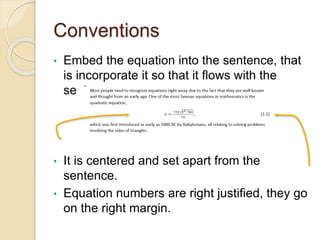
This document provides instructions for creating and labeling tables, figures, and equations in Microsoft Word. It defines each element and explains their importance for presenting information. The procedures outlined include how to insert, format, and add captions to tables, charts, and equations. Following best practices like consistent formatting and labeling helps present content in an organized, professional manner.