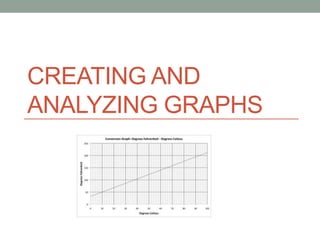
This document discusses how to analyze a dataset by creating a graph. It involves plotting age (months) on the x-axis and height (inches) on the y-axis for various data points. A line of best fit is drawn and its equation is determined to be y = 0.65x + 64.7. This line equation allows predictions to be made, such as a height of 103.7 inches at 5 years (60 months). The document provides a step-by-step guide to graphing data, determining the line of best fit equation, and using that equation to make predictions.