This document defines and provides examples of independent and dependent variables, continuous and discrete data, and correlation. It discusses:
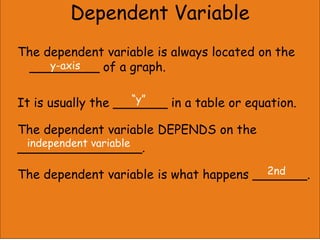
- Independent variables are what happens first and affect dependent variables. Dependent variables depend on independent variables and are what happens second.
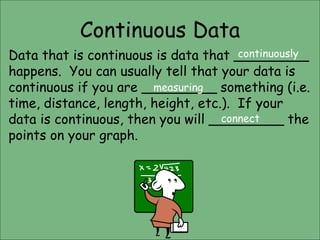
- Continuous data involves measuring something that happens continuously like time, distance, or height. Discrete data involves counting things like people or cars.
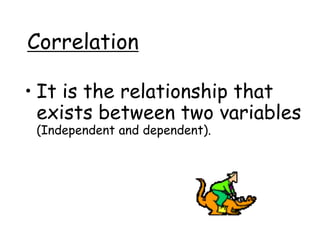
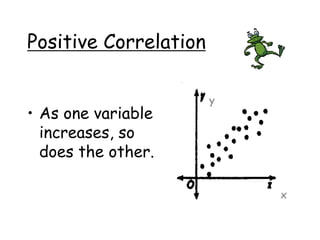
- Correlation describes the relationship between independent and dependent variables. Positive correlation means both variables increase together. Negative correlation means one decreases as the other increases. No correlation means the variables do not change together.


![Ethics[1]](https://cdn.slidesharecdn.com/ss_thumbnails/ethics1-110821092828-phpapp01-thumbnail.jpg?width=640&height=640&fit=bounds)