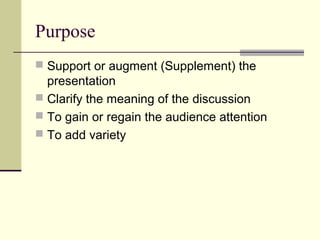
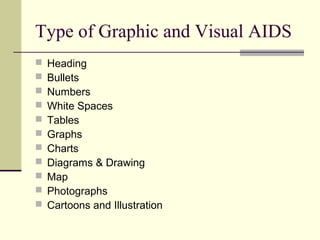
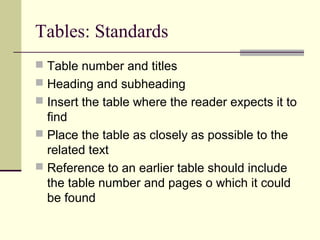
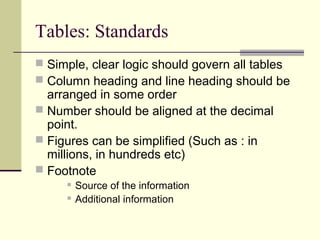
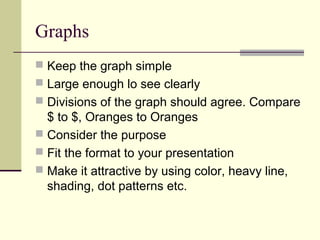
Graphic and Visual Aids 
in Communication 
Sharif U Ahmed
Purpose 
 Support or augment (Supplement) the 
presentation 
 Clarify the meaning of the discussion 
 To gain or regain the audience attention 
 To add variety
A picture is worth a 
thousand words.
Guideline 
 Appropriate 
 Pertinent (relevant) 
 Visible 
 Clear 
 Simple 
 Manageable
Identification by 
Title 
& Source
Type of Graphic and Visual AIDS 
 Heading 
 Bullets 
 Numbers 
 White Spaces 
 Tables 
 Graphs 
 Charts 
 Diagrams & Drawing 
 Map 
 Photographs 
 Cartoons and Illustration
Heading 
 News
Bullets, Numbers & Letters 
 Refer Microsoft Word
Tables 
 Systematic arrangement of data, usually in 
rows and columns for ready reference.
Tables: Standards 
 Table number and titles 
 Heading and subheading 
 Insert the table where the reader expects it to 
find 
 Place the table as closely as possible to the 
related text 
 Reference to an earlier table should include 
the table number and pages o which it could 
be found
Tables: Standards 
 Simple, clear logic should govern all tables 
 Column heading and line heading should be 
arranged in some order 
 Number should be aligned at the decimal 
point. 
 Figures can be simplified (Such as : in 
millions, in hundreds etc) 
 Footnote 
 Source of the information 
 Additional information
Graphs 
 Keep the graph simple 
 Large enough lo see clearly 
 Divisions of the graph should agree. Compare 
$ to $, Oranges to Oranges 
 Consider the purpose 
 Fit the format to your presentation 
 Make it attractive by using color, heavy line, 
shading, dot patterns etc.
Charts 
 Micro soft Excel
Diagram & Drawing 
 Microsoft Word
 Map 
 Photograph 
 Cartoons
Q & A

Graphic and visual aids in communication

  • 1.
    Graphic and VisualAids in Communication Sharif U Ahmed
  • 2.
    Purpose  Supportor augment (Supplement) the presentation  Clarify the meaning of the discussion  To gain or regain the audience attention  To add variety
  • 3.
    A picture isworth a thousand words.
  • 4.
    Guideline  Appropriate  Pertinent (relevant)  Visible  Clear  Simple  Manageable
  • 5.
  • 6.
    Type of Graphicand Visual AIDS  Heading  Bullets  Numbers  White Spaces  Tables  Graphs  Charts  Diagrams & Drawing  Map  Photographs  Cartoons and Illustration
  • 7.
  • 10.
    Bullets, Numbers &Letters  Refer Microsoft Word
  • 11.
    Tables  Systematicarrangement of data, usually in rows and columns for ready reference.
  • 12.
    Tables: Standards Table number and titles  Heading and subheading  Insert the table where the reader expects it to find  Place the table as closely as possible to the related text  Reference to an earlier table should include the table number and pages o which it could be found
  • 13.
    Tables: Standards Simple, clear logic should govern all tables  Column heading and line heading should be arranged in some order  Number should be aligned at the decimal point.  Figures can be simplified (Such as : in millions, in hundreds etc)  Footnote  Source of the information  Additional information
  • 14.
    Graphs  Keepthe graph simple  Large enough lo see clearly  Divisions of the graph should agree. Compare $ to $, Oranges to Oranges  Consider the purpose  Fit the format to your presentation  Make it attractive by using color, heavy line, shading, dot patterns etc.
  • 15.
    Charts  Microsoft Excel
  • 16.
    Diagram & Drawing  Microsoft Word
  • 17.
     Map Photograph  Cartoons
  • 18.