Downloaded 241 times


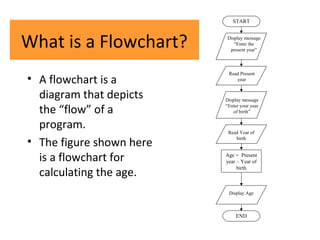
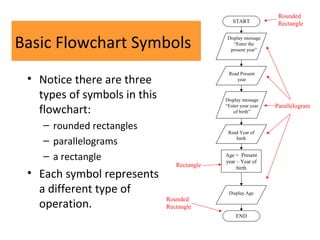
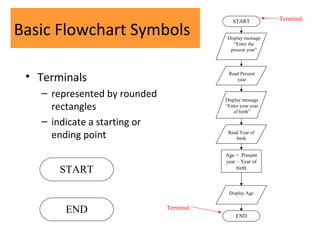
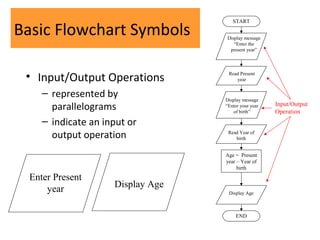
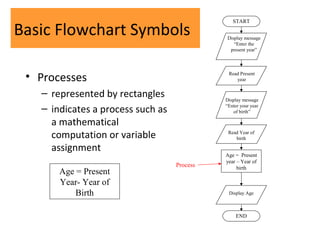

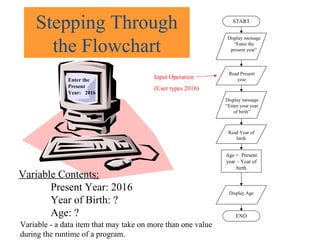
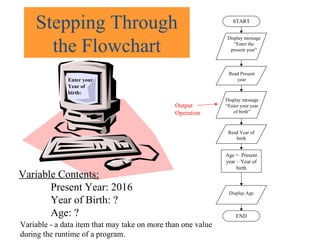
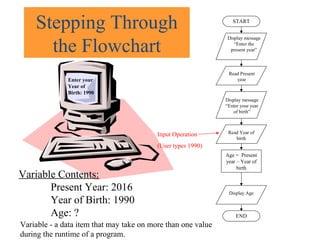
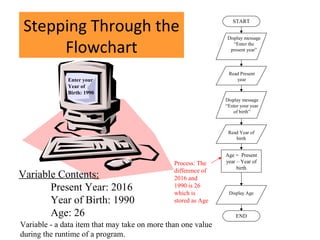
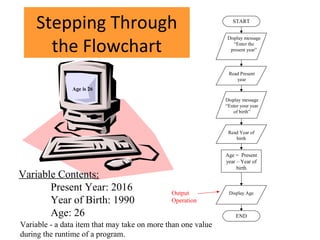
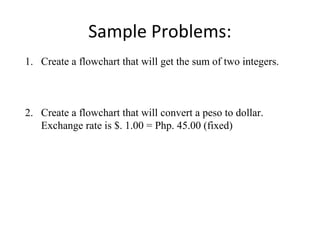
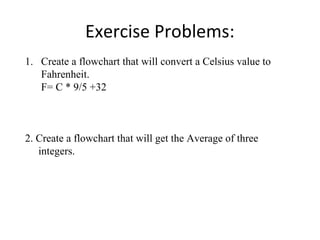
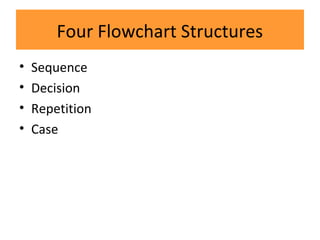
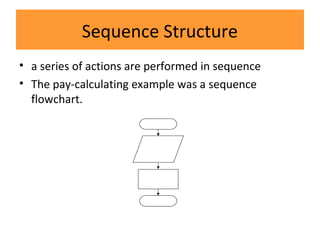
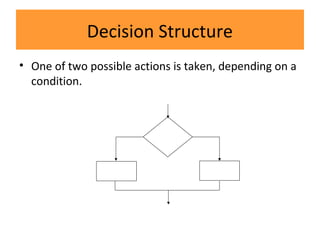
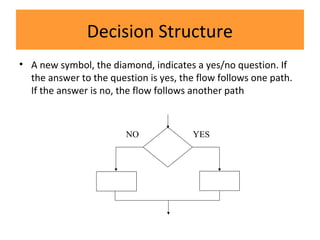
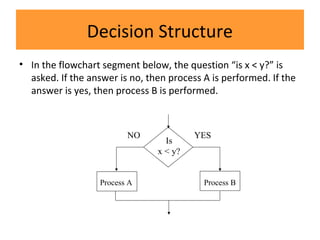

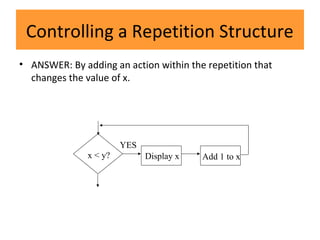


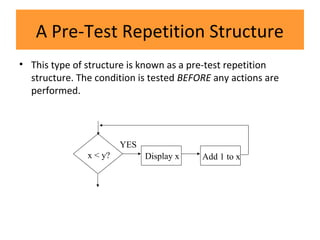
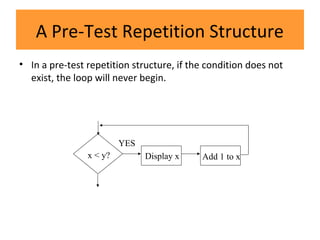
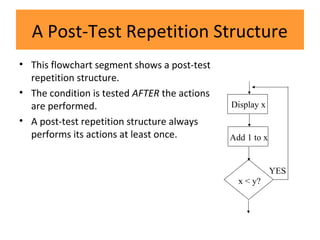
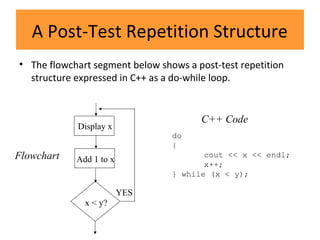
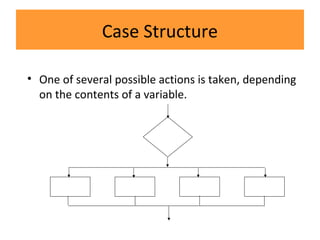
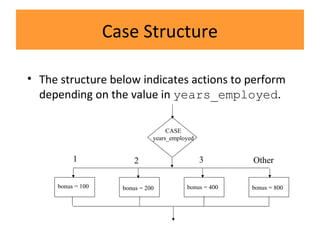
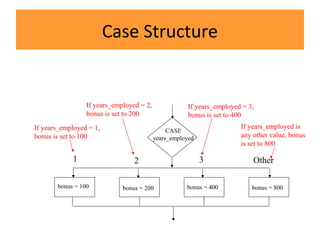
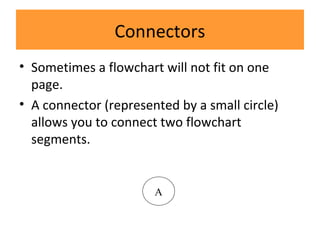
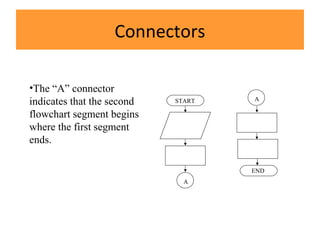
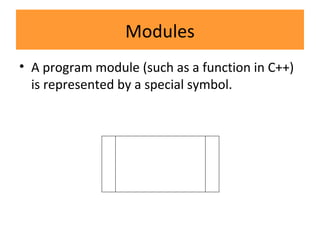
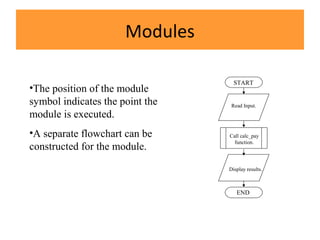
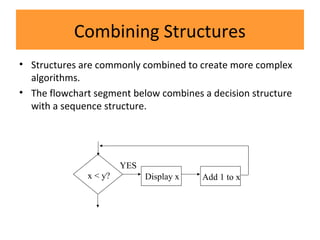
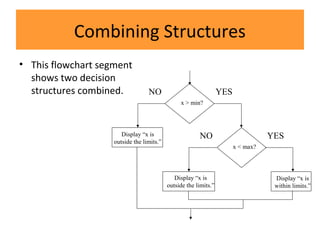
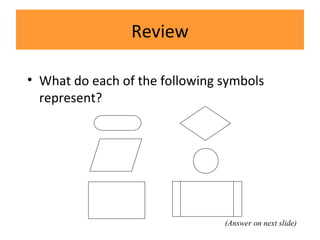
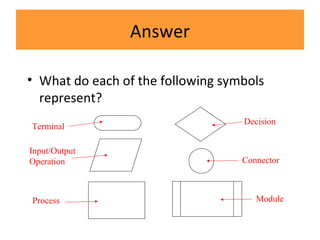
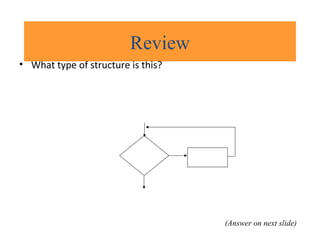
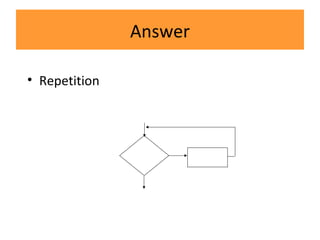

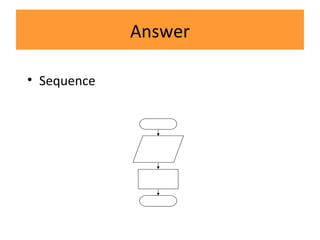
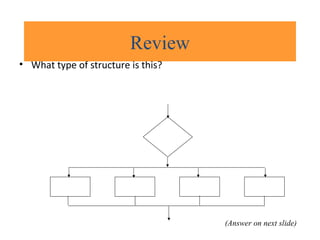
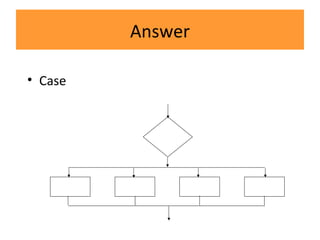

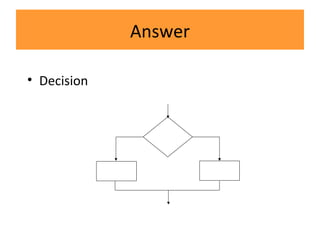

The document provides an introduction to flowcharting. It explains that a flowchart is a diagram that depicts the flow of a program and shows a basic example of a flowchart for calculating age. It describes the different symbols used in flowcharts, including terminals, input/output operations, processes, and basic flowchart structures like sequence, decision, repetition, and case. It also demonstrates how to step through a flowchart to trace the logic and variables. Various examples of flowcharts are presented to illustrate different structures and concepts.