Downloaded 408 times


![Example 6
Step 1: Input N1, N2, N3
Step 2: if (N1>N2) then
if (N1>N3) then
MAX ¬ N1 [N1>N2, N1>N3]
else
MAX ¬ N3 [N3>N1>N2]
endif
else
if (N2>N3) then
MAX ¬ N2 [N2>N1, N2>N3]
else
MAX ¬ N3 [N3>N2>N1]
endif
endif
Step 3: Print “The largest number is”, MAX](https://image.slidesharecdn.com/flowchart-141122003124-conversion-gate02/75/Flowchart-54-2048.jpg)


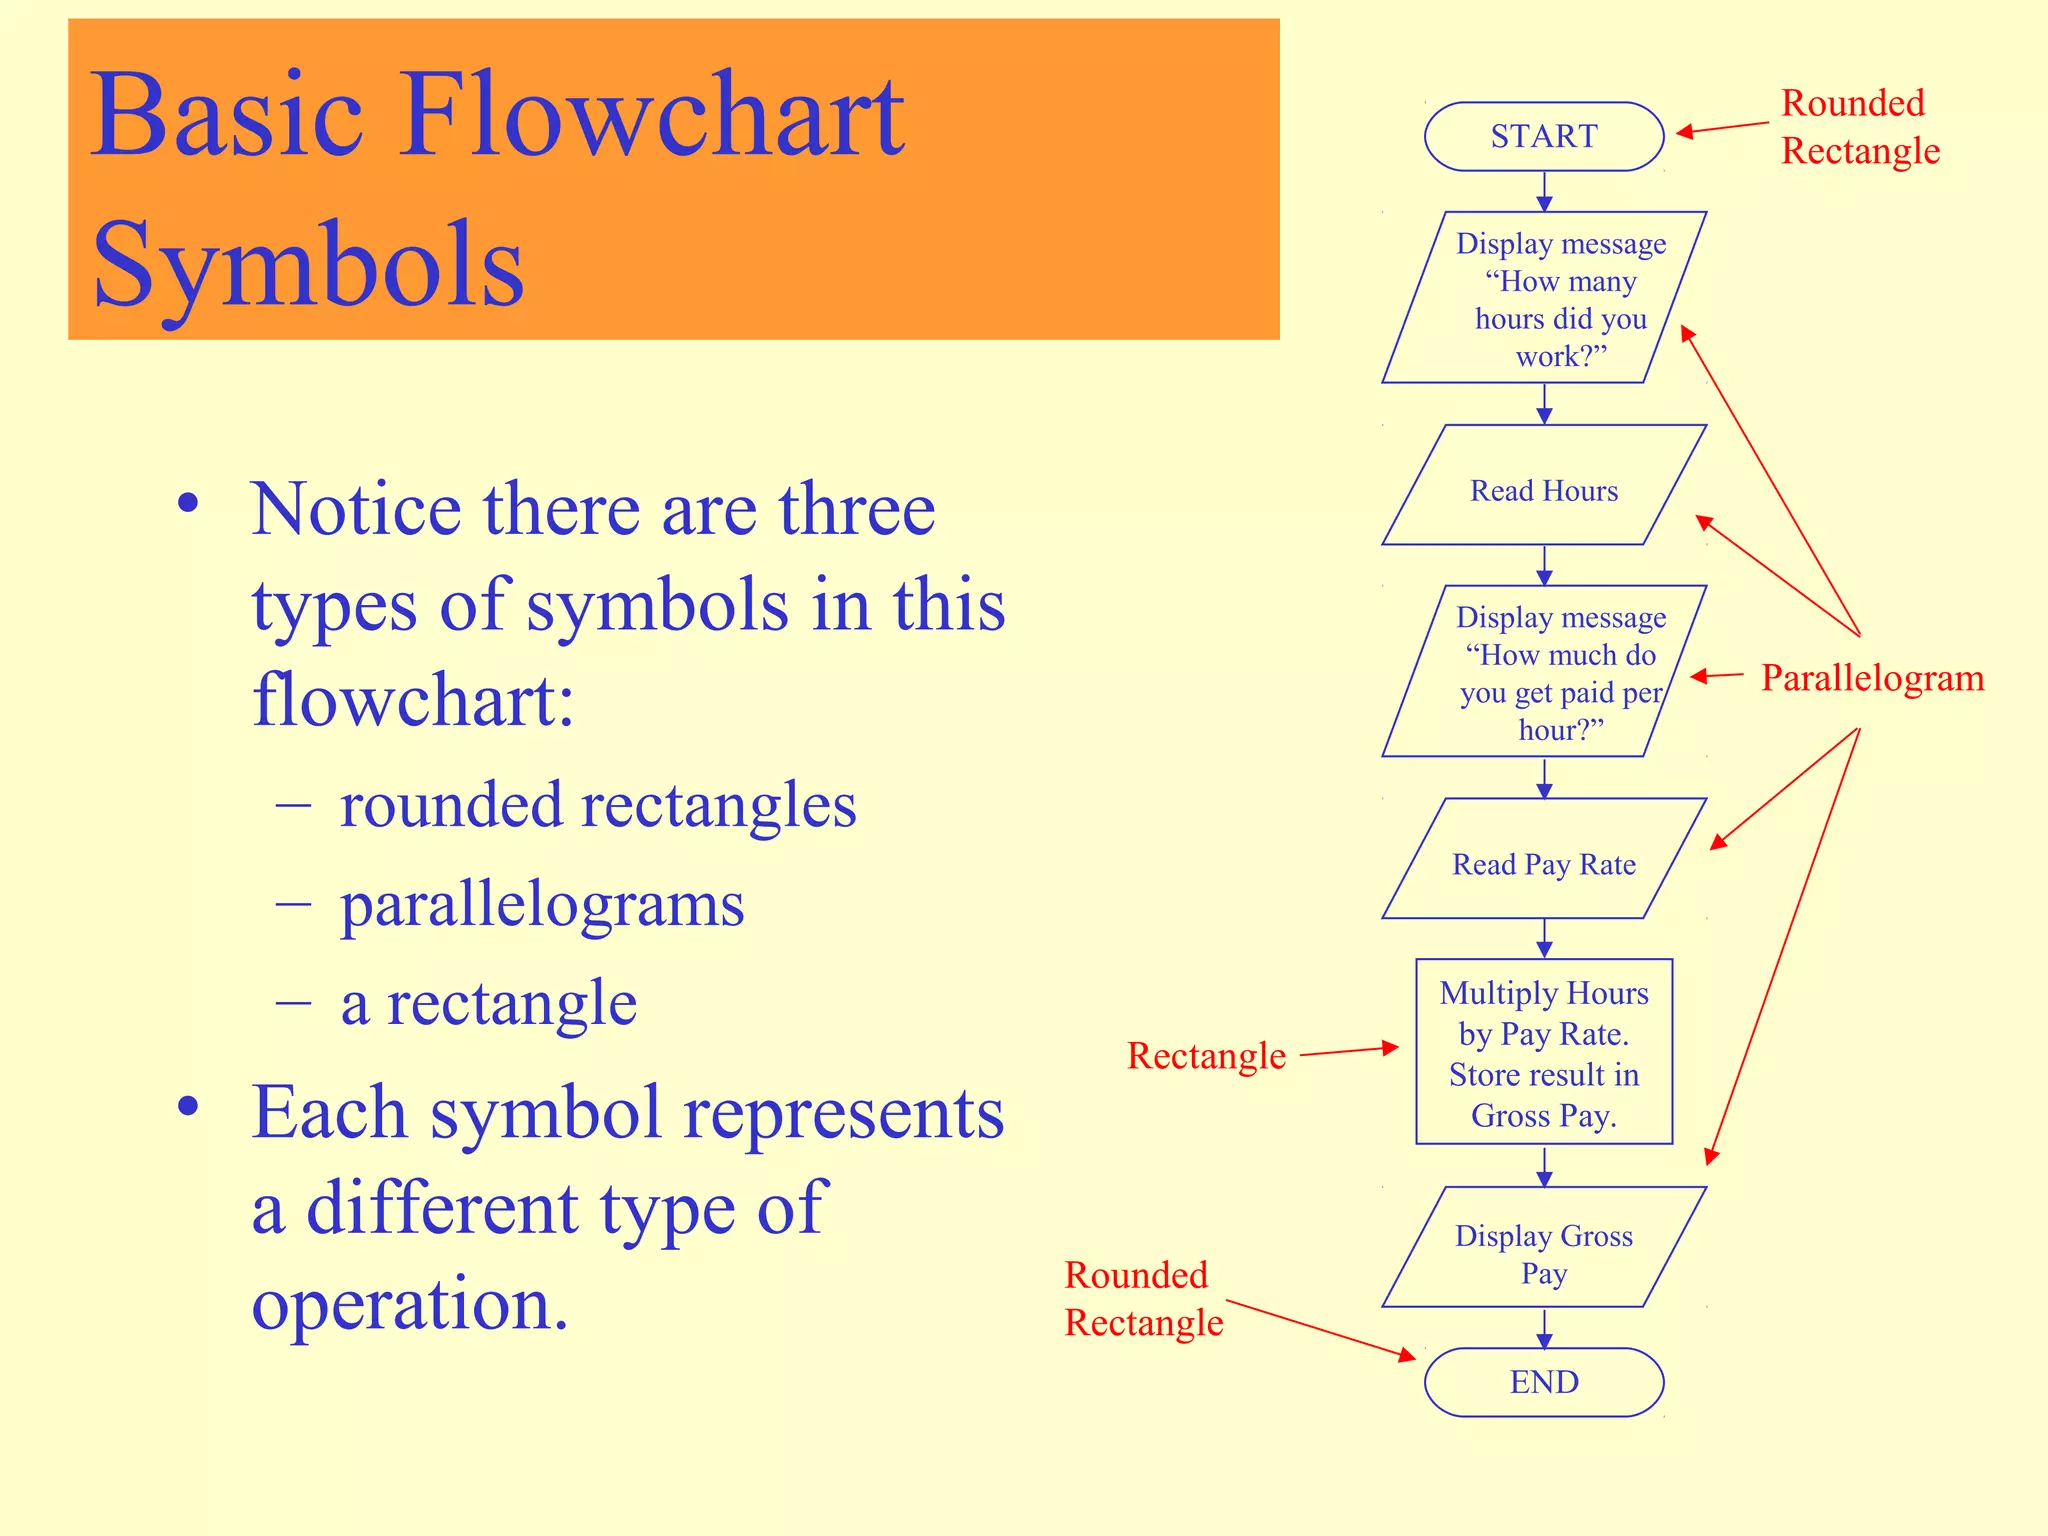
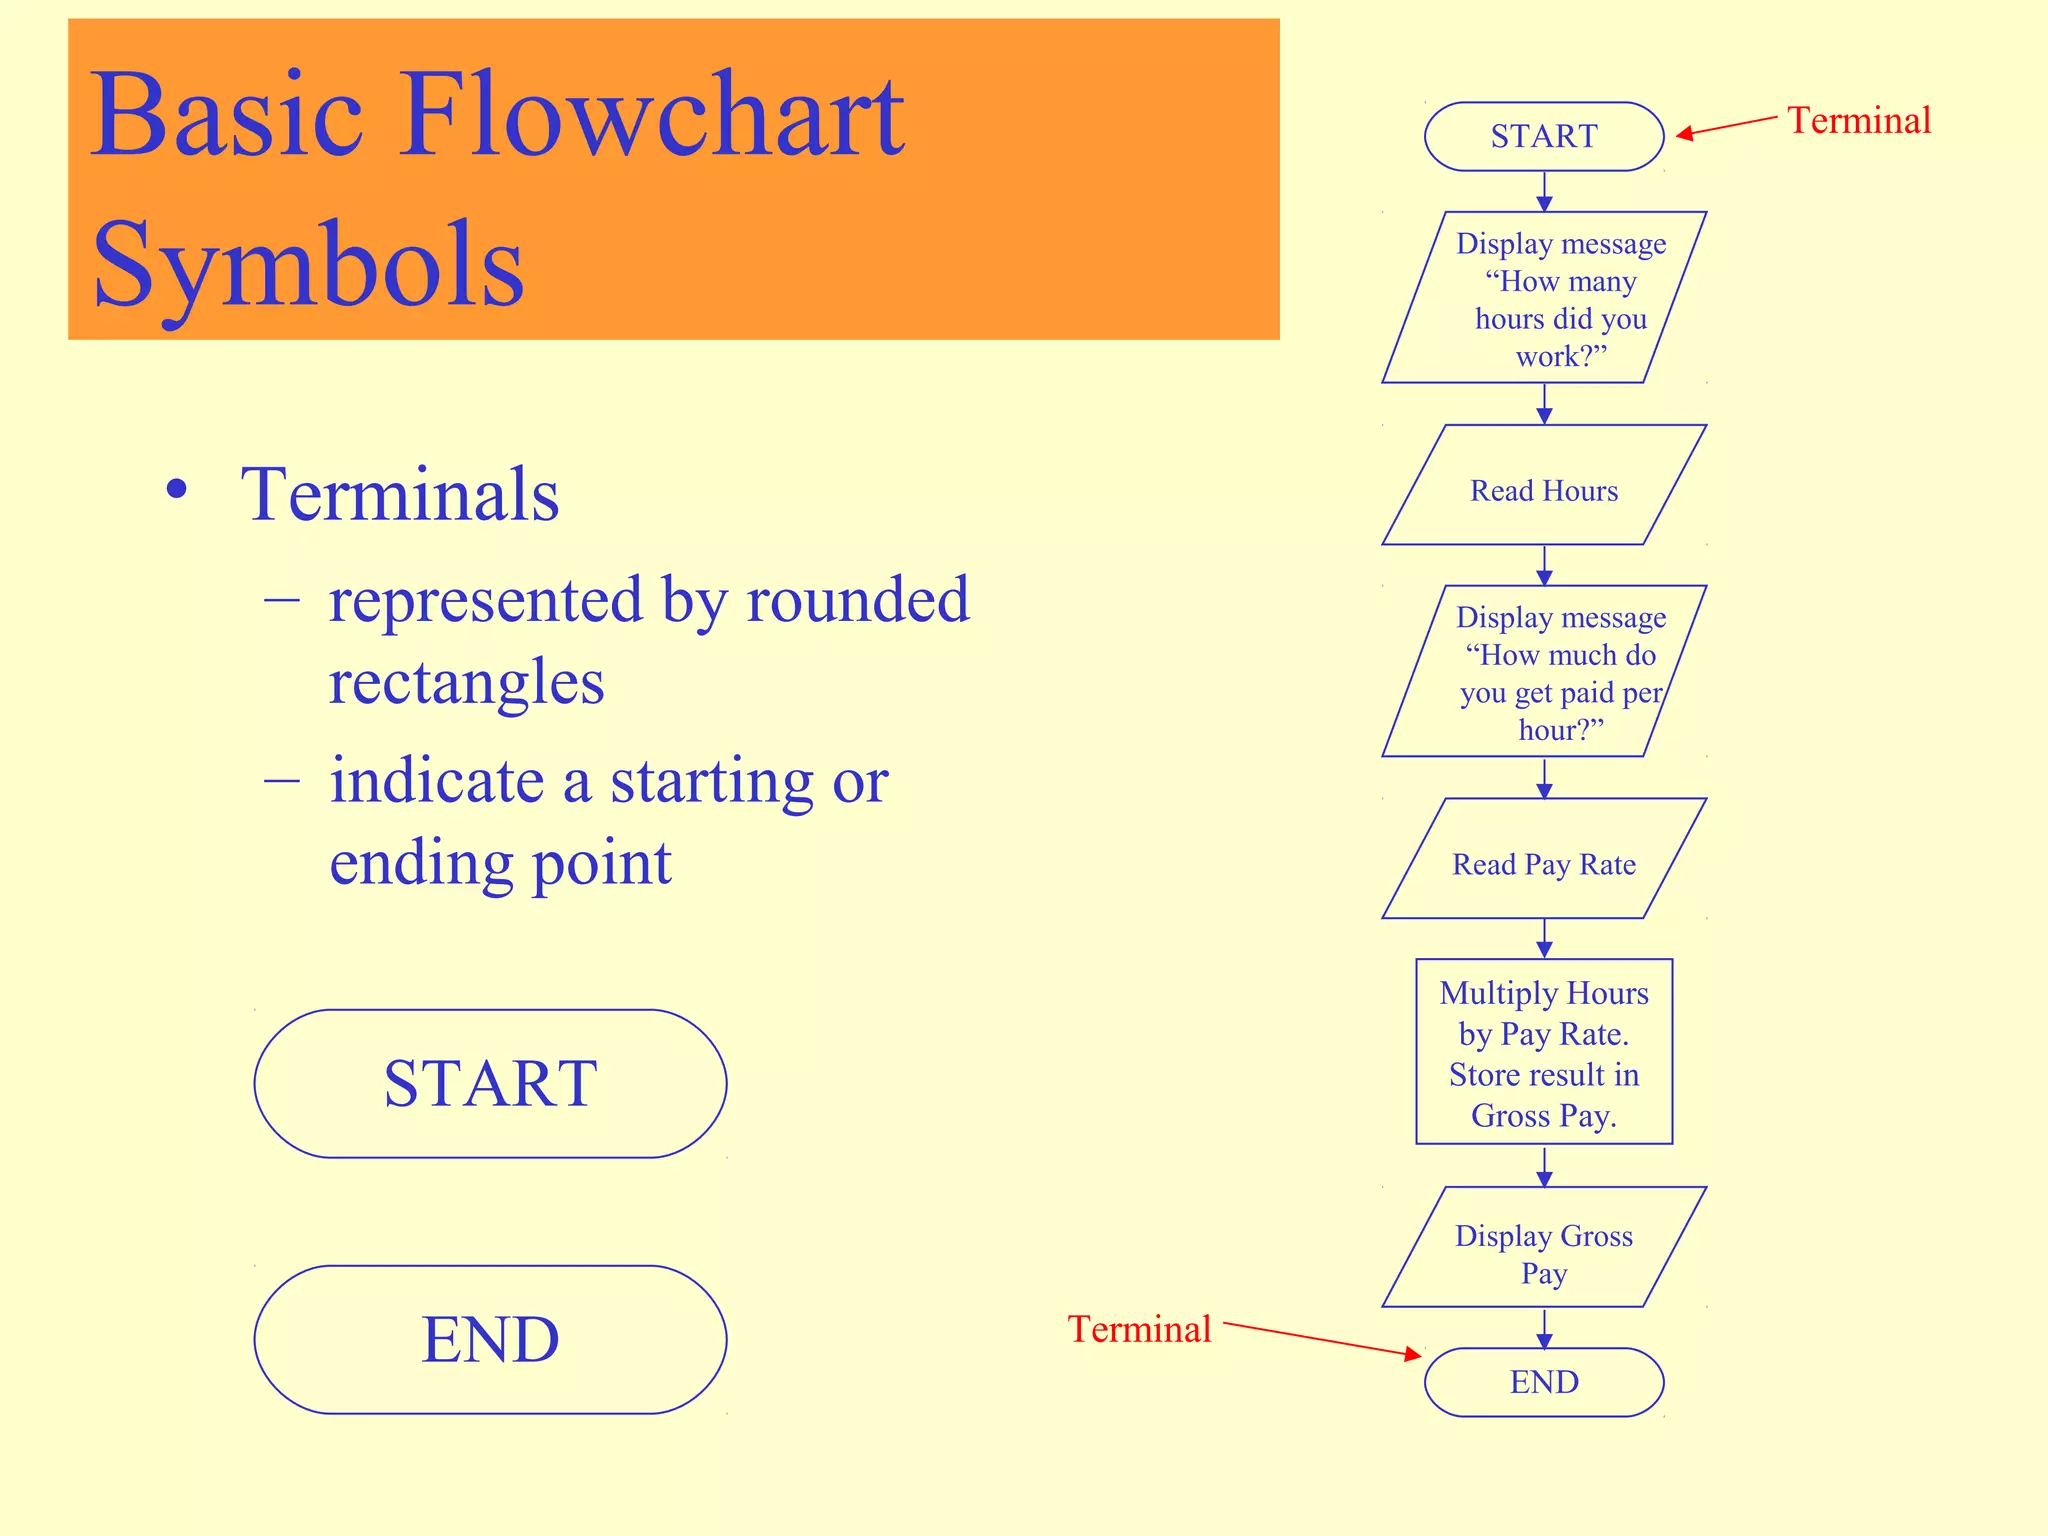
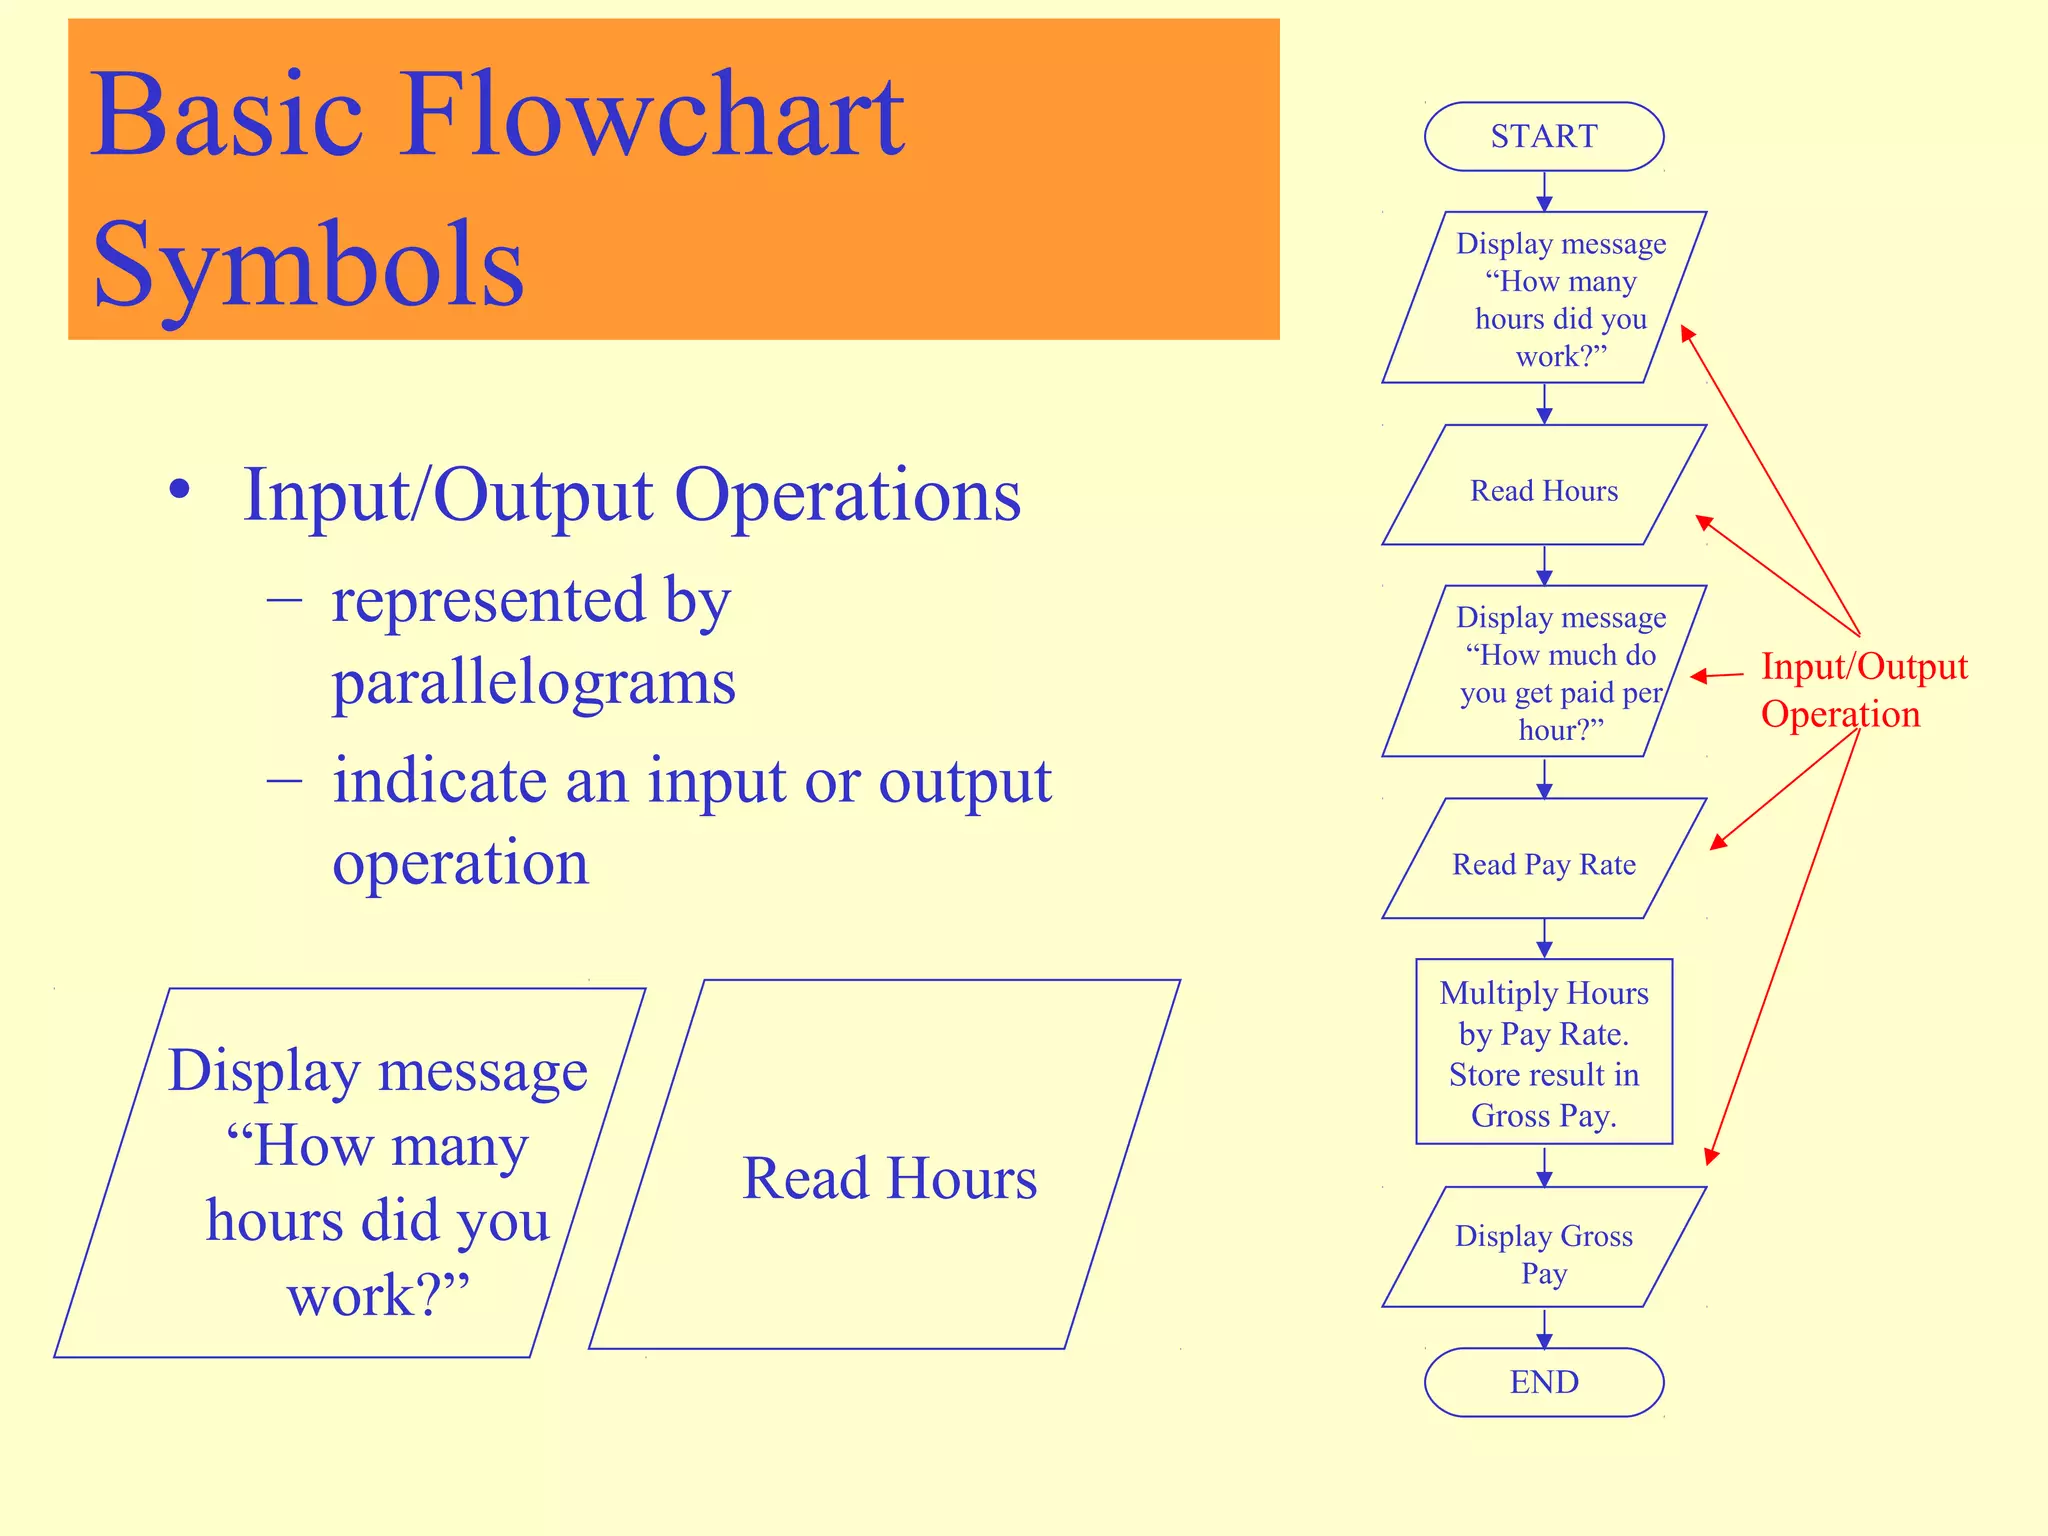
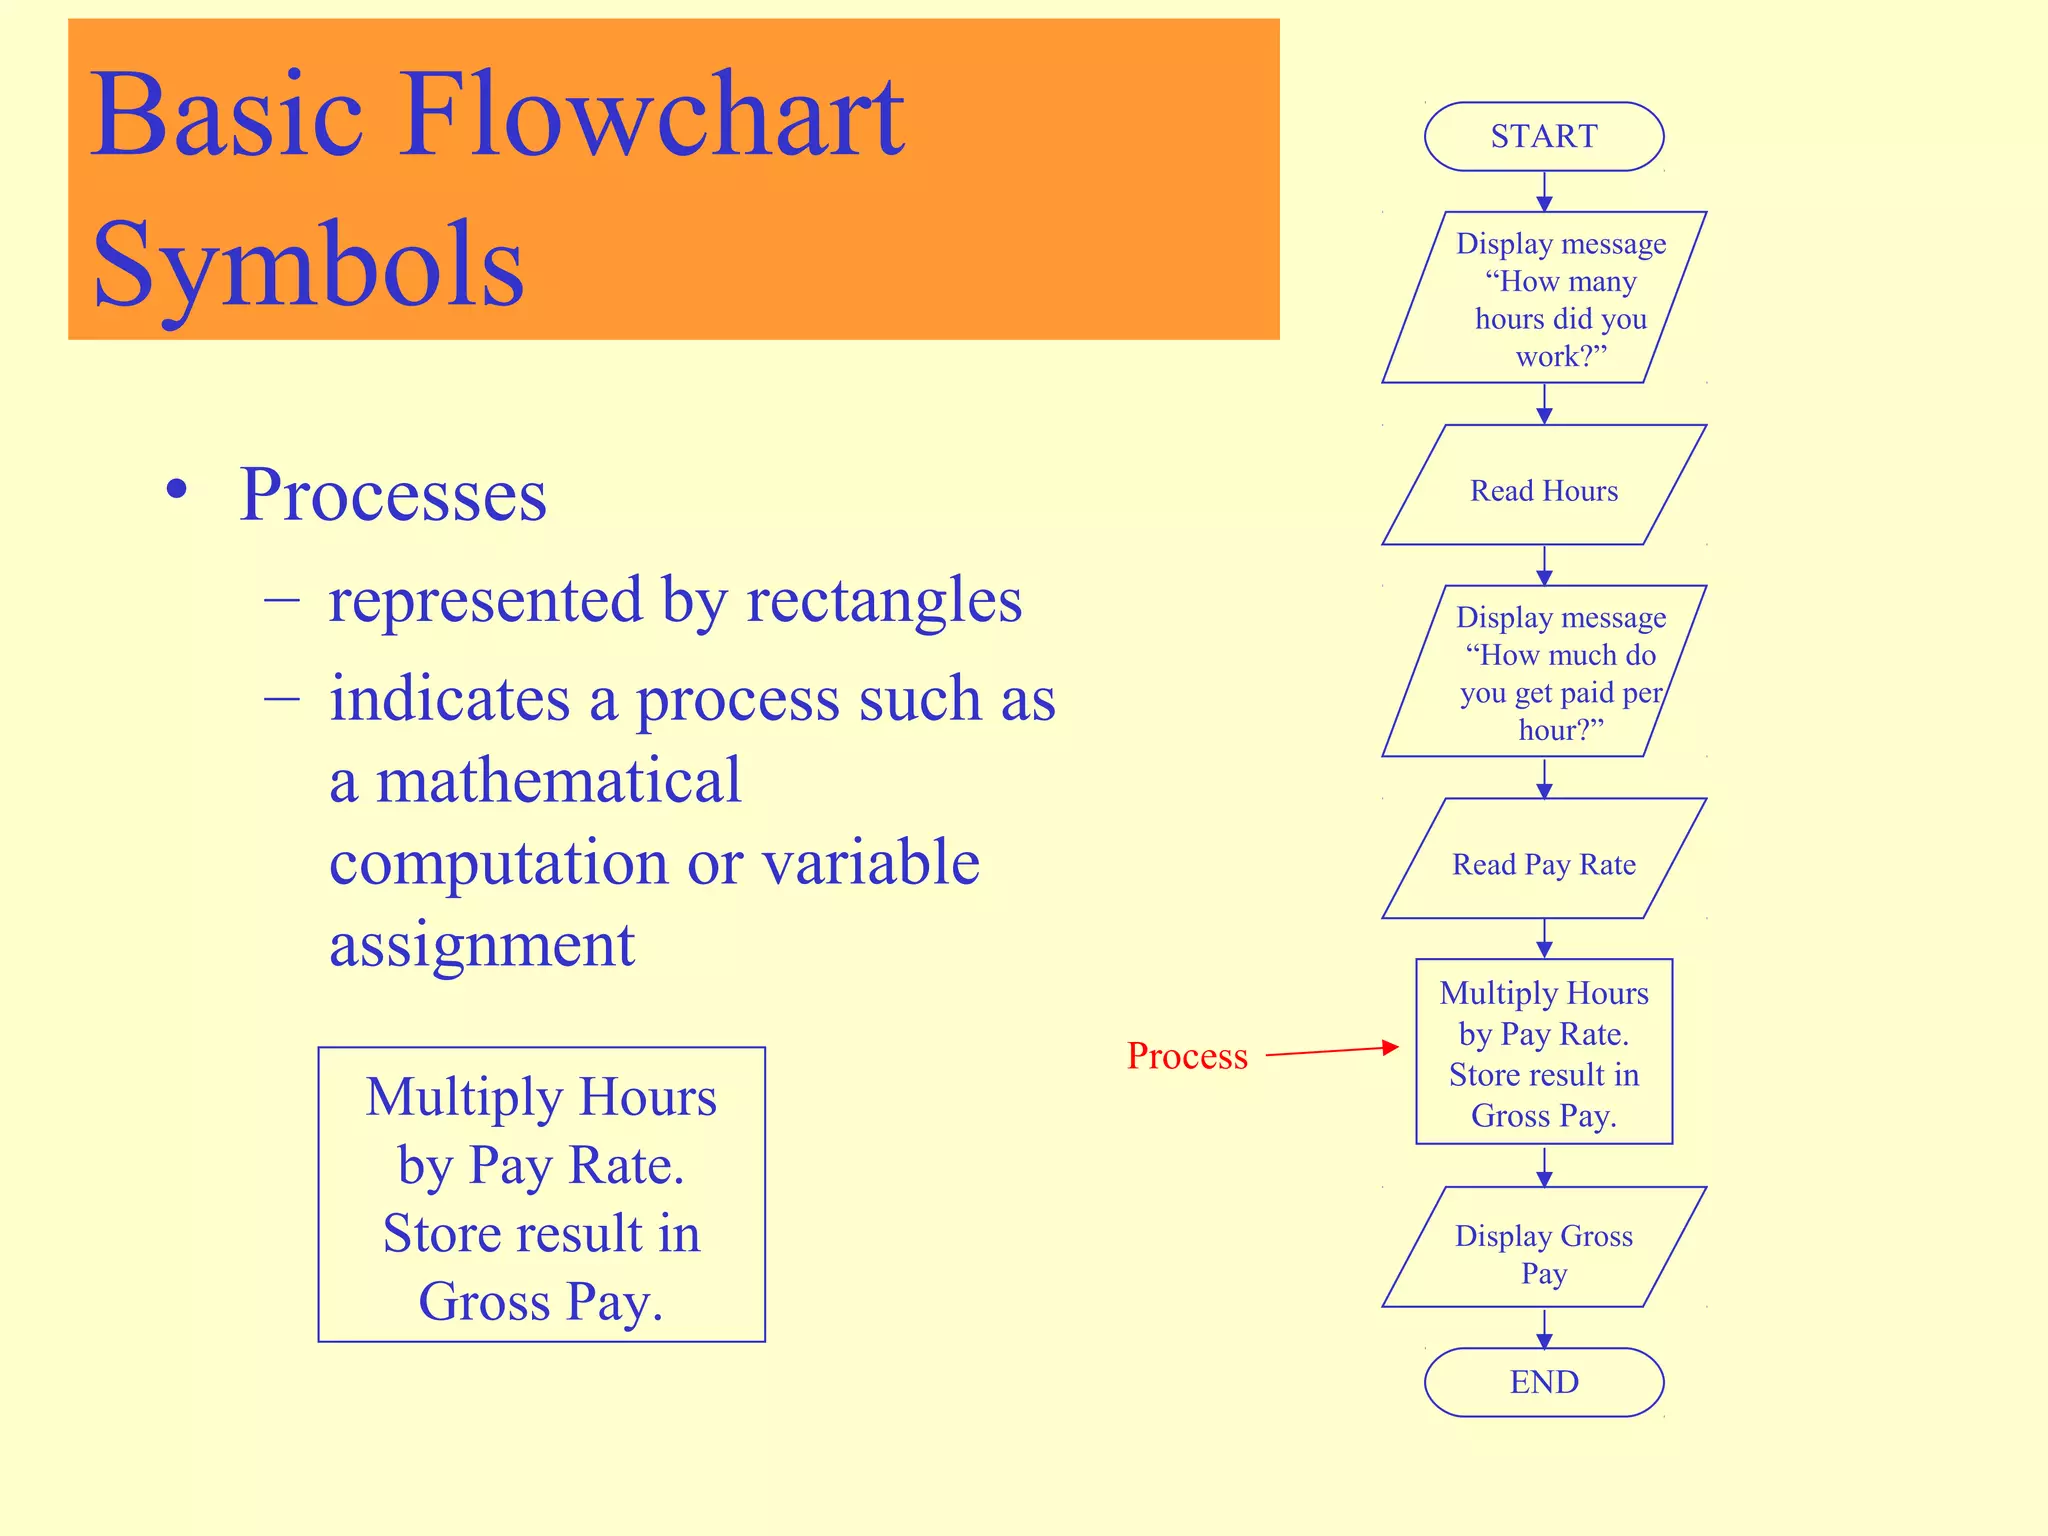
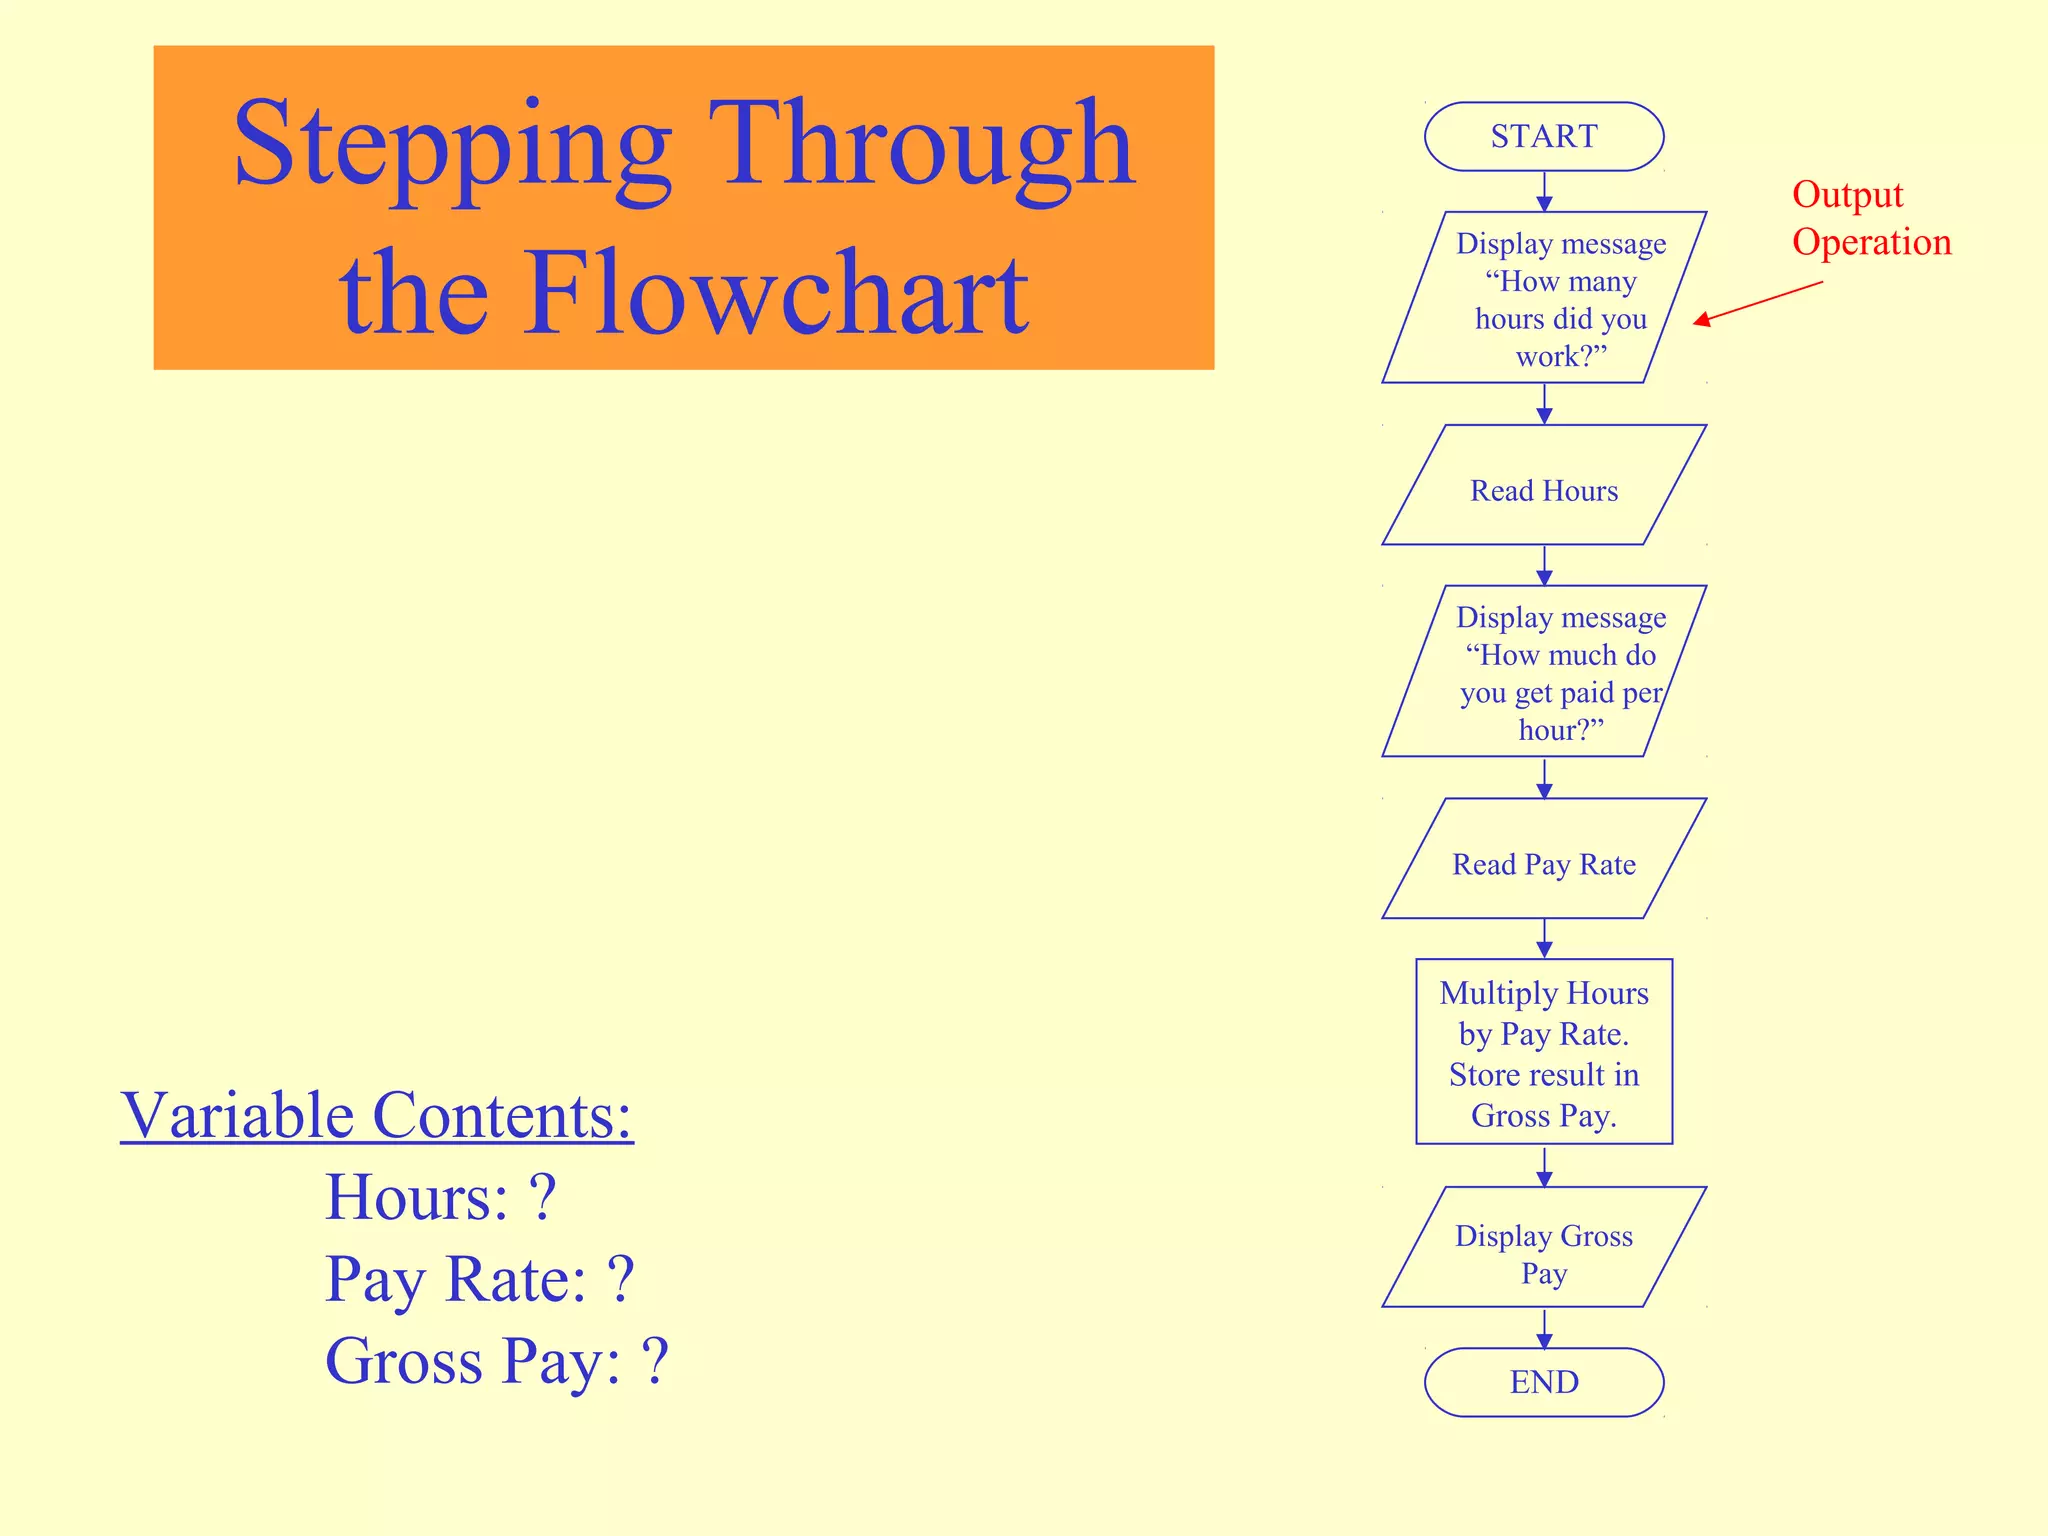
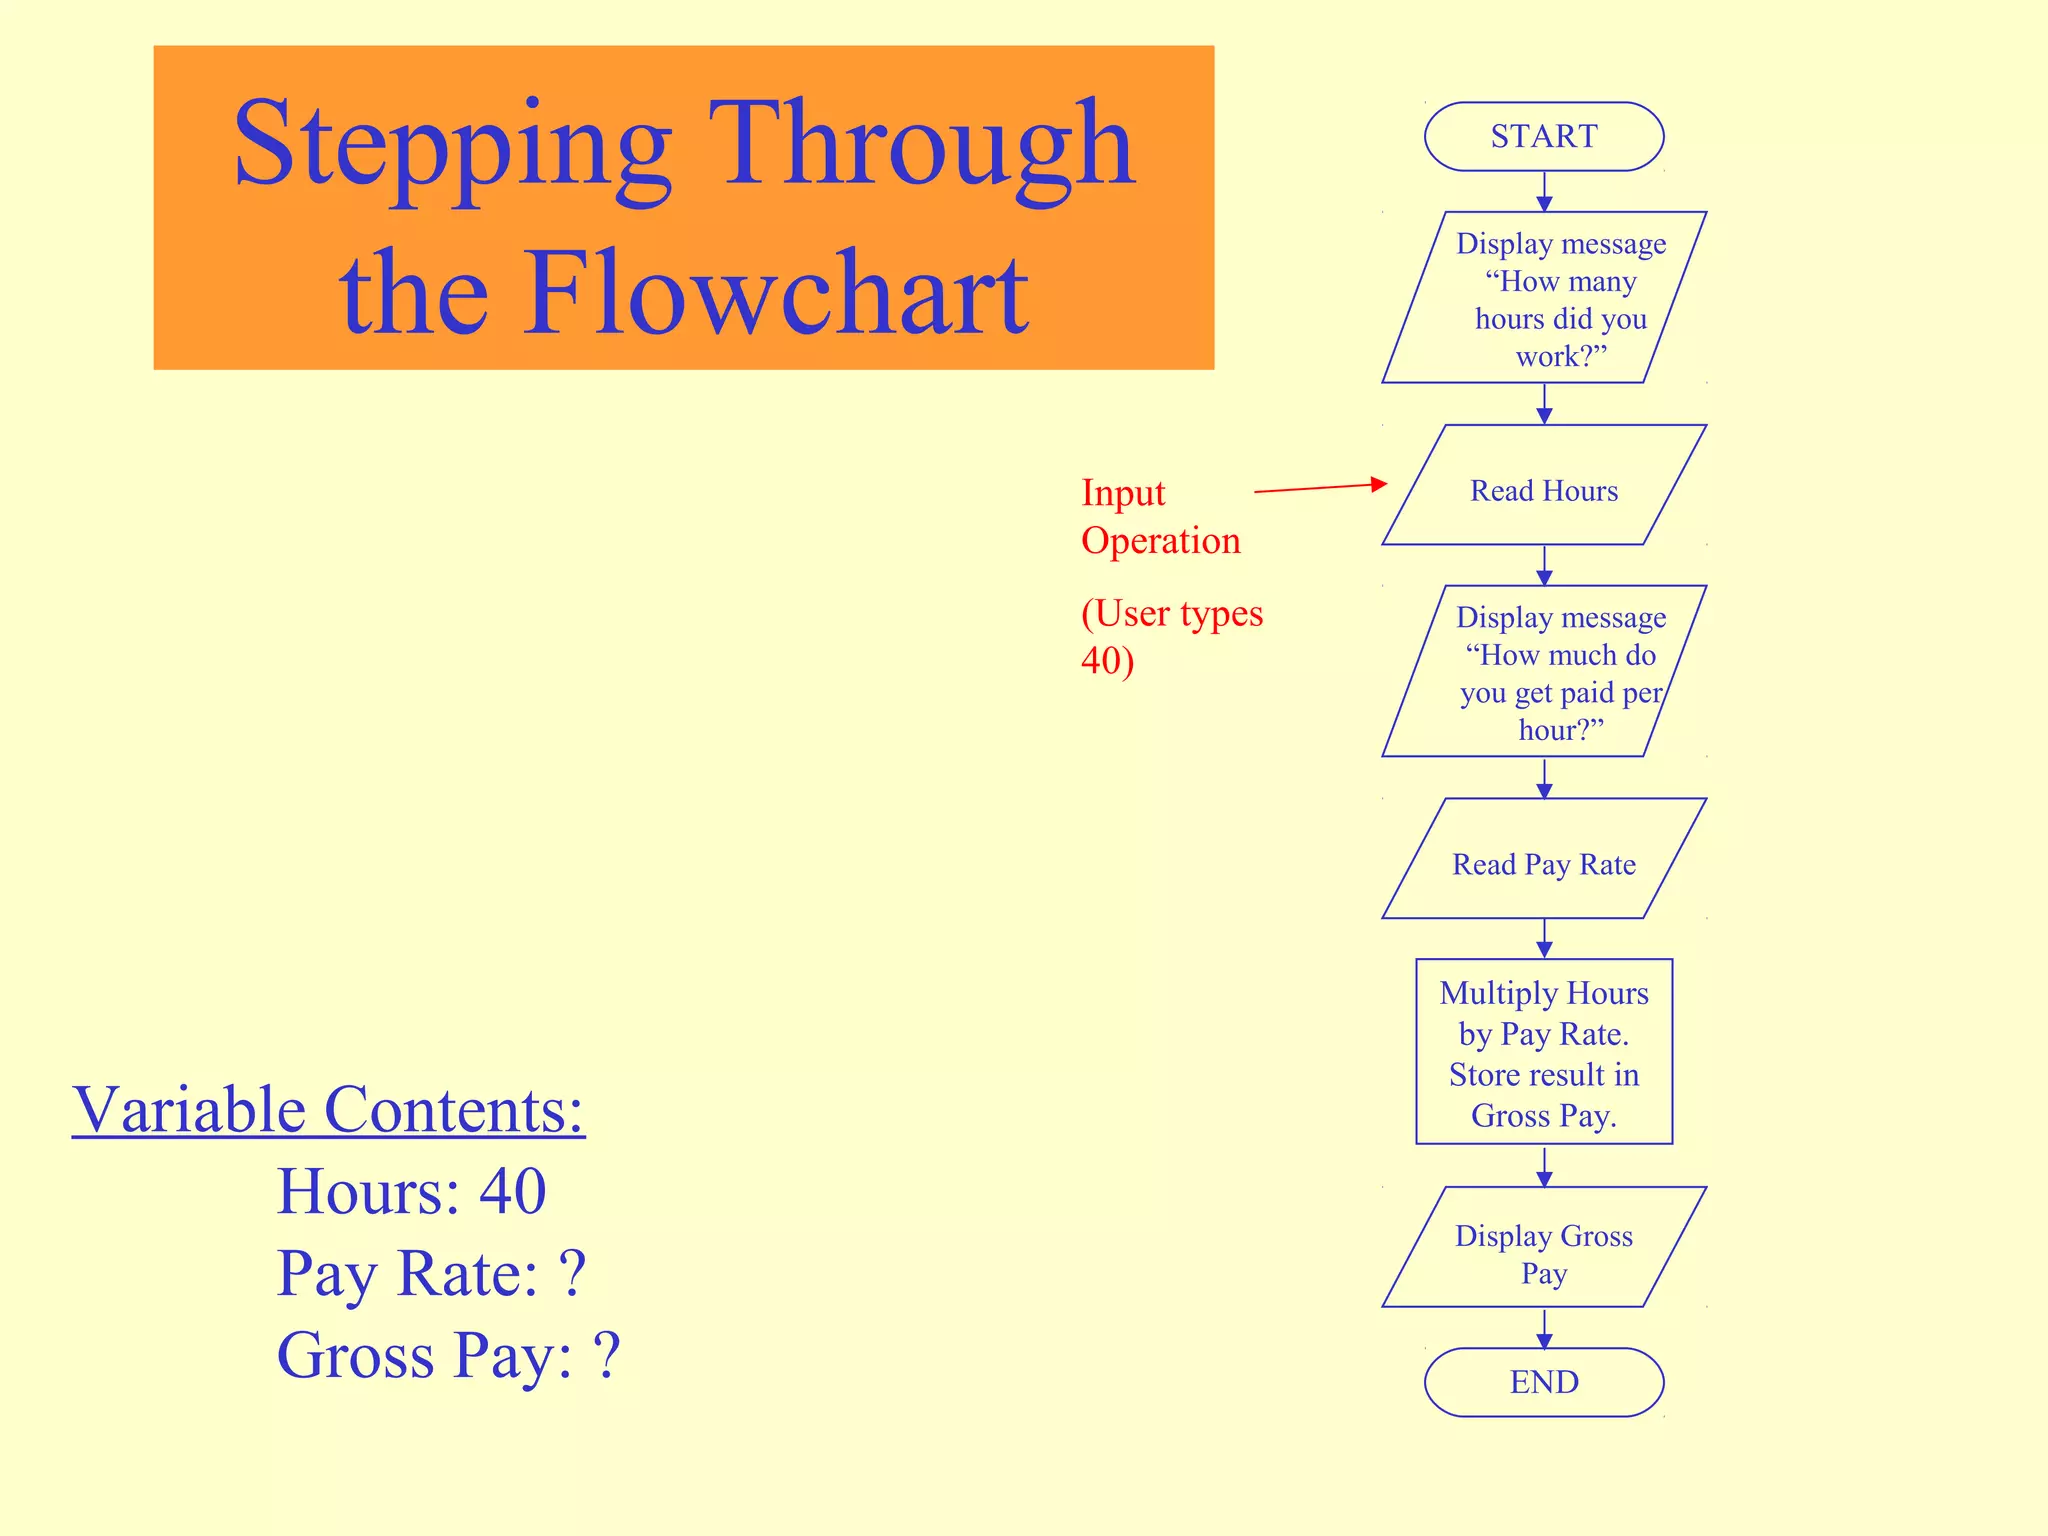
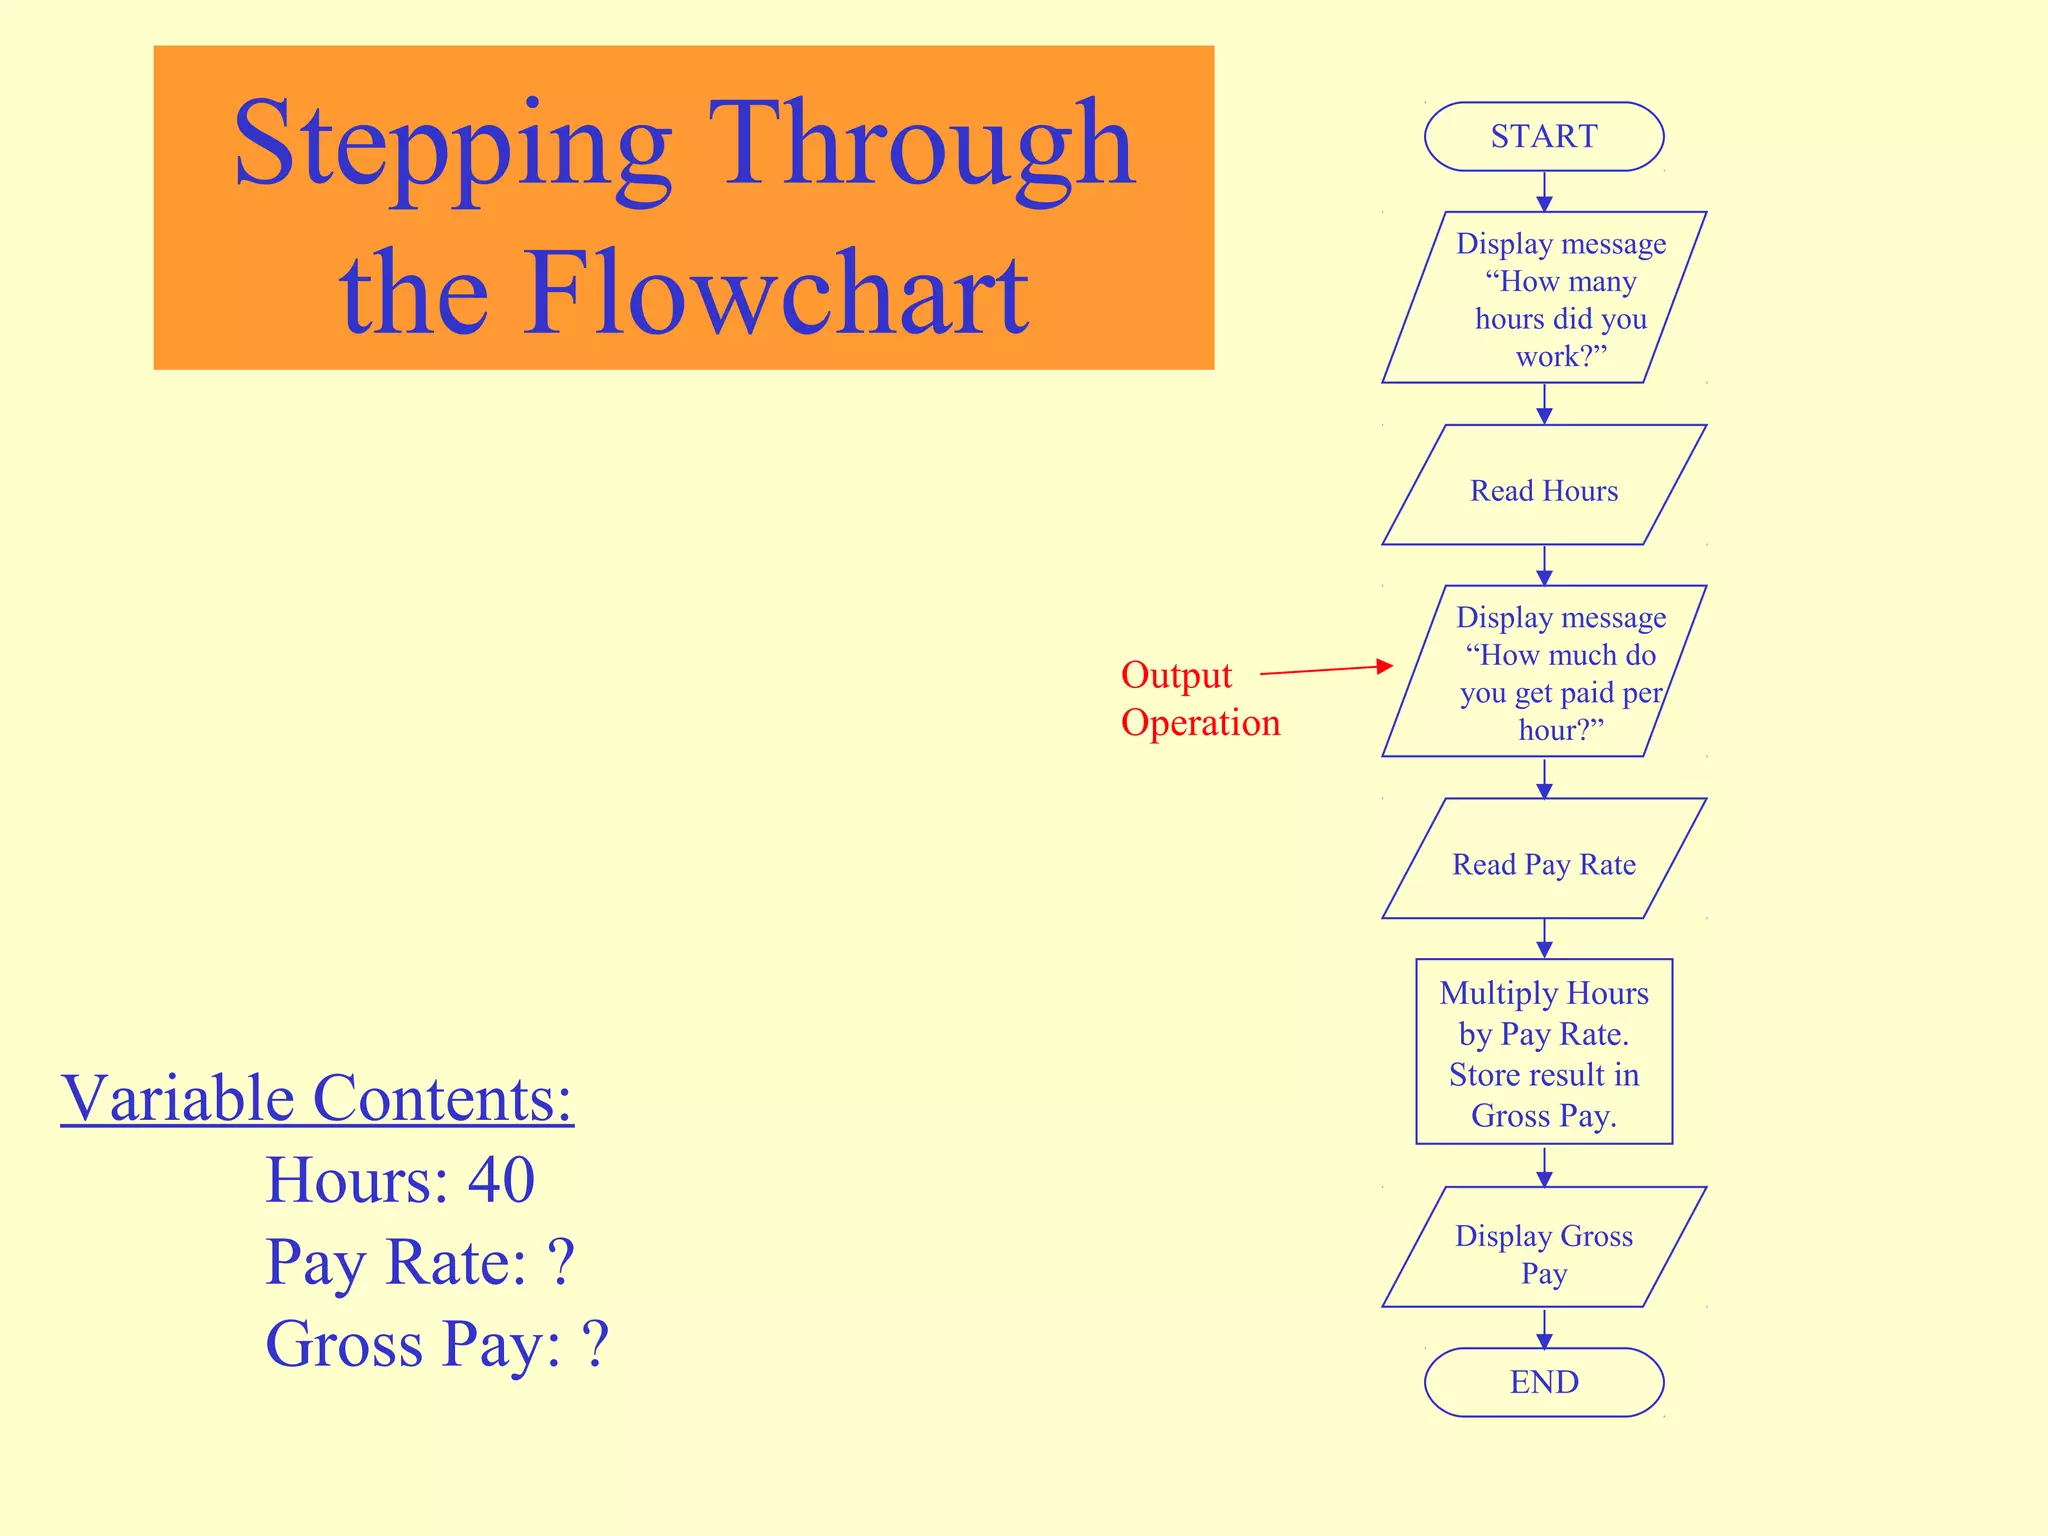
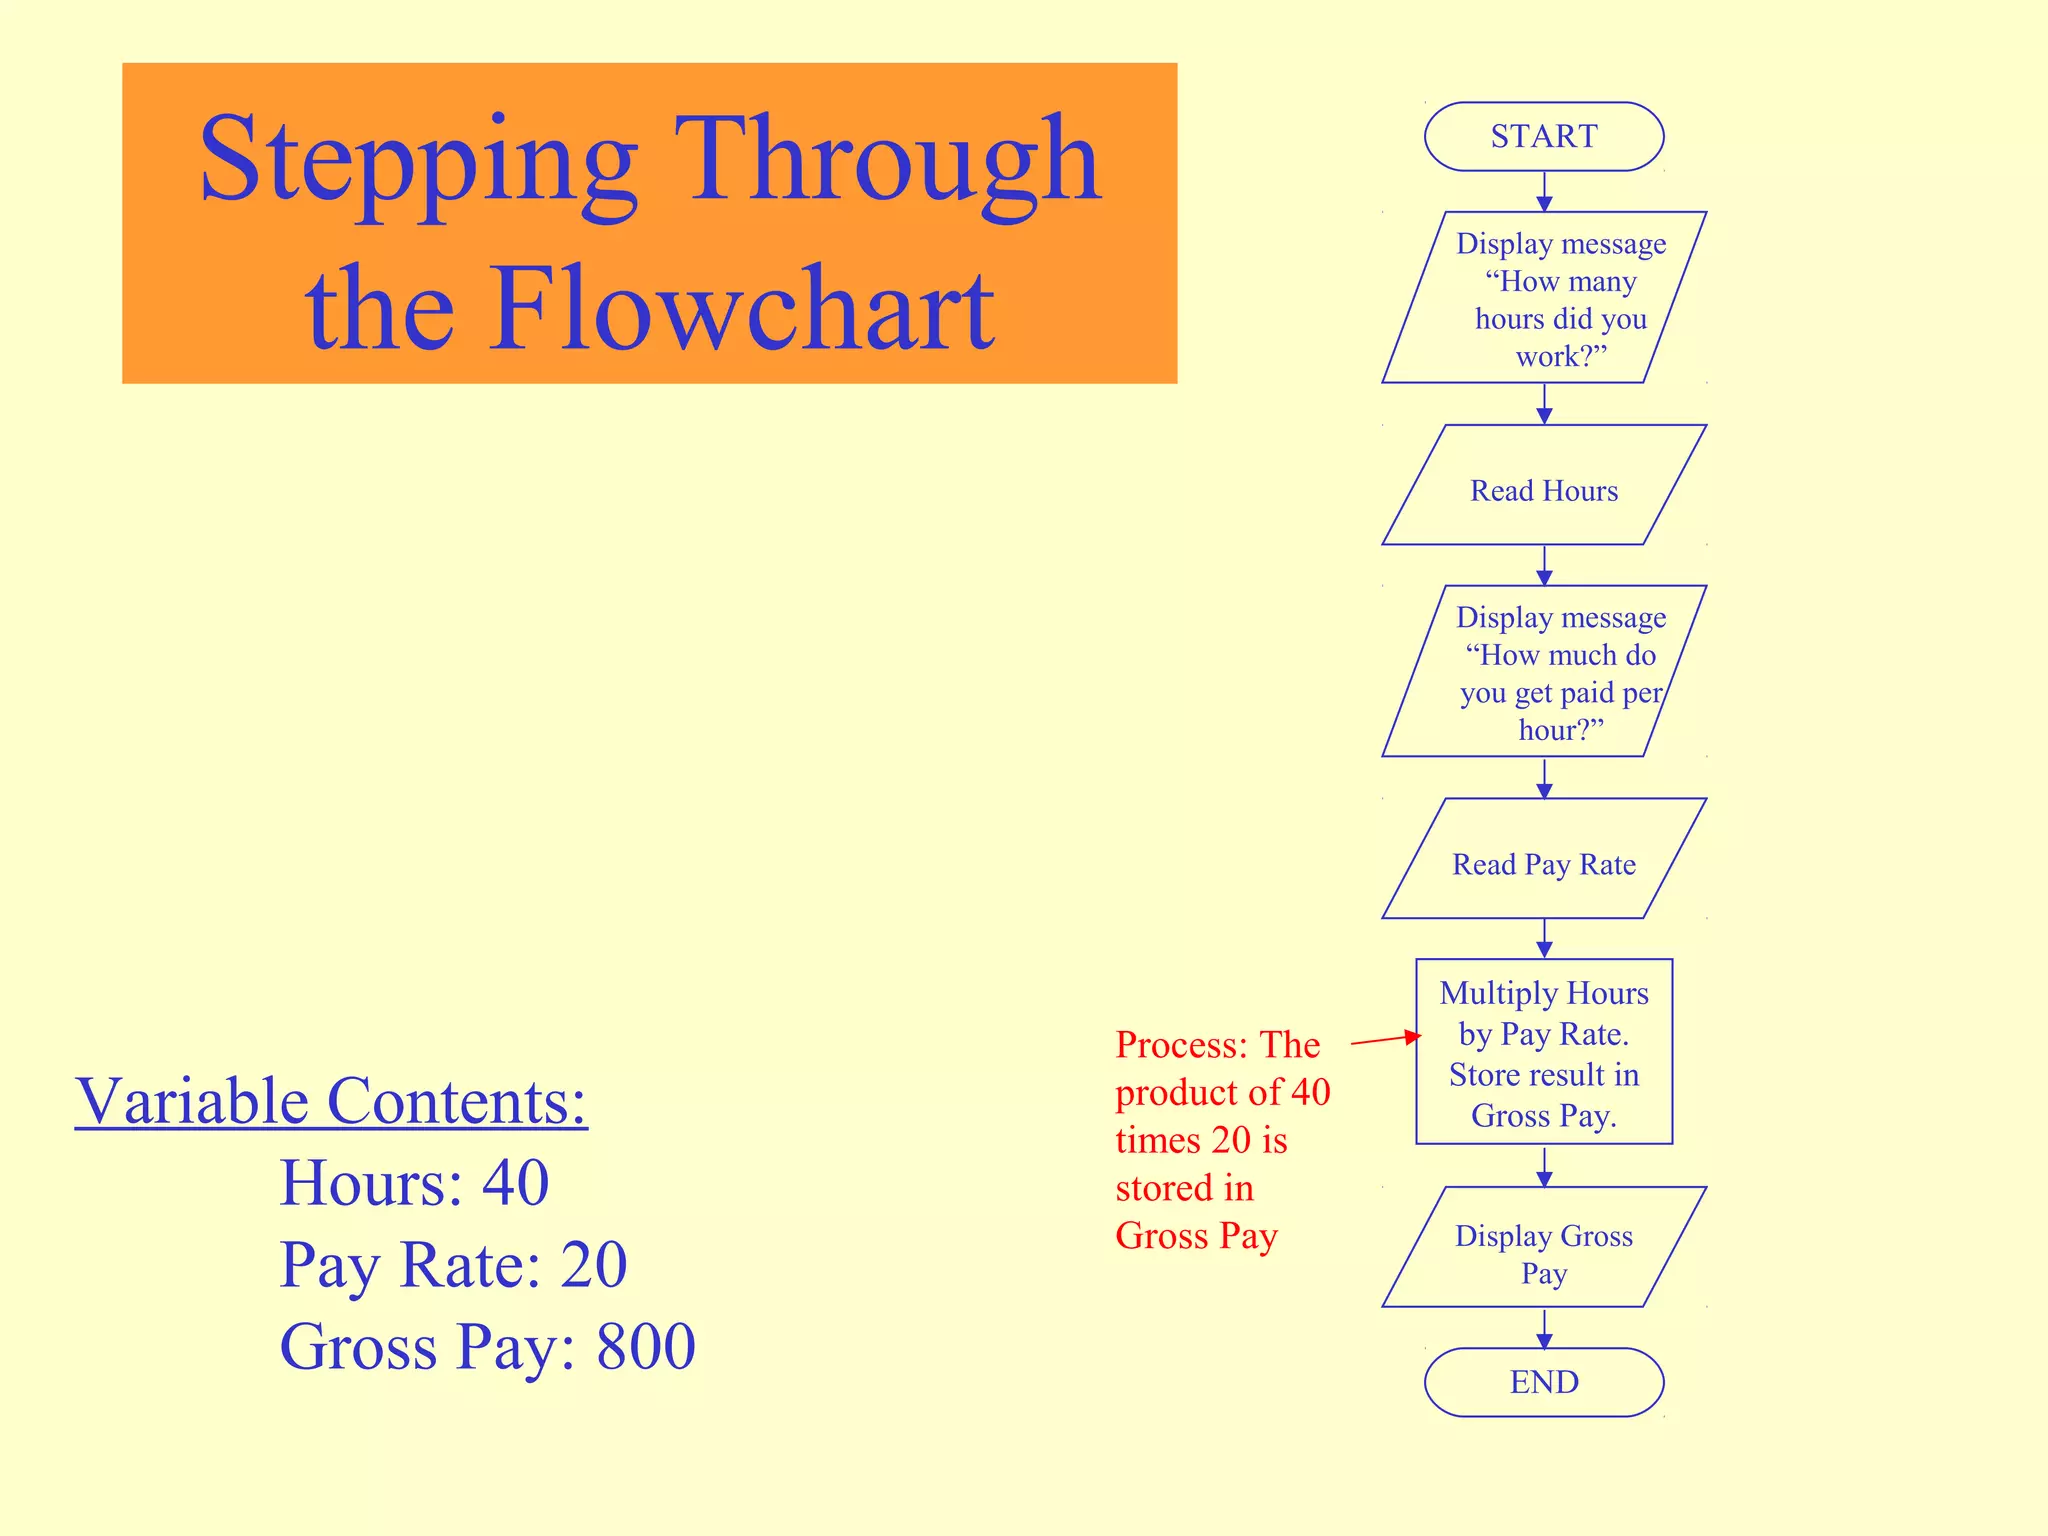
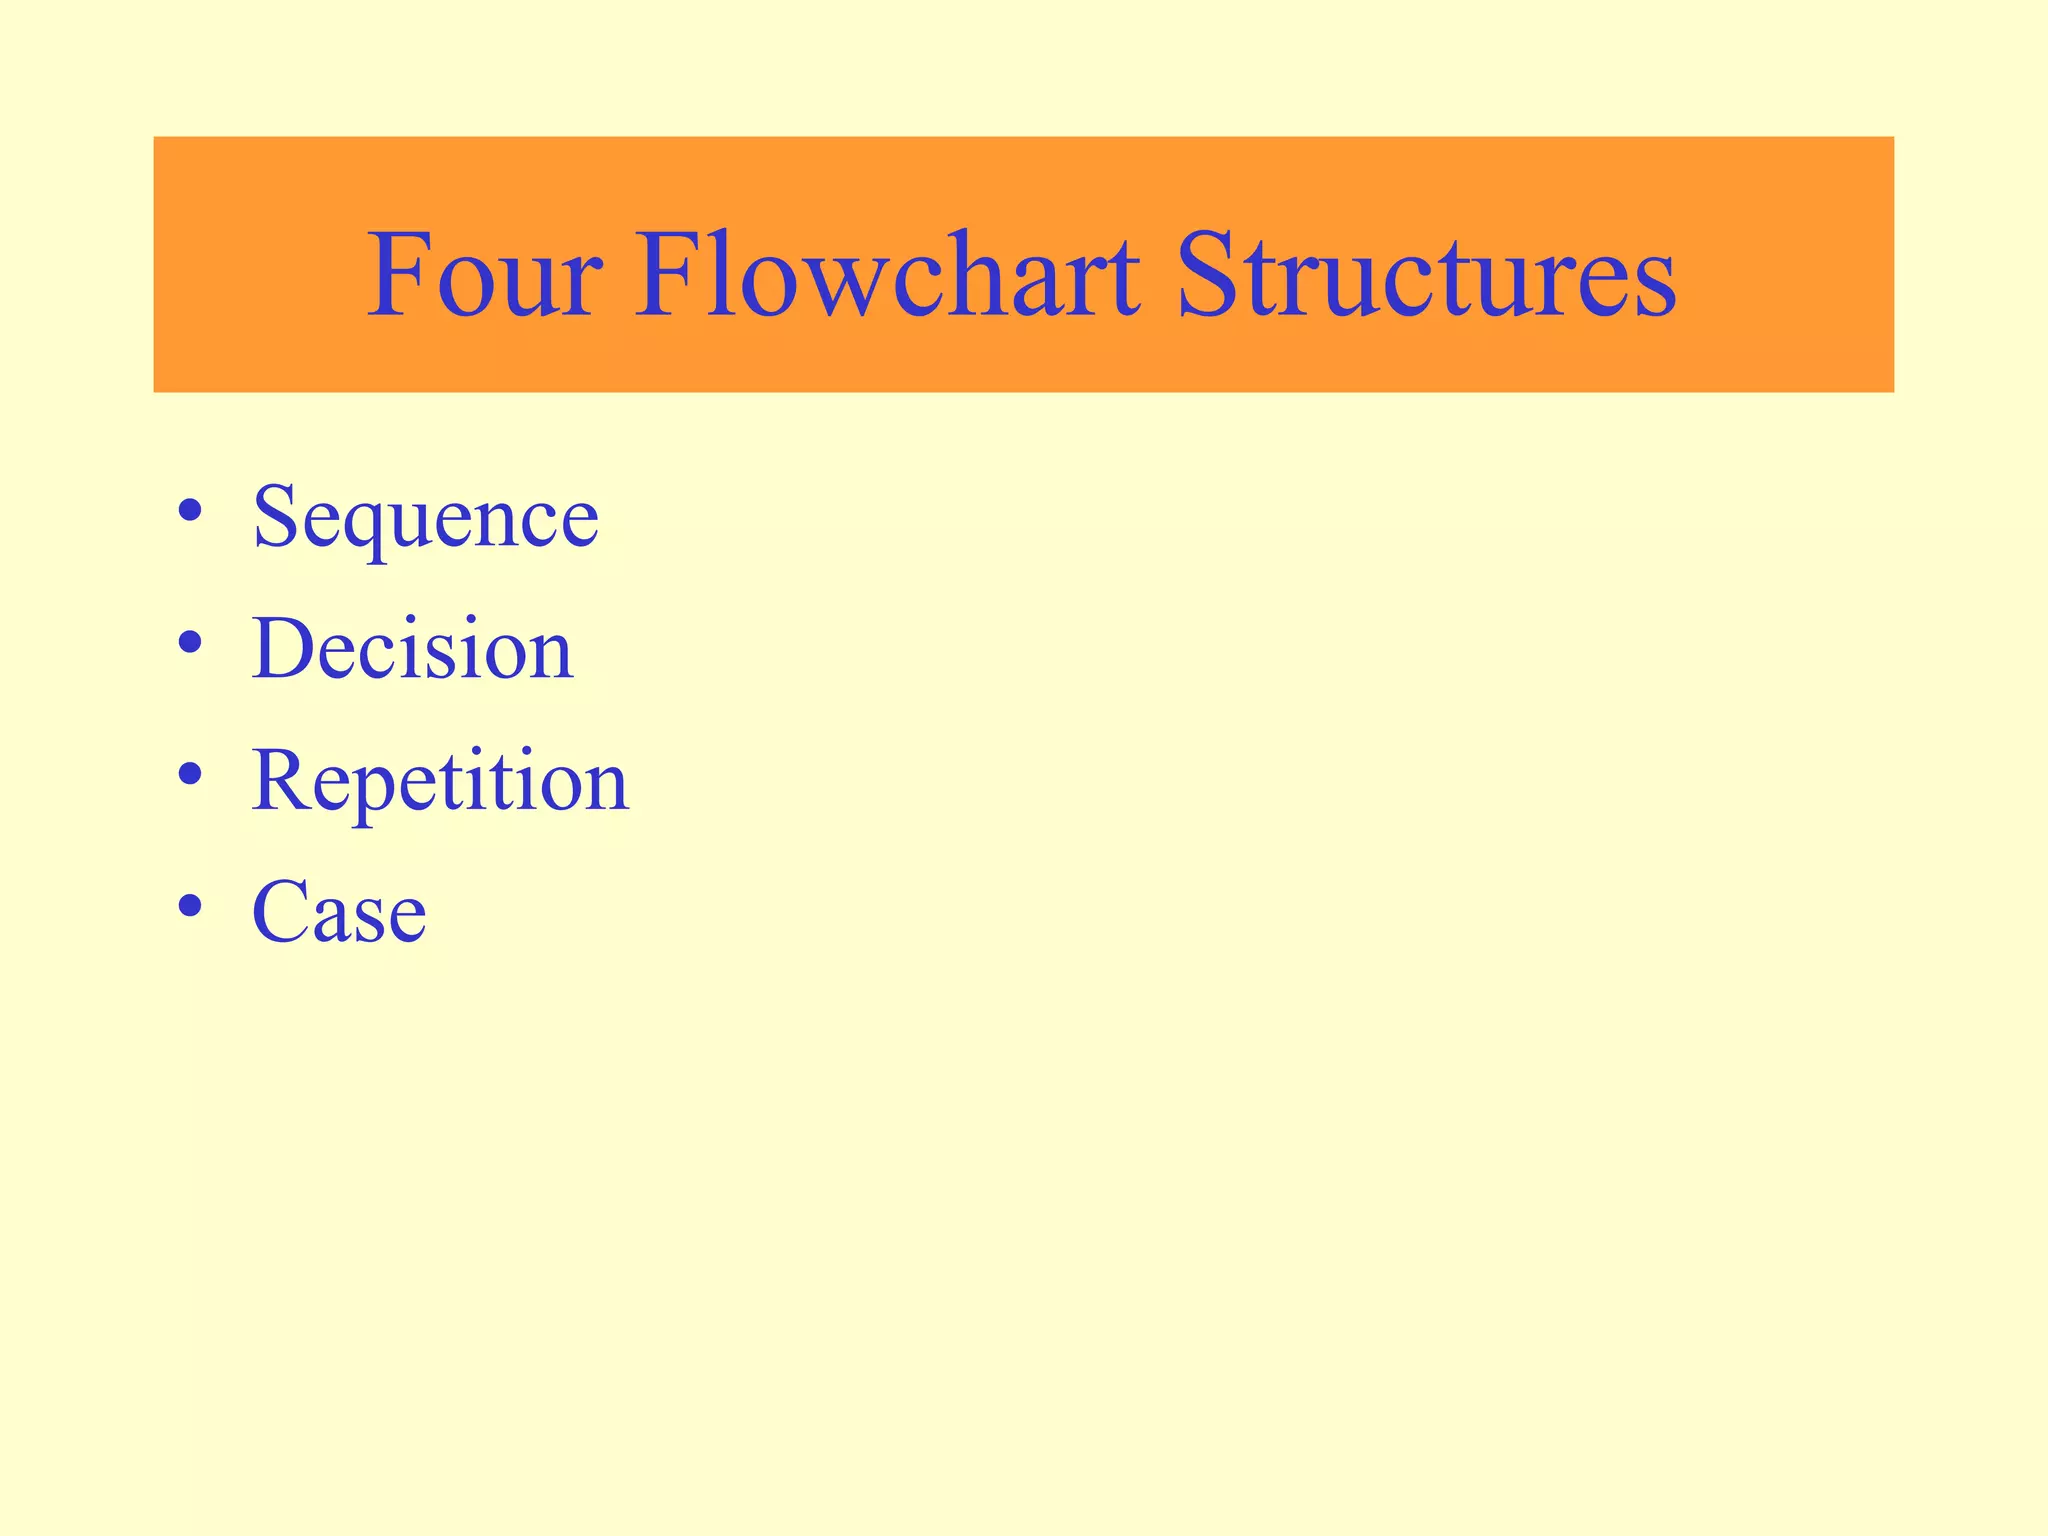
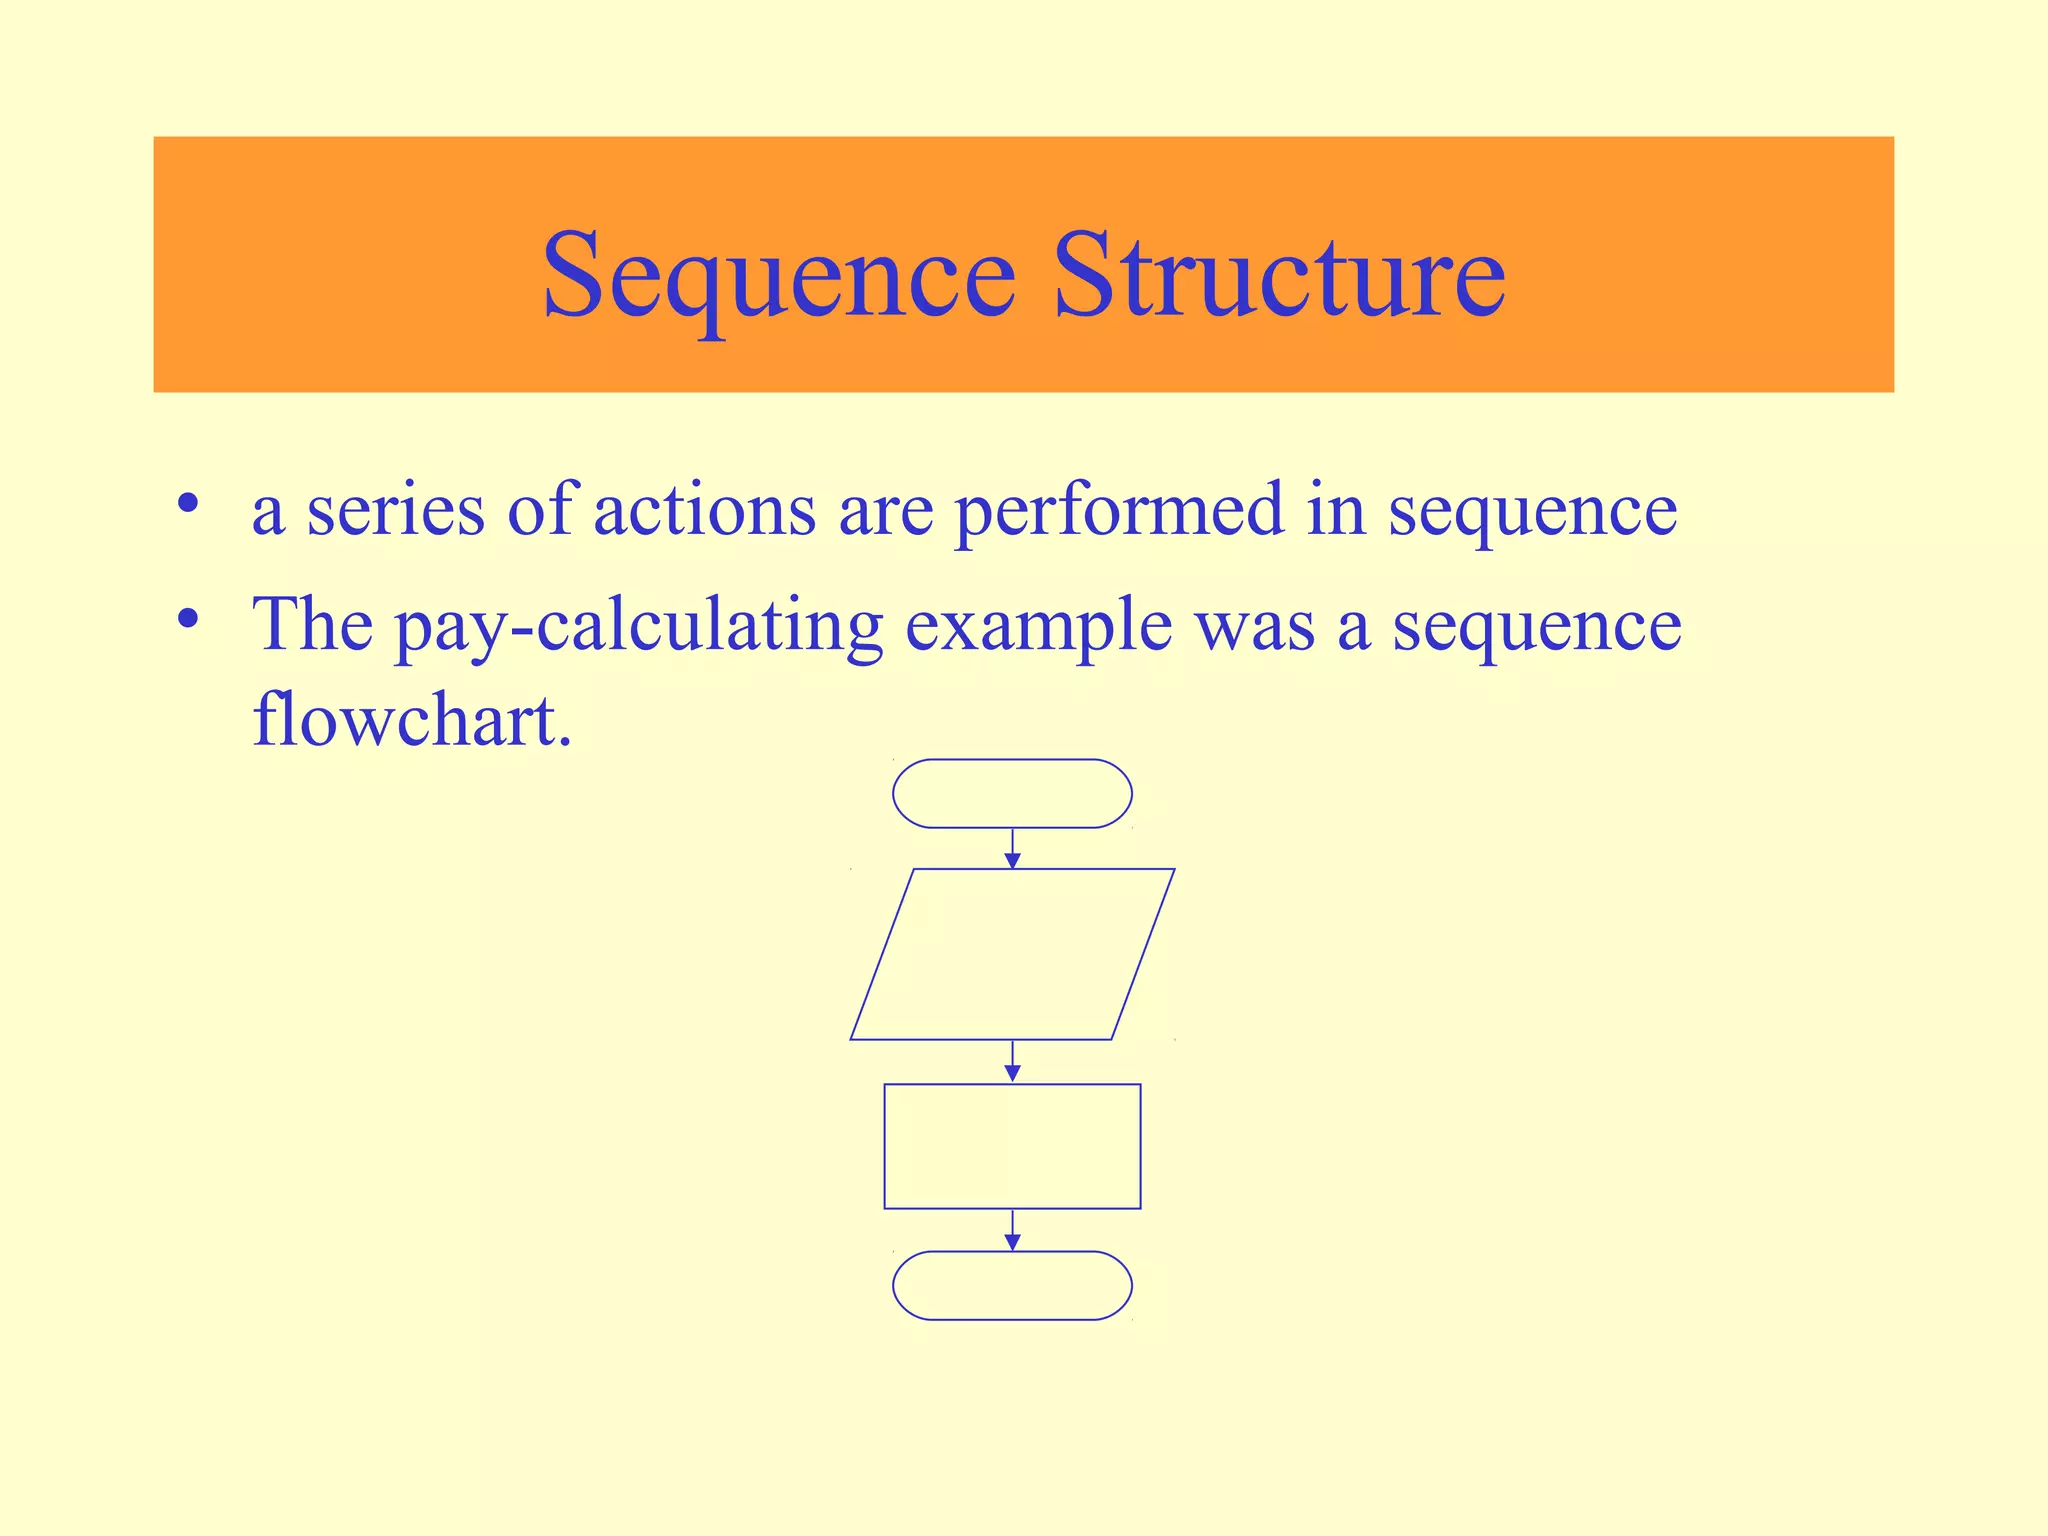
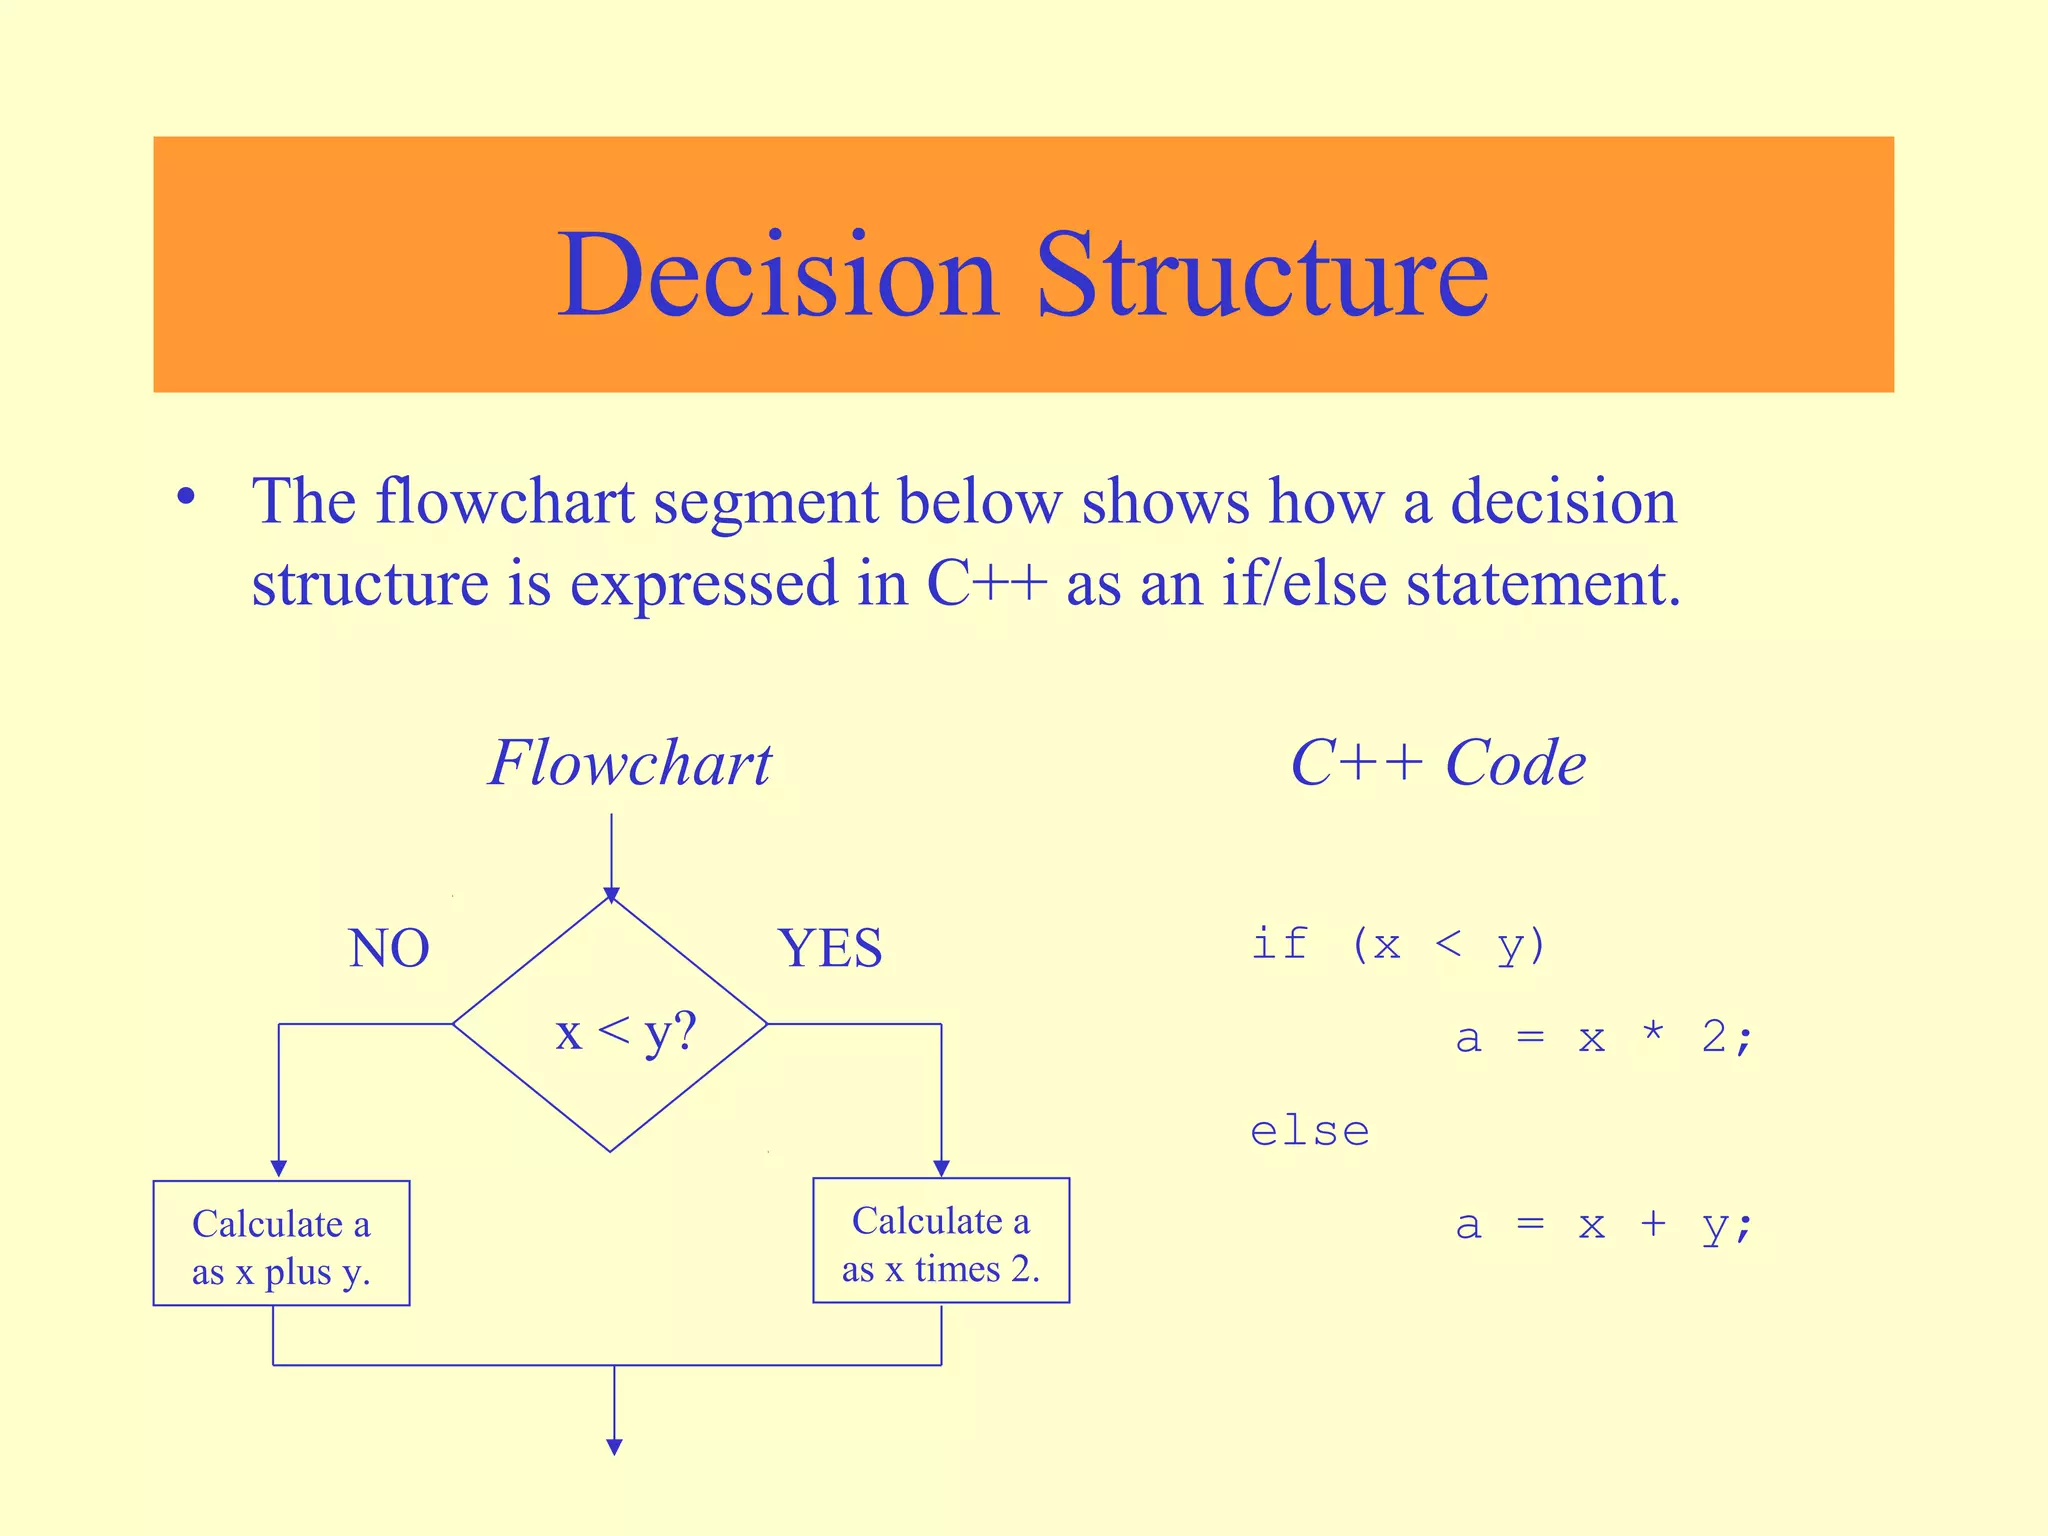
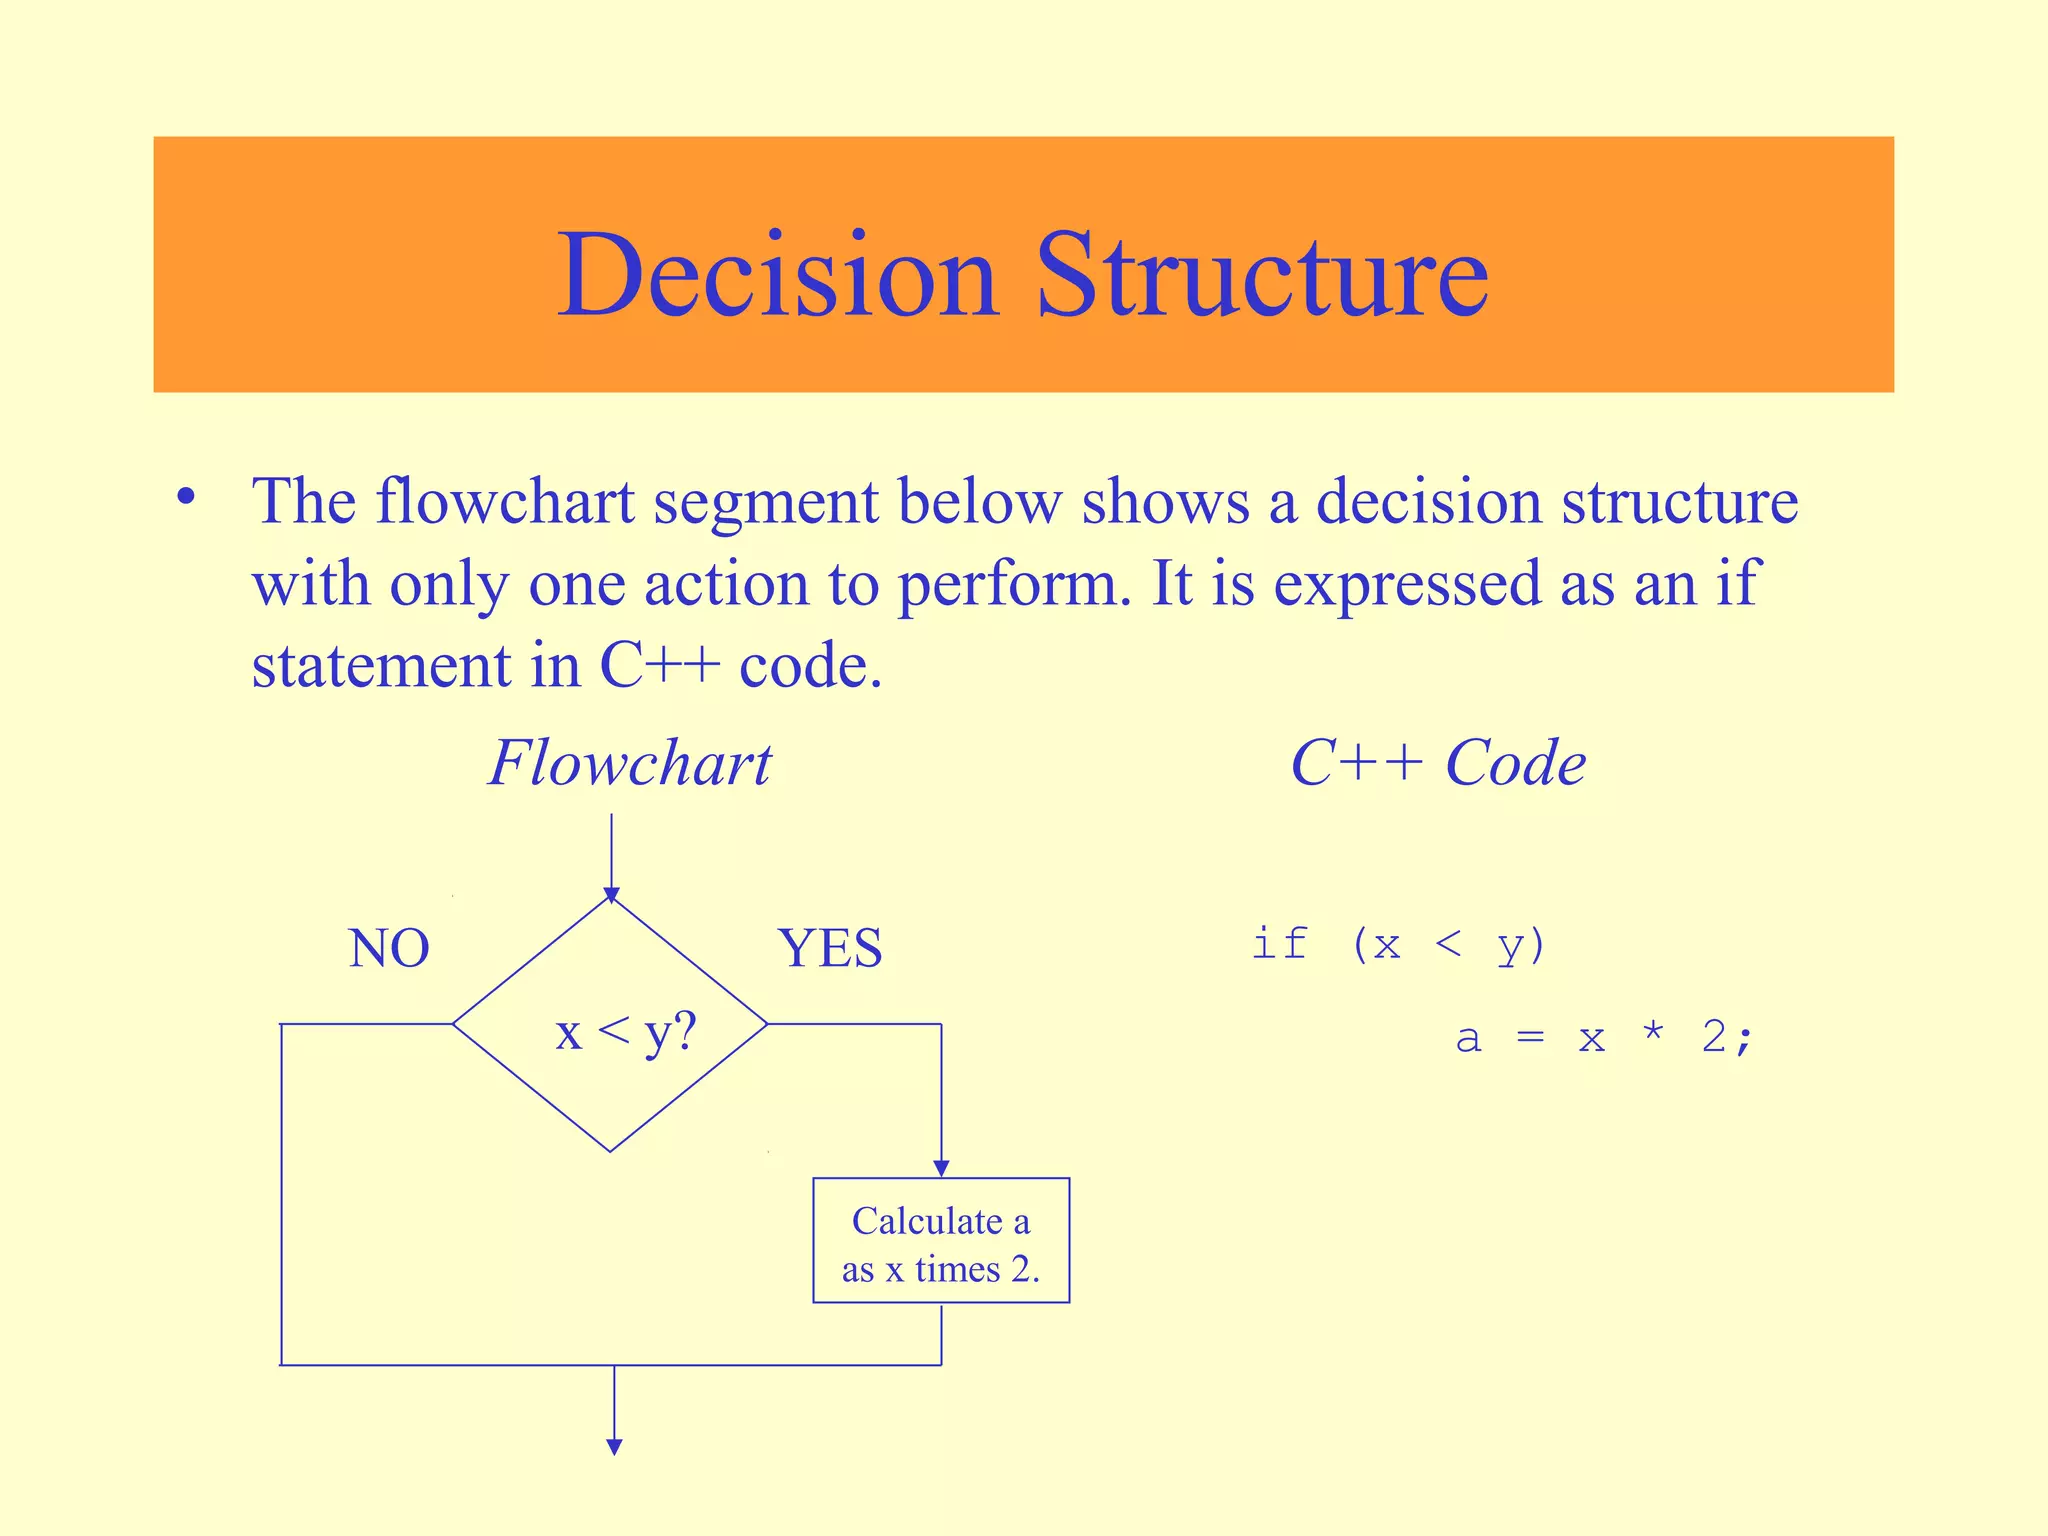
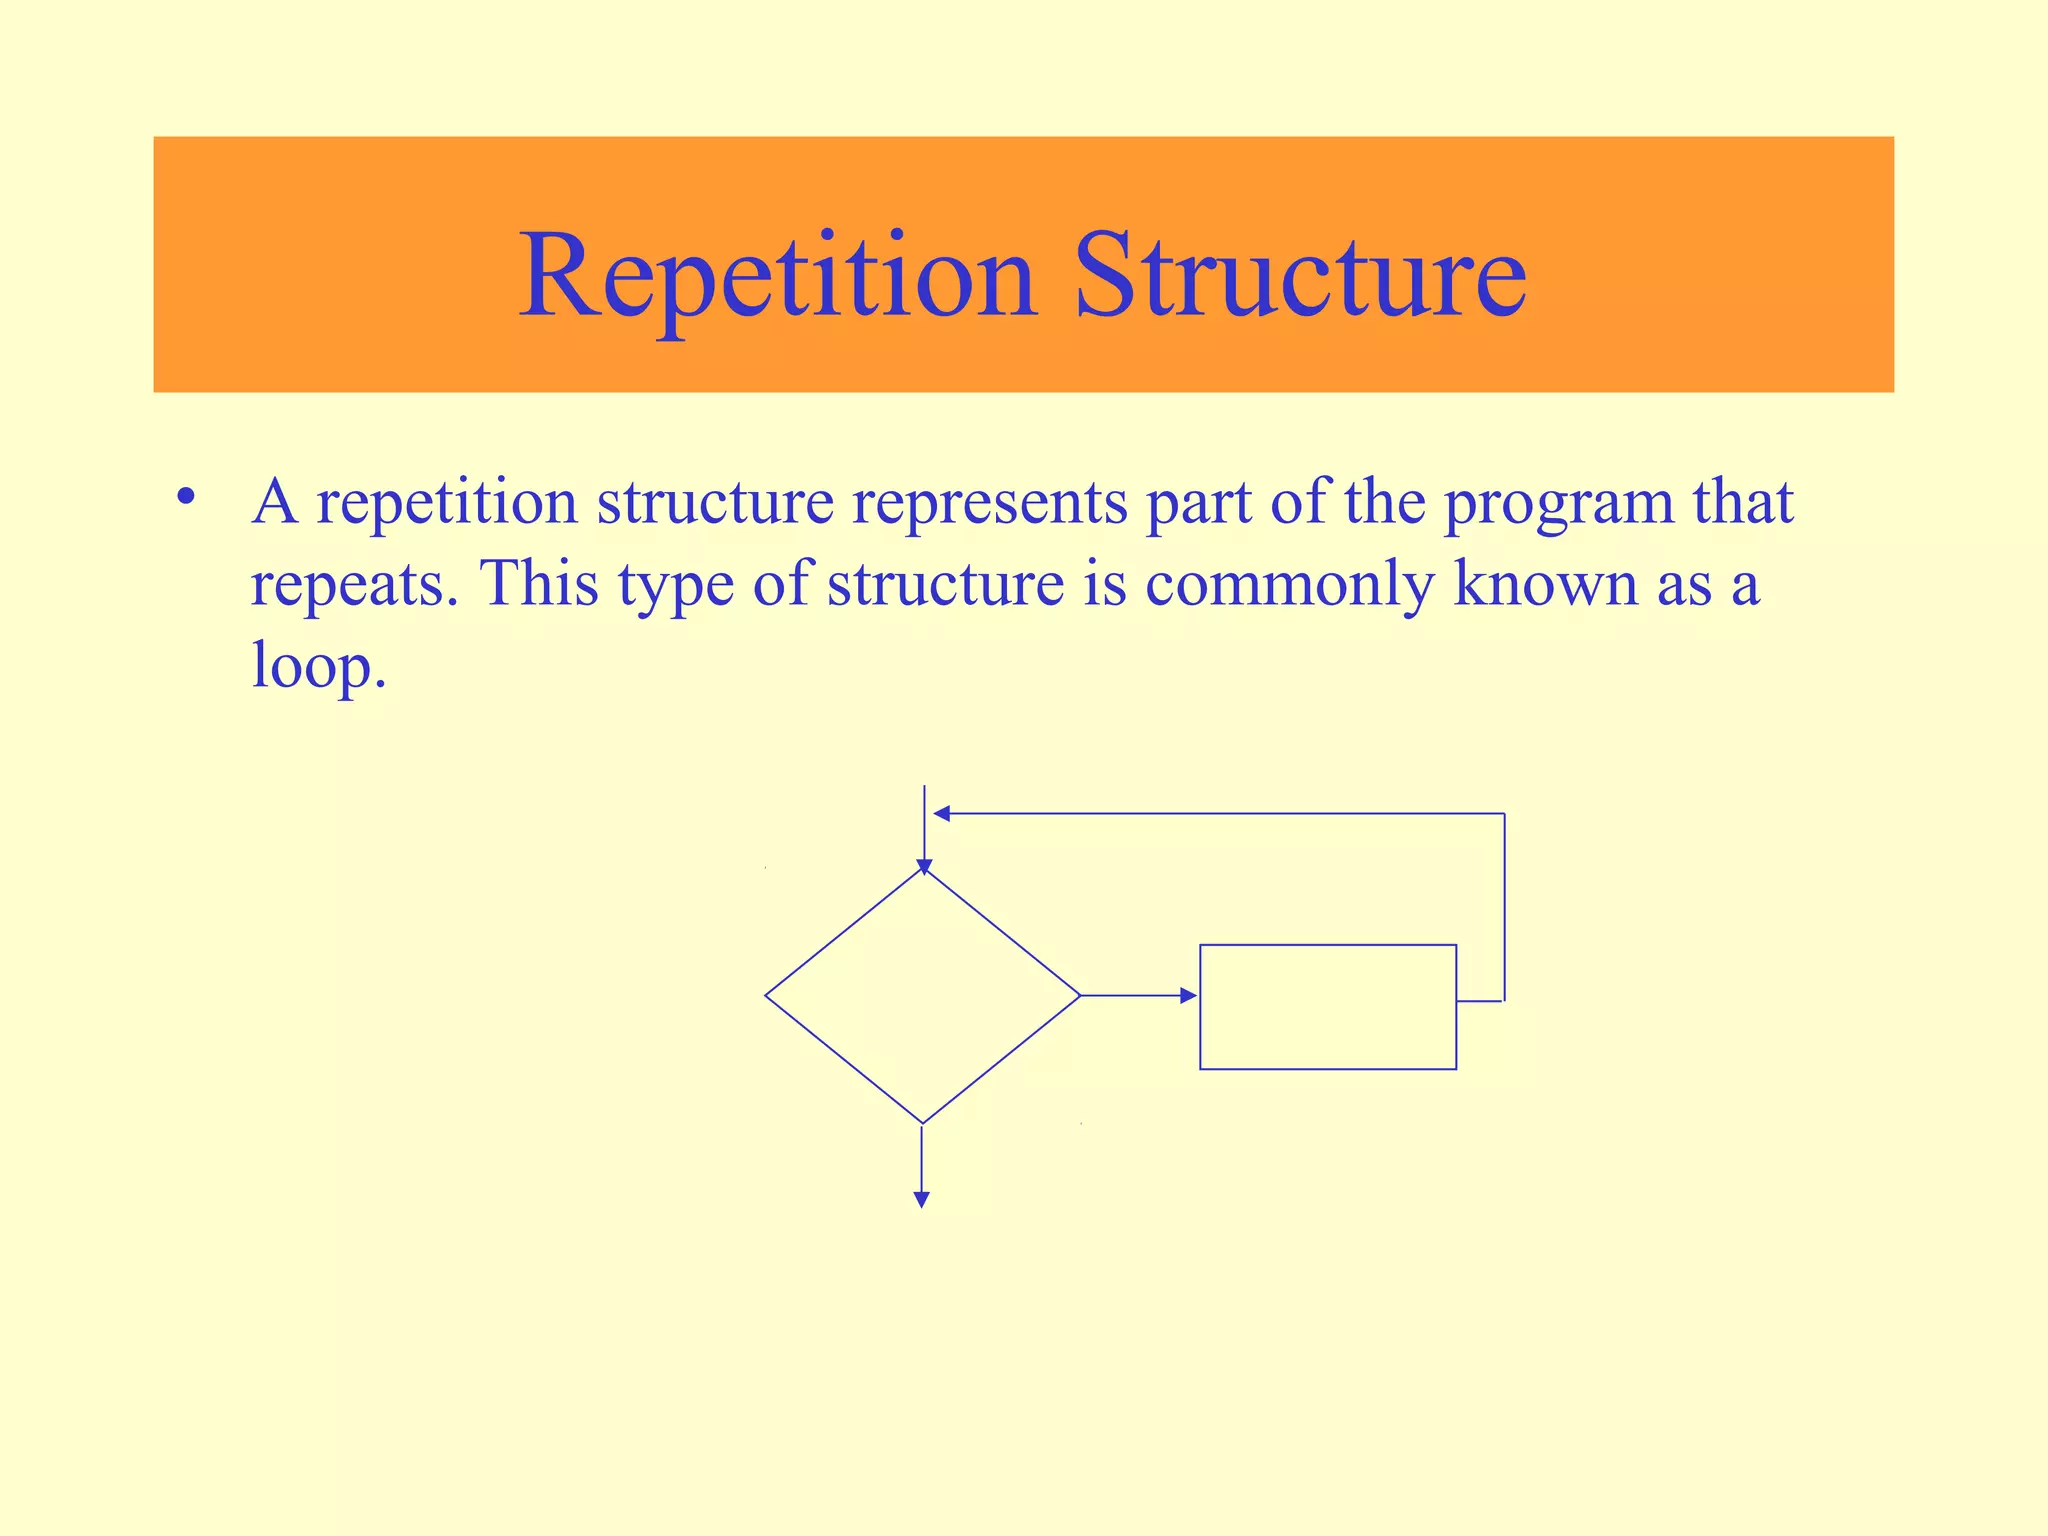
The document introduces flowcharting and flowchart symbols. It defines a flowchart as a graphical representation of a process or program showing the steps as boxes of different shapes linked with arrows. The basic symbols are terminals (rounded rectangles for start/end), input/output operations (parallelograms), and processes (rectangles). An example flowchart calculates an employee's pay. There are four common structures: sequence, decision, repetition, and case. Connectors are used to split long flowcharts across pages.