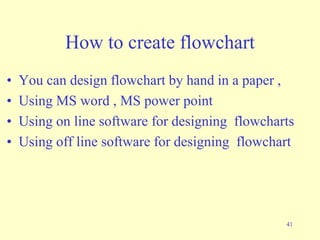
Identify and explain the problem-solving steps. • Compare/contrast ideas within algorithms (pseudo-code and Flowcharts) to apply logical thinking in problem-solving.
3. • Lo C S. 1.04 w5 w6 Identify and
explain the problem-solving
steps. • Compare/contrast
ideas within algorithms
(pseudo-code and
Flowcharts) to apply logical
thinking in problem-solving.
4. Essential Questions
• What conditions, attitudes, and
behaviors support creativity and
innovative thinking?
• 2- How are flowcharts used in
planning a process used to solve
a step-by-step solution to a given
problem?
5. Designing Software With Flowcharts
And Pseudo-code
In this section you will learn two
different ways of laying out a computer
algorithm independent of programming
language
6. A Model For Creating Computer
Software
• Specify the problem
• Develop a design
(algorithm)
• Implement the design
• Maintain the design
7. What Is An Algorithm?
• The steps needed to solve a
problem
• Characteristics
–Specific
–Unambiguous الغموض من خالية
–Language independent
8. Developing An Algorithm: Top-
Down Approach
General approach
Approach
to part of
problem
Specific
steps
Specific
steps
Specific
steps
Specific
steps
Approach
to part of
problem
Approach
to part of
problem
Abstract
Particular
Top
Bottom
Figure extracted from Computer Science
Illuminated by Dale N. and Lewis J.
The algorithm
11. Pseudo-Code Statements
• Output
• Input
• Process
• Decision
• Repetition
Statements are carried out in order
Example: calling up a friend
1) Look up telephone number
2) Enter telephone number
3) Wait for someone to answer
: :
12. Listen to this video about
flowchart in general
• Listen to this video about flowchart
• Off line
• On line
12
13. 13
What is a Flowchart?
• A flowchart is a
diagram that depicts
the “flow” of a
program.
• The figure shown here
is a flowchart for the
pay-calculating
program shown in
Program 1-1.
START
Display message
“How many
hours did you
work?”
Read Hours
Display message
“How much do
you get paid per
hour?”
Read PayRate
Multiply Hours
by PayRate.
Store result in
GrossPay.
Display
GrossPay
END
14. 14
Basic Flowchart
Symbols
• Terminals
– represented by rounded
rectangles
– indicate a starting or
ending point
START
Display message
“How many
hours did you
work?”
Read Hours
Display message
“How much do
you get paid per
hour?”
Read PayRate
Multiply Hours
by PayRate.
Store result in
GrossPay.
Display
GrossPay
END
Terminal
START
END Terminal
15. 15
Basic Flowchart
Symbols
• Input/Output Operations
– represented by
parallelograms
– indicate an input or output
operation
START
Display message
“How many
hours did you
work?”
Read Hours
Display message
“How much do
you get paid per
hour?”
Read PayRate
Multiply Hours
by PayRate.
Store result in
GrossPay.
Display
GrossPay
END
Display message
“How many
hours did you
work?”
Read Hours
Input/Output
Operation
16. 16
Basic Flowchart
Symbols
• Processes
– represented by rectangles
– indicates a process such as
a mathematical
computation or variable
assignment
START
Display message
“How many
hours did you
work?”
Read Hours
Display message
“How much do
you get paid per
hour?”
Read PayRate
Multiply Hours
by PayRate.
Store result in
GrossPay.
Display
GrossPay
END
Multiply Hours
by PayRate.
Store result in
GrossPay.
Process
18. 18
Sequence Structure
• A series of actions are performed in sequence
• The pay-calculating example was a sequence
flowchart.
19. 19
Decision Structure
• The flowchart segment below shows how a decision
structure is expressed in C++ as an if/else statement.
YESNO
x < y?
Calculate a
as x times 2.
Calculate a
as x plus y.
if (x < y)
a = x * 2;
else
a = x + y;
Flowchart C++ Code
20. 20
Decision Structure
• The flowchart segment below shows a decision structure
with only one action to perform. It is expressed as an if
statement in C++ code.
if (x < y)
a = x * 2;
Flowchart C++ Code
YESNO
x < y?
Calculate a
as x times 2.
21. 21
Repetition Structure
• The flowchart segment below shows a repetition structure
expressed in C++ as a while loop.
while (x < y)
x++;
Flowchart C++ Code
x < y? Add 1 to x
YES
22. 22
Controlling a Repetition
Structure
• The action performed by a repetition structure must
eventually cause the loop to terminate. Otherwise, an
infinite loop is created.
• In this flowchart segment, x is never changed. Once the
loop starts, it will never end.
• QUESTION: How can this
flowchart be modified so
it is no longer an infinite
loop?
x < y? Display x
YES
24. 24
Case Structure
CASE
years_employed
1 2 3 Other
bonus = 100 bonus = 200 bonus = 400 bonus = 800
If years_employed = 1,
bonus is set to 100
If years_employed = 2,
bonus is set to 200
If years_employed = 3,
bonus is set to 400
If years_employed is
any other value, bonus
is set to 800
26. 26
Modules
•The position of the module
symbol indicates the point the
module is executed.
•A separate flowchart can be
constructed for the module.
START
END
Read Input.
Call calc_pay
function.
Display results.
27. 27
• This flowchart segment
shows two decision
structures combined.
Combining Structures
Display “x is
within limits.”
Display “x is
outside the limits.”
YESNO
x > min?
x < max?
YESNO
Display “x is
outside the limits.”
28. 28
Review
• What do each of the following symbols
represent?
(Answer on next slide)
29. 29
Answer
• What do each of the following symbols
represent?
Terminal
Input/Output
Operation
Process
Decision
Connector
Module
40. Listen to this video about how to
draw flowchart
• Listen to this video about flowchart
• Off line
• On line
40
41. How to create flowchart
• You can design flowchart by hand in a paper ,
• Using MS word , MS power point
• Using on line software for designing flowcharts
• Using off line software for designing flowchart
41
46. Listen to this video about
Animated EDP Flow Chart
• Listen to this video about flowchart
• Off line
• On line
46
47. Summary
• Laying out an algorithm using flowcharts
and pseudo-code
• Learning basic elements of algorithms:
– Input
– Output
– Decision-Making
– Repetition
– Processes
– Learning basic elements of flow chart