Download to read offline

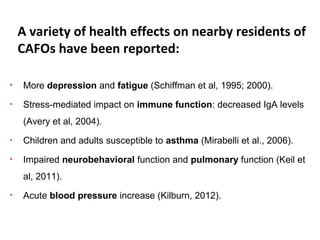

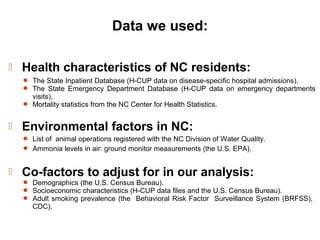

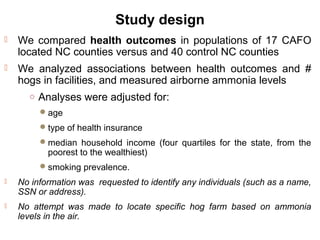


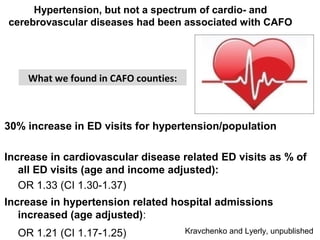
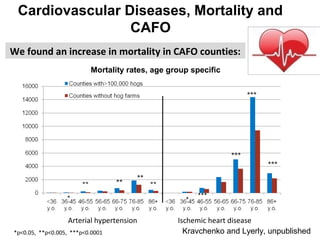
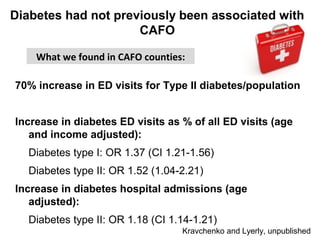
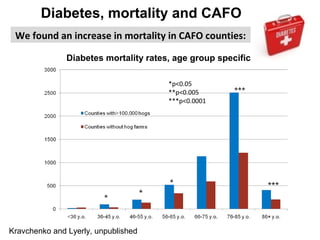


The study analyzed health outcomes in populations living in 17 North Carolina counties with concentrated animal feeding operations (CAFOs) housing over 100,000 hogs, compared to populations in 40 counties without hog CAFOs. After adjusting for demographics and socioeconomic factors, the study found higher rates of emergency department visits and hospital admissions in CAFO counties for several diseases, including infectious diseases (30% increase), respiratory diseases (20% increase), hypertension (30% increase), diabetes (70% increase), kidney diseases (30% increase), complications of pregnancy (25% increase), and epilepsy (70% increase). Mortality rates were also higher in CAFO counties for some of these conditions. The results suggest vulnerable populations like children and


![Fibrosis[1]](https://cdn.slidesharecdn.com/ss_thumbnails/fibrosis1-110222070442-phpapp01-thumbnail.jpg?width=640&height=640&fit=bounds)


