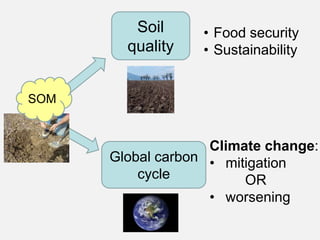
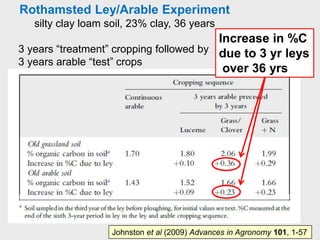
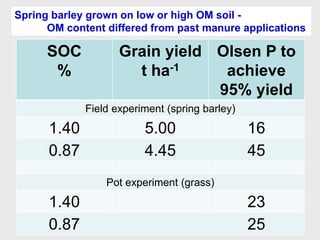
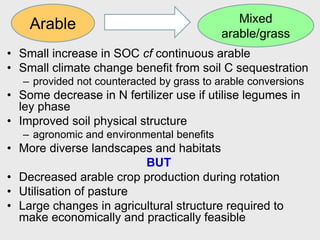
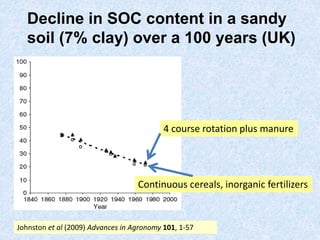
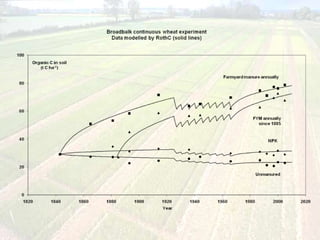
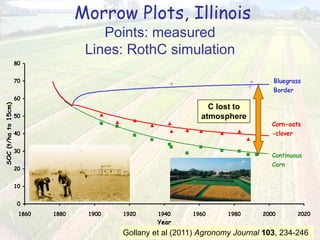
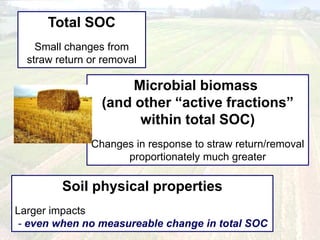
Potential soil organic matter
benefits from mixed farming:
evidence from long-term
experiments
David Powlson & “Johnny” Johnston
Lawes Trust Senior Fellows
Department of Sustainable Soils & Grassland Systems
Rothamsted Research, UK
Mixed livestock & arable farming
Pros
• Recycling nutrients
from manure
• N inputs from
biological N2 fixation in
ley phase – decreased
need for N fertilizer
• SOM content likely to
be higher cf
continuous arable
• Landscape, habitats
Cons
• Costs of fencing
• Costs & labour for
animal husbandry
• Economics
• Inability to specialise
(for small enterprises)
• Less total grain/arable
production during
rotation
Soil – Earth’s Living Skin
Soil
quality
Global carbon
cycle
• Food security
• Sustainability
Climate change:
• mitigation
OR
• worsening
SOM
Organic inputs and outputs
Powlson, Smith, De Nobili (in Soil Conditions and Plant Growth,
Eds. PJ Gregory & S Nortcliff, 2013)
Results in an equilibrium SOC content characteristic
of soil type, climate, cropping system
Extremes of SOC change in
agricultural soils
SOC changes following land use change,
Rothamsted
40
30
20
10
0
1960
90
1940
70
50
80
100
60
20001980
Year
-1
Started arable
Started grass
Johnston et al (2009) Advances in Agronomy 101, 1-57
Movement
towards new
equilibrium
SOC content
Woburn Ley-arable Experiment (started 1938)
Continuous arable
with fallows
Continuous arable
3 year grass/clover ley
Woburn Ley/Arable Experiment
sandy loam soil, 7% clay, 60 years
3 years “treatment” cropping followed by
2 years arable “test” crops
Johnston et al (2009) Advances in Agronomy 101, 1-57
“Treatment”
cropping
3 year grass ley + N
%C increase ≈ 0.23%
SOC increases from leys cf
continuous arable cropping
• Sandy soil:
approx. 6.8 t ha-1 in 60 yrs (generous),
(but difference established in approx. 30 yrs
then no further increase)
≈ 0.2 t C ha-1 yr-1
Rothamsted Ley/Arable Experiment
silty clay loam soil, 23% clay, 36 years
3 years “treatment” cropping followed by
3 years arable “test” crops
Johnston et al (2009) Advances in Agronomy 101, 1-57
Increase in %C
due to 3 yr leys
over 36 yrs
SOC increases from leys cf
continuous arable cropping
• Sandy soil:
approx. 6.8 t ha-1 in 30 yrs
= 0.2 t C ha-1 yr-1
• Silty clay loam soil:
approx. 7.2 t ha-1 in 36 yrs
= 0.2 t C ha-1 yr-1
Contribution to decreasing
UK GHG emissions
• 4.6 Mha arable land
• Increased SOC from conversion to ley/arable =
0.2 t C ha-1 yr-1 (generous)
= 0.92 Mt C total UK
= 3.37 t CO2e total UK
• UK annual GHG emissions (DECC 2013,
provisional) = 569.9 Mt CO2e
• Annual UK GHG emissions savings through
soil C sequestration from converting all
arable land to ley/arable = 0.6%
A small change in SOC can have
a disproportionately large impact
on soil physical properties
(“soil quality”)
Review of straw experiments
• 25 experiments,
– 6-56 years, Europe, North America, Australia
• All had “straw returned” and “straw removed”
treatments.
• Mainly wheat or barley, some maize, sorghum
• Straw removed
– mainly baled, in a few cases burned.
Powlson, Glendining, Coleman, Whitmore (2011)
Agronomy Journal 103, 279 – 287
• Trend for soil organic C (SOC) content to
increase with straw incorporation – but
effects small.
• Increases only significant in 6 out of 25
experiments, mainly <10%.
• Increases in microbial biomass
proportionately much greater than for total
SOC.
Straw results (1/2)
Powlson, Glendining, Coleman, Whitmore (2011)
Agronomy Journal 103, 279 – 287
Straw results (2/2)
• In some cases soil physical properties measured:
– aggregate stability, penetrometer resistance, water
infiltration rate
– greatly improved with “straw returned” even where no
measurable impact on total SOC.
– similar results for ‘conservation agriculture’ in Africa and
South Asia
• Implications for seedling emergence, root growth, water
infiltration, decreased soil erosion
…………………….
• Evidence from Rothamsted LTEs of positive impact of
increased SOC on yield for short-duration crop (spring
barley) but not long-duration crop (winter wheat).
Improved soil
structure
Greater root
exploration of soil
More efficient capture
of immobile nutrients,
e.g. P
SOC
%
Grain yield
t ha-1
Olsen P to
achieve
95% yield
Field experiment (spring barley)
1.40 5.00 16
0.87 4.45 45
Pot experiment (grass)
1.40 23
0.87 25
Spring barley grown on low or high OM soil -
OM content differed from past manure applications
Concluding comments
Arable Mixed
arable/grass
• Small increase in SOC cf continuous arable
• Small climate change benefit from soil C sequestration
– provided not counteracted by grass to arable conversions
• Some decrease in N fertilizer use if utilise legumes in
ley phase
• Improved soil physical structure
– agronomic and environmental benefits
• More diverse landscapes and habitats
BUT
• Decreased arable crop production during rotation
• Utilisation of pasture
• Large changes in agricultural structure required to
make economically and practically feasible
Arable Mixed
arable/grass
Thanks for your attention
Extra slides
After: -
Continuous arable
3 year grass ley + N
3 year grass/clover ley
Winter wheat Spring barley
Johnston & Poulton (2005)
SOM influencing crop yield through N supply
Decline in SOC content in a sandy
soil (7% clay) over a 100 years (UK)
Johnston et al (2009) Advances in Agronomy 101, 1-57
Continuous cereals, inorganic fertilizers
4 course rotation plus manure
0
1
2
3
4
5
6
7
8
9
10
1840 1860 1880 1900 1920 1940 1960 1980 2000 2020
Grain,t/haat85%drymatter
Cont wheat Unmanured
Cont wheat FYM
Cont wheat N3PK
1st wheat FYM+N2 (+N3 since 2005)
1st wheat Best NPK
Fallowing
Liming
Herbicides
Fungicides
Red Rostock Red Club Sq. Master Red Standard Sq. Master
Cappelle D.
Flanders Apollo
HerewardBrimstone
1st Wheat
Cont. wheat
Modern cultivars
FYM
Broadbalk wheat yields, varieties and major chang
NPK
Grain yield of winter-sown wheat:
not very sensitive to SOC concentration,
despite improved soil structure in FYM treatment
(10 month growing season)
Example of SOM influencing crop yield –
through soil structure or water availability?
Hoosfield spring barley - changing yield trends with changes in variety
1976-79
Julia
1988-91
Triumph
1996-99
Cooper
2004-2007
Optic
Johnston et al (2009) Advances in Agronomy 101, 1-57
FYM
FYM FYM
FYM
PK
PK PK
PK
Modern cultivars of spring-sown barley
(high yield potential):
grain yield is sensitive to SOC
concentration
only (5-6 month growing season)
FYM applied
2001 – 2006
only
Morrow Plots, Illinois
Points: measured
Lines: RothC simulation
0
10
20
30
40
50
60
70
80
1860 1880 1900 1920 1940 1960 1980 2000 2020
Year
SOC(t/hato15cm)
Bluegrass
Border
Continuous
Corn
Corn-oats
-clover
C lost to
atmosphere
Gollany et al (2011) Agronomy Journal 103, 234-246
Total SOC
Small changes from
straw return or removal
Microbial biomass
(and other “active fractions”
within total SOC)
Changes in response to straw return/removal
proportionately much greater
Soil physical properties
Larger impacts
- even when no measureable change in total SOC

Potential soil organic matter benefits from mixed farming: evidence from long-term experiments - David Powlson

  • 1.
    Potential soil organicmatter benefits from mixed farming: evidence from long-term experiments David Powlson & “Johnny” Johnston Lawes Trust Senior Fellows Department of Sustainable Soils & Grassland Systems Rothamsted Research, UK
  • 2.
    Mixed livestock &arable farming Pros • Recycling nutrients from manure • N inputs from biological N2 fixation in ley phase – decreased need for N fertilizer • SOM content likely to be higher cf continuous arable • Landscape, habitats Cons • Costs of fencing • Costs & labour for animal husbandry • Economics • Inability to specialise (for small enterprises) • Less total grain/arable production during rotation
  • 3.
    Soil – Earth’sLiving Skin
  • 4.
    Soil quality Global carbon cycle • Foodsecurity • Sustainability Climate change: • mitigation OR • worsening SOM
  • 5.
    Organic inputs andoutputs Powlson, Smith, De Nobili (in Soil Conditions and Plant Growth, Eds. PJ Gregory & S Nortcliff, 2013) Results in an equilibrium SOC content characteristic of soil type, climate, cropping system
  • 6.
    Extremes of SOCchange in agricultural soils
  • 7.
    SOC changes followingland use change, Rothamsted 40 30 20 10 0 1960 90 1940 70 50 80 100 60 20001980 Year -1 Started arable Started grass Johnston et al (2009) Advances in Agronomy 101, 1-57 Movement towards new equilibrium SOC content
  • 8.
  • 9.
    Continuous arable with fallows Continuousarable 3 year grass/clover ley Woburn Ley/Arable Experiment sandy loam soil, 7% clay, 60 years 3 years “treatment” cropping followed by 2 years arable “test” crops Johnston et al (2009) Advances in Agronomy 101, 1-57 “Treatment” cropping 3 year grass ley + N %C increase ≈ 0.23%
  • 10.
    SOC increases fromleys cf continuous arable cropping • Sandy soil: approx. 6.8 t ha-1 in 60 yrs (generous), (but difference established in approx. 30 yrs then no further increase) ≈ 0.2 t C ha-1 yr-1
  • 11.
    Rothamsted Ley/Arable Experiment siltyclay loam soil, 23% clay, 36 years 3 years “treatment” cropping followed by 3 years arable “test” crops Johnston et al (2009) Advances in Agronomy 101, 1-57 Increase in %C due to 3 yr leys over 36 yrs
  • 12.
    SOC increases fromleys cf continuous arable cropping • Sandy soil: approx. 6.8 t ha-1 in 30 yrs = 0.2 t C ha-1 yr-1 • Silty clay loam soil: approx. 7.2 t ha-1 in 36 yrs = 0.2 t C ha-1 yr-1
  • 13.
    Contribution to decreasing UKGHG emissions • 4.6 Mha arable land • Increased SOC from conversion to ley/arable = 0.2 t C ha-1 yr-1 (generous) = 0.92 Mt C total UK = 3.37 t CO2e total UK • UK annual GHG emissions (DECC 2013, provisional) = 569.9 Mt CO2e • Annual UK GHG emissions savings through soil C sequestration from converting all arable land to ley/arable = 0.6%
  • 14.
    A small changein SOC can have a disproportionately large impact on soil physical properties (“soil quality”)
  • 15.
    Review of strawexperiments • 25 experiments, – 6-56 years, Europe, North America, Australia • All had “straw returned” and “straw removed” treatments. • Mainly wheat or barley, some maize, sorghum • Straw removed – mainly baled, in a few cases burned. Powlson, Glendining, Coleman, Whitmore (2011) Agronomy Journal 103, 279 – 287
  • 16.
    • Trend forsoil organic C (SOC) content to increase with straw incorporation – but effects small. • Increases only significant in 6 out of 25 experiments, mainly <10%. • Increases in microbial biomass proportionately much greater than for total SOC. Straw results (1/2) Powlson, Glendining, Coleman, Whitmore (2011) Agronomy Journal 103, 279 – 287
  • 17.
    Straw results (2/2) •In some cases soil physical properties measured: – aggregate stability, penetrometer resistance, water infiltration rate – greatly improved with “straw returned” even where no measurable impact on total SOC. – similar results for ‘conservation agriculture’ in Africa and South Asia • Implications for seedling emergence, root growth, water infiltration, decreased soil erosion ……………………. • Evidence from Rothamsted LTEs of positive impact of increased SOC on yield for short-duration crop (spring barley) but not long-duration crop (winter wheat).
  • 18.
    Improved soil structure Greater root explorationof soil More efficient capture of immobile nutrients, e.g. P
  • 19.
    SOC % Grain yield t ha-1 OlsenP to achieve 95% yield Field experiment (spring barley) 1.40 5.00 16 0.87 4.45 45 Pot experiment (grass) 1.40 23 0.87 25 Spring barley grown on low or high OM soil - OM content differed from past manure applications
  • 20.
  • 21.
    • Small increasein SOC cf continuous arable • Small climate change benefit from soil C sequestration – provided not counteracted by grass to arable conversions • Some decrease in N fertilizer use if utilise legumes in ley phase • Improved soil physical structure – agronomic and environmental benefits • More diverse landscapes and habitats BUT • Decreased arable crop production during rotation • Utilisation of pasture • Large changes in agricultural structure required to make economically and practically feasible Arable Mixed arable/grass
  • 22.
    Thanks for yourattention
  • 23.
  • 24.
    After: - Continuous arable 3year grass ley + N 3 year grass/clover ley Winter wheat Spring barley Johnston & Poulton (2005) SOM influencing crop yield through N supply
  • 25.
    Decline in SOCcontent in a sandy soil (7% clay) over a 100 years (UK) Johnston et al (2009) Advances in Agronomy 101, 1-57 Continuous cereals, inorganic fertilizers 4 course rotation plus manure
  • 27.
    0 1 2 3 4 5 6 7 8 9 10 1840 1860 18801900 1920 1940 1960 1980 2000 2020 Grain,t/haat85%drymatter Cont wheat Unmanured Cont wheat FYM Cont wheat N3PK 1st wheat FYM+N2 (+N3 since 2005) 1st wheat Best NPK Fallowing Liming Herbicides Fungicides Red Rostock Red Club Sq. Master Red Standard Sq. Master Cappelle D. Flanders Apollo HerewardBrimstone 1st Wheat Cont. wheat Modern cultivars FYM Broadbalk wheat yields, varieties and major chang NPK Grain yield of winter-sown wheat: not very sensitive to SOC concentration, despite improved soil structure in FYM treatment (10 month growing season)
  • 28.
    Example of SOMinfluencing crop yield – through soil structure or water availability? Hoosfield spring barley - changing yield trends with changes in variety 1976-79 Julia 1988-91 Triumph 1996-99 Cooper 2004-2007 Optic Johnston et al (2009) Advances in Agronomy 101, 1-57 FYM FYM FYM FYM PK PK PK PK Modern cultivars of spring-sown barley (high yield potential): grain yield is sensitive to SOC concentration only (5-6 month growing season) FYM applied 2001 – 2006 only
  • 29.
    Morrow Plots, Illinois Points:measured Lines: RothC simulation 0 10 20 30 40 50 60 70 80 1860 1880 1900 1920 1940 1960 1980 2000 2020 Year SOC(t/hato15cm) Bluegrass Border Continuous Corn Corn-oats -clover C lost to atmosphere Gollany et al (2011) Agronomy Journal 103, 234-246
  • 30.
    Total SOC Small changesfrom straw return or removal Microbial biomass (and other “active fractions” within total SOC) Changes in response to straw return/removal proportionately much greater Soil physical properties Larger impacts - even when no measureable change in total SOC