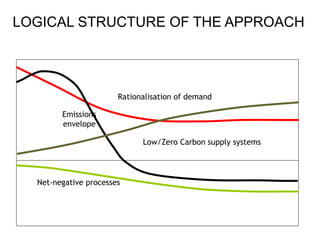
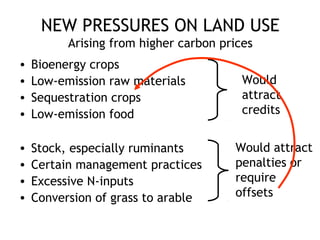
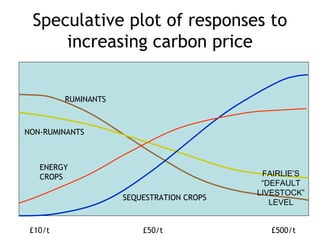
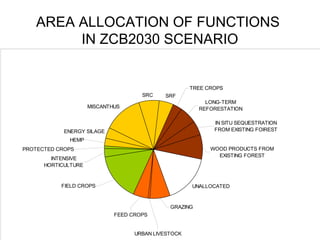
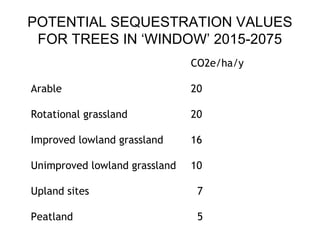
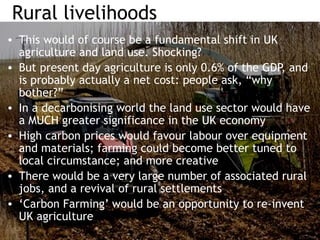
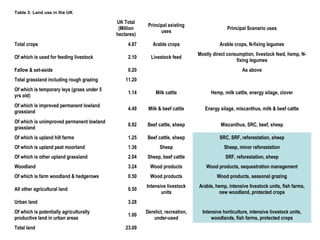
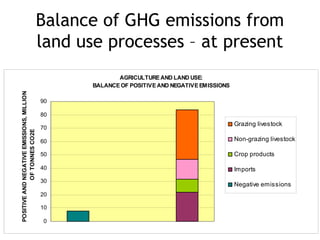
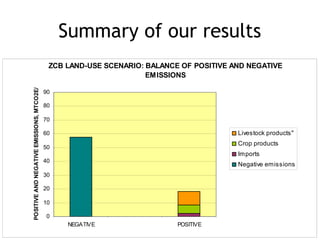
PETER HARPER
CENTRE FOR ALTERNATIVE TECHNOLOGY
FARMING FUTURES, NORTH YORKSHIRE 25 NOVEMBER 2010
TREES AND LIVESTOCK:
CHANGING LAND-USE IN
THIS IS
WHY IT’S
A
SERIOUS
MATTER
NOVEMBER 17, 2010:NOVEMBER 17, 2010:
David Cameron yesterday warned that aDavid Cameron yesterday warned that a
fragmented national and regionalfragmented national and regional
approach to tackling climate change willapproach to tackling climate change will
be unable to sufficiently curb greenhousebe unable to sufficiently curb greenhouse
gas emissions, insisting that a bindinggas emissions, insisting that a binding
global deal remains critical.global deal remains critical.
THE YAWNI NG CHASM
POLI TI CAL REALI SM PHYSI CAL REALI SM
FURI OUS ACTI VI TY
ZCB
THE MOST SIGNIFICANT BRANCH-
POINT IN HUMAN HISTORY?
COMING SOON TO A PLANET NEAR YOU
SUCCESSFUL
MITIGATION
INCREASINGLY
DESPERATE
ADAPTATIONS
+ ‘PEAK OIL’
LOGICAL STRUCTURE OF THE
APPROACH
Rationalisation of demand
Emissions
envelope
Net-negative processes
Low/Zero Carbon supply systems
IT IS AN INVESTMENT, NOT A COST
Tomorrow
£196 million
LOGICAL STRUCTURE OF THE APPROACH
Rationalisation of demand
Emissions
envelope
Net-negative processes
Low/Zero Carbon supply systems
NEW PRESSURES ON LAND USE
Arising from higher carbon prices
• Bioenergy crops
• Low-emission raw materials
• Sequestration crops
• Low-emission food
• Stock, especially ruminants
• Certain management practices
• Excessive N-inputs
• Conversion of grass to arable
Would
attract
credits
Would attract
penalties or
require
offsets
Speculative plot of responses to
increasing carbon price
£10/t £50/t £500/t
RUMINANTS
NON-RUMINANTS
ENERGY
CROPS
SEQUESTRATION CROPS
FAIRLIE’S
“DEFAULT
LIVESTOCK”
LEVEL
‘DEFAULT MEAT
PRODUCTION’
Elferink, E.V., S. Nonhebel and H.C. Moll (2008), J. Cleaner Production 16 (12) 1227-1233.
AGRICULTURAL PRODUCTS: GHG EMISSIONS, LAND REQUIREMENT, OUTPUT.
ADJUSTED FOR NUTRITIONAL VALUE AFTER MAILLOT 2009
0
2000
4000
6000
8000
10000
12000
14000
16000
O
TH
ER
C
RO
PSO
ATS
PE
AS
AN
D
BEANS
FR
U
IT
BE
ET
VE
G
ETABLESBA
RLEY
PO
TATOES
RAPE
PR
O
TECTED
C
ROPS
W
H
EAT
HO
RS
ES
etc
EG
GS
PIG
S
SH
EEP
PO
ULTRY
BE
EF
M
ILK
FOOD PRODUCT GROUPS, IN TWO CLASSES
EMISSIONS,KT,LAND,KHAX4,PRODUCTKT
Nutrionally-adjusted product
Land used
GHG emissions
PROTEIN RATIO
55% LIVESTOCK PRODUCTS
45% CROP PRODUCTS
COMPARISON OF EXISTING AND ZCB2030 SCENARIO EMISSIONS
-30000
-25000
-20000
-15000
-10000
-5000
0
5000
10000
15000
PRODUCTS IN THREE CLASSES, RANKED BY EMISSIONS
GHGEMISSIONS,KTCO2e/year
Scenario emissions
existing emissions
PROTEIN RATIO
34% LIVESTOCK PRODUCTS
66% CROP PRODUCTS
FOOD QUALITY: ‘DOUBLE FOOD PYRAMID’
PROPOSED BY BARILLA CENTER
http://www.barillacfn.com/images/download/positionpaper_barillacfn_double-pyramid.pdf
ENERGY SILAGE
MISCANTHUS
SRC SRF
UNALLOCATED
GRAZING
IN SITU SEQUESTRATION
FROM EXISTING FOIREST
LONG-TERM
REFORESTATION
TREE CROPS
FEED CROPS
URBAN LIVESTOCK
INTENSIVE
HORTICULTURE
PROTECTED CROPS
HEMP
FIELD CROPS
WOOD PRODUCTS FROM
EXISTING FOREST
AREA ALLOCATION OF FUNCTIONS
IN ZCB2030 SCENARIO
ENERGY SILAGE
MISCANTHUS
SRC SRF
UNALLOCATED
GRAZING
IN SITU SEQUESTRATION
FROM EXISTING FOIREST
LONG-TERM
REFORESTATION
TREE CROPS/
AGROFORESTRY
FEED CROPS
URBAN LIVESTOCK
INTENSIVE
HORTICULTURE
PROTECTED CROPS
HEMP
FIELD CROPS
WOOD PRODUCTS FROM
EXISTING FOREST
1235 1513 461 2150 318 20800
UNALLOCATED
LONG-TERM REFORESTATION
IN SITU FROM EXISTING
WOOD PRODUCTS FROM EXISTING
SRF
SRC
MISCANTHUS
HEMP
ENERGY SILAGE
DIRECT CROPS
FEED CROPS
0
500
1000
1500
2000
2500
3000
3500
4000
4500
5000
U
R
B
A
N
O
T
H
E
R
A
R
A
B
LE
A
R
A
B
LE
FO
R
FE
E
D
R
O
TA
T
IO
N
A
L
LO
W
LA
N
D
IM
P
R
O
V
E
D
U
N
IM
P
R
O
V
E
D
H
ILL
O
T
H
E
R
U
P
LA
N
D
P
E
A
T
M
O
O
R
E
X
IS
T
IN
G
W
O
O
D
LA
N
D
O
T
H
E
R
F
A
R
M
LA
N
D
UNALLOCATED
LONG-TERM
REFORESTATION
IN SITU FROM
EXISTING
WOOD PRODUCTS
FROM EXISTING
SRF
SRC
MISCANTHUS
HEMP
ENERGY SILAGE
TREE CROPS
DIRECT CROPS
FEED CROPS
GRAZING
Read, D.J., Freer-Smith, P.H., Morison, J.I.L., Hanley, N., West, C.C.
and Snowdon, P. (eds). (2009) Combating climate change – a role for
UK forests. An assessment of the potential of the UK’s trees and
woodlands to mitigate and adapt to climate change, the synthesis
report, Forestry Commission, The Stationery Office, Edinburgh.
POTENTIAL SEQUESTRATION VALUES
FOR TREES IN ‘WINDOW’ 2015-2075
CO2e/ha/y
Arable 20
Rotational grassland 20
Improved lowland grassland 16
Unimproved lowland grassland 10
Upland sites 7
Peatland 5
Wakelyn’s, Suffolk
SILVOPASTORAL SYSTEMS
• Sycamore trees planted at close spacing in farmSycamore trees planted at close spacing in farm
woodland or clumped arrangements were significantlywoodland or clumped arrangements were significantly
larger in diameter than widely spaced sycamore atlarger in diameter than widely spaced sycamore at
100 and 400 stems/ha.100 and 400 stems/ha.
• The planting of trees in a clumped pattern appears toThe planting of trees in a clumped pattern appears to
combine silvicultural benefits to tree growth withcombine silvicultural benefits to tree growth with
agricultural benefits of maintaining livestockagricultural benefits of maintaining livestock
productionproduction
• Livestock productivity was unaffected by the presenceLivestock productivity was unaffected by the presence
of trees during the six-year establishment phaseof trees during the six-year establishment phase
• Alder in silvopastoral systems in N. Wales fixedAlder in silvopastoral systems in N. Wales fixed
nitrogen at 30kg/ha/ynitrogen at 30kg/ha/y
Rural livelihoods
• This would of course be a fundamental shift in UK
agriculture and land use. Shocking?
• But present day agriculture is only 0.6% of the GDP, and
is probably actually a net cost: people ask, “why
bother?”
• In a decarbonising world the land use sector would have
a MUCH greater significance in the UK economy
• High carbon prices would favour labour over equipment
and materials; farming could become better tuned to
local circumstance; and more creative
• There would be a very large number of associated rural
jobs, and a revival of rural settlements
• ‘Carbon Farming’ would be an opportunity to re-invent
UK agriculture
THE END
THE END
DOWNLOAD THE WHOLE REPORT
FREE FROM
www.zerocarbonbritain.com
ORGANIC?
• Follows calls from Soil Association report for
– A larger organic sector
– Improved practice in the non-organic sector
– More mixed farming
• Switch to biomass crops requires less
fertiliser and pesticides
• Large inputs of organic matter to soils
• Livestock sector shifts from quantity to
quality
• Still provision for about 10% mineral
nitrogen
Biomass
• Biomass crops replace only grazing grassland
– An inefficient but essential process replaces an
inefficient and dispensable process
• Driven largely by carbon prices
• The biomass crops are perennials generating
cellulose, not protein
– Lower disturbance
– Lower fertiliser requirement
– Higher habitat/biodiversity value
• A new paradigm for farming and land use
invites an explosion of new mixed approaches
– Especially with respect to livestock
BIOMASS ENERGY
HOW TO DO IT PROPERLY
• Using crops for energy is not efficient and should be
minimised
• Using them for sequestration is a much better and
indispensable function
• Arable/annual crops should not be used for energy at all,
except for ‘waste materials’
• Biomass energy does however play a significant role in the
scenario
– Some surface transport needs
– Balancing the electricity system
– ‘Grounding’ hydrogen
– Aviation
• We found no way to avoid it, given our chosen principles
Table 3: Land use in the UK
UK Total
(Million
hectares)
Principal existing
uses
Principal Scenario uses
Total crops 4.87 Arable crops Arable crops, N-fixing legumes
Of which is used for feeding livestock 2.10 Livestock feed
Mostly direct consumption, livestock feed, hemp, N-
fixing legumes
Fallow & set-aside 0.20 As above
Total grassland including rough grazing 11.20
Of which is temporary leys (grass under 5
yrs old)
1.14 Milk cattle Hemp, milk cattle, energy silage, clover
Of which is improved permanent lowland
grassland
4.49 Milk & beef cattle Energy silage, miscanthus, milk & beef cattle
Of which is unimproved permanent lowland
grassland
0.92 Beef cattle, sheep Miscanthus, SRC, beef, sheep
Of which is upland hill farms 1.25 Beef cattle, sheep SRC, SRF, reforestation, sheep
Of which is upland peat moorland 1.36 Sheep Sheep, minor reforestation
Of which is other upland grassland 2.04 Sheep, beef cattle SRF, reforestation, sheep
Woodland 3.24 Wood products Wood products, sequestration management
Of which is farm woodland & hedgerows 0.50 Wood products Wood products, seasonal grazing
All other agricultural land 0.50
Intensive livestock
units
Arable, hemp, intensive livestock units, fish farms,
new woodland, protected crops
Urban land 3.28
Of which is potentially agriculturally
productive land in urban areas
1.00
Derelict, recreation,
under-used
Intensive horticulture, intensive livestock units,
woodlands, fish farms, protected crops
Total land 23.09
Balance of GHG emissions from
land use processes – at present
AGRICULTURE AND LAND USE:
BALANCE OF POSITIVE AND NEGATIVEEMISSIONS
0
10
20
30
40
50
60
70
80
90
POSITIVEANDNEGATIVEEMISSIONS,MILLIONS
OFTONNESCO2E
Grazing livestock
Non-grazing livestock
Crop products
Imports
Negative emissions
Summary of our results
ZCB LAND-USE SCENARIO: BALANCE OF POSITIVE AND NEGATIVE
EMISSIONS
0
10
20
30
40
50
60
70
80
90
NEGATIVE POSITIVE
POSITIVEANDNEGATIVEEMISSIONS,MTCO2E/Y
Livestock products"
Crop products
Imports
Negative emissions

Trees and Livestock: Changing Land-use in Zero Carbon Britain - Peter Harper (Centre for Alternative Technology)

  • 1.
    PETER HARPER CENTRE FORALTERNATIVE TECHNOLOGY FARMING FUTURES, NORTH YORKSHIRE 25 NOVEMBER 2010 TREES AND LIVESTOCK: CHANGING LAND-USE IN
  • 2.
  • 3.
    NOVEMBER 17, 2010:NOVEMBER17, 2010: David Cameron yesterday warned that aDavid Cameron yesterday warned that a fragmented national and regionalfragmented national and regional approach to tackling climate change willapproach to tackling climate change will be unable to sufficiently curb greenhousebe unable to sufficiently curb greenhouse gas emissions, insisting that a bindinggas emissions, insisting that a binding global deal remains critical.global deal remains critical.
  • 4.
    THE YAWNI NGCHASM POLI TI CAL REALI SM PHYSI CAL REALI SM FURI OUS ACTI VI TY ZCB
  • 5.
    THE MOST SIGNIFICANTBRANCH- POINT IN HUMAN HISTORY? COMING SOON TO A PLANET NEAR YOU SUCCESSFUL MITIGATION INCREASINGLY DESPERATE ADAPTATIONS + ‘PEAK OIL’
  • 6.
    LOGICAL STRUCTURE OFTHE APPROACH Rationalisation of demand Emissions envelope Net-negative processes Low/Zero Carbon supply systems
  • 7.
    IT IS ANINVESTMENT, NOT A COST
  • 8.
  • 10.
    LOGICAL STRUCTURE OFTHE APPROACH Rationalisation of demand Emissions envelope Net-negative processes Low/Zero Carbon supply systems
  • 11.
    NEW PRESSURES ONLAND USE Arising from higher carbon prices • Bioenergy crops • Low-emission raw materials • Sequestration crops • Low-emission food • Stock, especially ruminants • Certain management practices • Excessive N-inputs • Conversion of grass to arable Would attract credits Would attract penalties or require offsets
  • 12.
    Speculative plot ofresponses to increasing carbon price £10/t £50/t £500/t RUMINANTS NON-RUMINANTS ENERGY CROPS SEQUESTRATION CROPS FAIRLIE’S “DEFAULT LIVESTOCK” LEVEL
  • 13.
    ‘DEFAULT MEAT PRODUCTION’ Elferink, E.V.,S. Nonhebel and H.C. Moll (2008), J. Cleaner Production 16 (12) 1227-1233.
  • 14.
    AGRICULTURAL PRODUCTS: GHGEMISSIONS, LAND REQUIREMENT, OUTPUT. ADJUSTED FOR NUTRITIONAL VALUE AFTER MAILLOT 2009 0 2000 4000 6000 8000 10000 12000 14000 16000 O TH ER C RO PSO ATS PE AS AN D BEANS FR U IT BE ET VE G ETABLESBA RLEY PO TATOES RAPE PR O TECTED C ROPS W H EAT HO RS ES etc EG GS PIG S SH EEP PO ULTRY BE EF M ILK FOOD PRODUCT GROUPS, IN TWO CLASSES EMISSIONS,KT,LAND,KHAX4,PRODUCTKT Nutrionally-adjusted product Land used GHG emissions PROTEIN RATIO 55% LIVESTOCK PRODUCTS 45% CROP PRODUCTS
  • 15.
    COMPARISON OF EXISTINGAND ZCB2030 SCENARIO EMISSIONS -30000 -25000 -20000 -15000 -10000 -5000 0 5000 10000 15000 PRODUCTS IN THREE CLASSES, RANKED BY EMISSIONS GHGEMISSIONS,KTCO2e/year Scenario emissions existing emissions PROTEIN RATIO 34% LIVESTOCK PRODUCTS 66% CROP PRODUCTS
  • 16.
    FOOD QUALITY: ‘DOUBLEFOOD PYRAMID’ PROPOSED BY BARILLA CENTER http://www.barillacfn.com/images/download/positionpaper_barillacfn_double-pyramid.pdf
  • 17.
    ENERGY SILAGE MISCANTHUS SRC SRF UNALLOCATED GRAZING INSITU SEQUESTRATION FROM EXISTING FOIREST LONG-TERM REFORESTATION TREE CROPS FEED CROPS URBAN LIVESTOCK INTENSIVE HORTICULTURE PROTECTED CROPS HEMP FIELD CROPS WOOD PRODUCTS FROM EXISTING FOREST AREA ALLOCATION OF FUNCTIONS IN ZCB2030 SCENARIO
  • 18.
    ENERGY SILAGE MISCANTHUS SRC SRF UNALLOCATED GRAZING INSITU SEQUESTRATION FROM EXISTING FOIREST LONG-TERM REFORESTATION TREE CROPS/ AGROFORESTRY FEED CROPS URBAN LIVESTOCK INTENSIVE HORTICULTURE PROTECTED CROPS HEMP FIELD CROPS WOOD PRODUCTS FROM EXISTING FOREST
  • 19.
    1235 1513 4612150 318 20800 UNALLOCATED LONG-TERM REFORESTATION IN SITU FROM EXISTING WOOD PRODUCTS FROM EXISTING SRF SRC MISCANTHUS HEMP ENERGY SILAGE DIRECT CROPS FEED CROPS 0 500 1000 1500 2000 2500 3000 3500 4000 4500 5000 U R B A N O T H E R A R A B LE A R A B LE FO R FE E D R O TA T IO N A L LO W LA N D IM P R O V E D U N IM P R O V E D H ILL O T H E R U P LA N D P E A T M O O R E X IS T IN G W O O D LA N D O T H E R F A R M LA N D UNALLOCATED LONG-TERM REFORESTATION IN SITU FROM EXISTING WOOD PRODUCTS FROM EXISTING SRF SRC MISCANTHUS HEMP ENERGY SILAGE TREE CROPS DIRECT CROPS FEED CROPS GRAZING
  • 21.
    Read, D.J., Freer-Smith,P.H., Morison, J.I.L., Hanley, N., West, C.C. and Snowdon, P. (eds). (2009) Combating climate change – a role for UK forests. An assessment of the potential of the UK’s trees and woodlands to mitigate and adapt to climate change, the synthesis report, Forestry Commission, The Stationery Office, Edinburgh.
  • 22.
    POTENTIAL SEQUESTRATION VALUES FORTREES IN ‘WINDOW’ 2015-2075 CO2e/ha/y Arable 20 Rotational grassland 20 Improved lowland grassland 16 Unimproved lowland grassland 10 Upland sites 7 Peatland 5
  • 24.
  • 25.
    SILVOPASTORAL SYSTEMS • Sycamoretrees planted at close spacing in farmSycamore trees planted at close spacing in farm woodland or clumped arrangements were significantlywoodland or clumped arrangements were significantly larger in diameter than widely spaced sycamore atlarger in diameter than widely spaced sycamore at 100 and 400 stems/ha.100 and 400 stems/ha. • The planting of trees in a clumped pattern appears toThe planting of trees in a clumped pattern appears to combine silvicultural benefits to tree growth withcombine silvicultural benefits to tree growth with agricultural benefits of maintaining livestockagricultural benefits of maintaining livestock productionproduction • Livestock productivity was unaffected by the presenceLivestock productivity was unaffected by the presence of trees during the six-year establishment phaseof trees during the six-year establishment phase • Alder in silvopastoral systems in N. Wales fixedAlder in silvopastoral systems in N. Wales fixed nitrogen at 30kg/ha/ynitrogen at 30kg/ha/y
  • 26.
    Rural livelihoods • Thiswould of course be a fundamental shift in UK agriculture and land use. Shocking? • But present day agriculture is only 0.6% of the GDP, and is probably actually a net cost: people ask, “why bother?” • In a decarbonising world the land use sector would have a MUCH greater significance in the UK economy • High carbon prices would favour labour over equipment and materials; farming could become better tuned to local circumstance; and more creative • There would be a very large number of associated rural jobs, and a revival of rural settlements • ‘Carbon Farming’ would be an opportunity to re-invent UK agriculture
  • 27.
    THE END THE END DOWNLOADTHE WHOLE REPORT FREE FROM www.zerocarbonbritain.com
  • 28.
    ORGANIC? • Follows callsfrom Soil Association report for – A larger organic sector – Improved practice in the non-organic sector – More mixed farming • Switch to biomass crops requires less fertiliser and pesticides • Large inputs of organic matter to soils • Livestock sector shifts from quantity to quality • Still provision for about 10% mineral nitrogen
  • 29.
    Biomass • Biomass cropsreplace only grazing grassland – An inefficient but essential process replaces an inefficient and dispensable process • Driven largely by carbon prices • The biomass crops are perennials generating cellulose, not protein – Lower disturbance – Lower fertiliser requirement – Higher habitat/biodiversity value • A new paradigm for farming and land use invites an explosion of new mixed approaches – Especially with respect to livestock
  • 30.
    BIOMASS ENERGY HOW TODO IT PROPERLY • Using crops for energy is not efficient and should be minimised • Using them for sequestration is a much better and indispensable function • Arable/annual crops should not be used for energy at all, except for ‘waste materials’ • Biomass energy does however play a significant role in the scenario – Some surface transport needs – Balancing the electricity system – ‘Grounding’ hydrogen – Aviation • We found no way to avoid it, given our chosen principles
  • 31.
    Table 3: Landuse in the UK UK Total (Million hectares) Principal existing uses Principal Scenario uses Total crops 4.87 Arable crops Arable crops, N-fixing legumes Of which is used for feeding livestock 2.10 Livestock feed Mostly direct consumption, livestock feed, hemp, N- fixing legumes Fallow & set-aside 0.20 As above Total grassland including rough grazing 11.20 Of which is temporary leys (grass under 5 yrs old) 1.14 Milk cattle Hemp, milk cattle, energy silage, clover Of which is improved permanent lowland grassland 4.49 Milk & beef cattle Energy silage, miscanthus, milk & beef cattle Of which is unimproved permanent lowland grassland 0.92 Beef cattle, sheep Miscanthus, SRC, beef, sheep Of which is upland hill farms 1.25 Beef cattle, sheep SRC, SRF, reforestation, sheep Of which is upland peat moorland 1.36 Sheep Sheep, minor reforestation Of which is other upland grassland 2.04 Sheep, beef cattle SRF, reforestation, sheep Woodland 3.24 Wood products Wood products, sequestration management Of which is farm woodland & hedgerows 0.50 Wood products Wood products, seasonal grazing All other agricultural land 0.50 Intensive livestock units Arable, hemp, intensive livestock units, fish farms, new woodland, protected crops Urban land 3.28 Of which is potentially agriculturally productive land in urban areas 1.00 Derelict, recreation, under-used Intensive horticulture, intensive livestock units, woodlands, fish farms, protected crops Total land 23.09
  • 32.
    Balance of GHGemissions from land use processes – at present AGRICULTURE AND LAND USE: BALANCE OF POSITIVE AND NEGATIVEEMISSIONS 0 10 20 30 40 50 60 70 80 90 POSITIVEANDNEGATIVEEMISSIONS,MILLIONS OFTONNESCO2E Grazing livestock Non-grazing livestock Crop products Imports Negative emissions
  • 33.
    Summary of ourresults ZCB LAND-USE SCENARIO: BALANCE OF POSITIVE AND NEGATIVE EMISSIONS 0 10 20 30 40 50 60 70 80 90 NEGATIVE POSITIVE POSITIVEANDNEGATIVEEMISSIONS,MTCO2E/Y Livestock products" Crop products Imports Negative emissions

Editor's Notes

  • #2 [Design] Need new logo
  • #4 The size shows historical carbon emissions debt. How can we point a finger at the developing south and demand they decarbonise when we are responsible for the problem, and arent being ambitious ourselves?
  • #10 This very complicated diagram is a Sankey diagram for our energy supply and demand. The thickness of the line indicates the no. of terawatt hours per source (left) to its end use (right). Note that the loses (bottom) are minimal