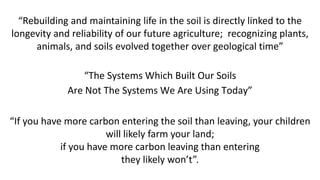
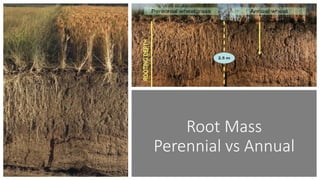
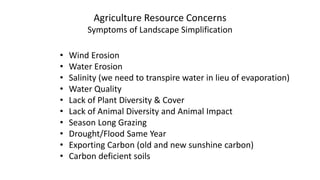
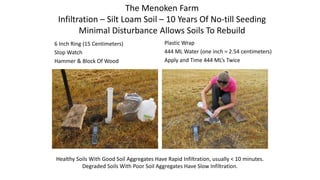
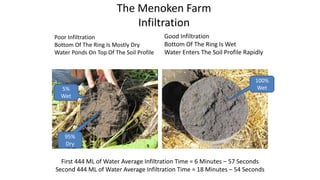
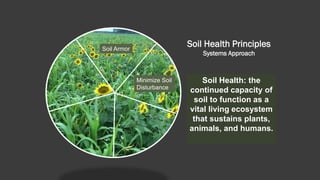
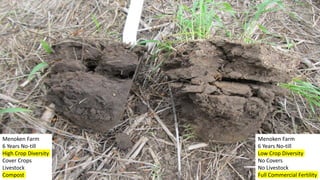
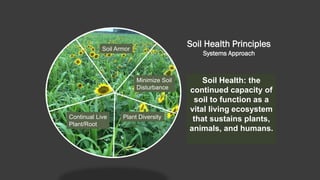
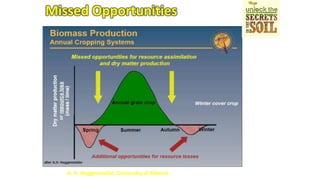
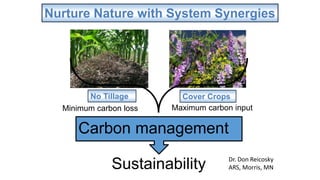
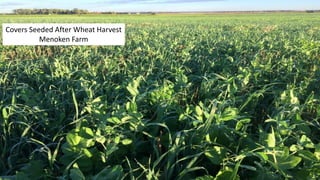
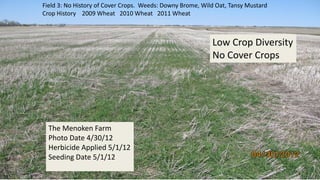
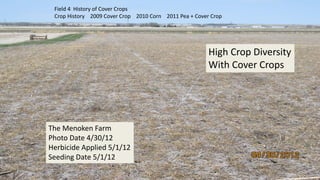
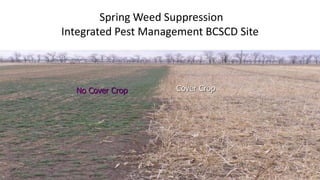
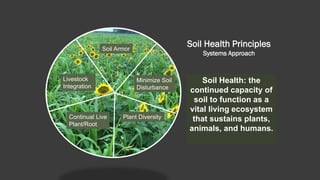
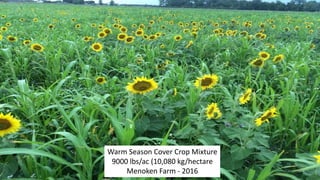
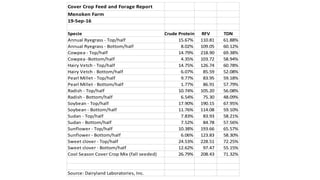
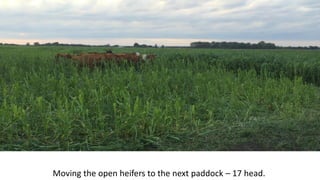
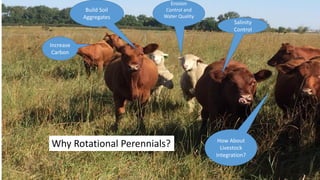
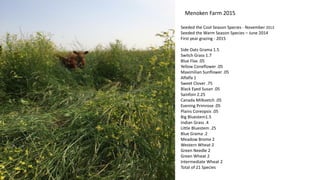
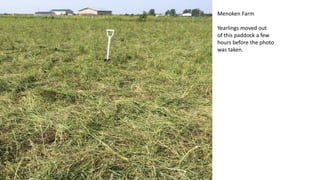
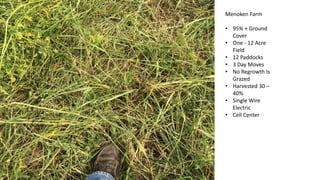
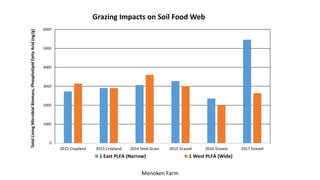
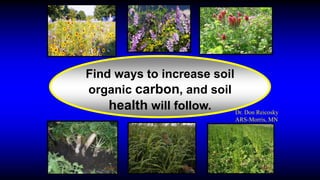
By: Jay Fuhrer | Soil Health Specialist | Bismarck, ND - USA
Natural Resources Conservation Service - USDA
Regenerative Agriculture
as the Farming Solution
“If you have more carbon entering the soil than leaving, your children
will likely farm your land;
if you have more carbon leaving than entering
they likely won’t”.
“Rebuilding and maintaining life in the soil is directly linked to the
longevity and reliability of our future agriculture; recognizing plants,
animals, and soils evolved together over geological time”
“The Systems Which Built Our Soils
Are Not The Systems We Are Using Today”
Root Mass
Perennial vs Annual
Agriculture Resource Concerns
Symptoms of Landscape Simplification
• Wind Erosion
• Water Erosion
• Salinity (we need to transpire water in lieu of evaporation)
• Water Quality
• Lack of Plant Diversity & Cover
• Lack of Animal Diversity and Animal Impact
• Season Long Grazing
• Drought/Flood Same Year
• Exporting Carbon (old and new sunshine carbon)
• Carbon deficient soils
Soil
What Does A Soil
Consist Of?
• 25% Air
• 25% Water
• 45% Mineral
• 5% SOM
25% Air
25% Water
5%
SOM
45% Mineral
Sand
Silt
Clay
Infiltration
The Menoken Farm
Infiltration – Silt Loam Soil – 10 Years Of No-till Seeding
Minimal Disturbance Allows Soils To Rebuild
6 Inch Ring (15 Centimeters)
Stop Watch
Hammer & Block Of Wood
Plastic Wrap
444 ML Water (one inch = 2.54 centimeters)
Apply and Time 444 ML’s Twice
Healthy Soils With Good Soil Aggregates Have Rapid Infiltration, usually < 10 minutes.
Degraded Soils With Poor Soil Aggregates Have Slow Infiltration.
The Menoken Farm
Infiltration
Poor Infiltration
Bottom Of The Ring Is Mostly Dry
Water Ponds On Top Of The Soil Profile
Good Infiltration
Bottom Of The Ring Is Wet
Water Enters The Soil Profile Rapidly
First 444 ML of Water Average Infiltration Time = 6 Minutes – 57 Seconds
Second 444 ML of Water Average Infiltration Time = 18 Minutes – 54 Seconds
5%
Wet
95%
Dry
100%
Wet
Soil Organic Matter and Available Water Capacity
Inches of Water/One Foot of Soil
Percent SOM Sand Silt Loam Silty Clay Loam
1 1.0 1.9 1.4
2 1.4 2.4 1.8
3 1.7 2.9 2.2
4 2.1 3.5 2.6
5 2.5 4.0 3.0
Berman Hudson
Journal Soil and Water Conservation 49(2) 189-194
March – April 1994
Summarized by:
Dr. Mark Liebig, ARS, Mandan, ND
Hal Weiser, Soil Scientist, NRCS, Bismarck, ND
Air
What Does Dry Air
Consist Of?
• 78% Nitrogen N2
• 21% Oxygen O2
• 1% *
• Argon Ar
• Carbon Dioxide CO2
• Neon Ne
• Helium He
• Methane CH4
• Krypton Kr
• Nitrogen Oxide N2O
• Hydrogen H2
• Xenon Xe
• Ozone O3
*
21% Oxygen
78% Nitrogen
Source: Scifun.Chem.Wisc.edu
Carbon/Nitrogen Ratio
What Does Soil Organic Matter Consist Of:
• The Living – Microorganisms
• The Dead – Fresh Residues
• The Very Dead - Humus
1 % Soil Organic Matter:
10,000 units carbon
1,000 units organic nitrogen
100 units phosphorous
Nutrient Cycling
Carbon/Nitrogen Ratios
• Soil Microorganisms, Bacteria * 5/1
• SOM, Mollisol Ap horizon * 11/1
• Rotted barnyard manure * 20/1
• Mature Alfalfa Hay * 25/1
• Protozoa ** 30/1
• Corn Stover * 57/1
• Wheat Straw * 80/1
• Newspaper * 120/1
• Deciduous Wood ** 300/1
Source:
*The Nature and Properties of Soils, fourteenth Edition.
DR. Nyle C. Brady and DR. Ray R. Weil
** DR. Elaine R. Ingham, Soil Food Web
Material C:N Ratio
rye straw 82:1
wheat straw 80:1
oat straw 70:1
corn stover 57:1
rye cover crop (anthesis) 37:1
pea straw 29:1
rye cover crop (vegetative) 26:1
mature alfalfa hay 25:1
Ideal Microbial Diet 24:1
rotted barnyard manure 20:1
legume hay 17:1
beef manure 17:1
young alfalfa hay 13:1
hairy vetch cover crop 11:1
soil microbes (average) 8:1
Carbon to Nitrogen Ratios in
Cropping Systems
USDA/NRCS Fact Sheet
Carbon Cycle
Nature and Properties of Soils, Fourteenth Edition, Chapter 12, Global Carbon
Soil Biology – Plant Interaction
Soil Aggregates last for
Days-Weeks-Months
Menoken Farm
Exporting Carbon & Nutrients
Menoken Farm
Exporting Carbon & Nutrients
Alamosa, Colorado
Agriculture is a carbon exporter from the landscape in the
form of our food. About one third of the carbon fixed in
photosynthesis is exported in the grain yield used for our
consumption.
1/3C
Our
Food
1/3C
Soil
Food
1/3C
C
Dr. Don Reicosky
ARS-Morris, MN
0
500
1000
1500
2000
2500
3000
Root Mass C Residue C Grain/Cattle C
Total Carbon Produced and Approximate Amount
Retained in the Soil
Total Carbon Root Mass C Residue C Grain/Cattle C
1/3
Corn Crop
7500 kg/ha Carbon
• Root Mass – 2500 kg/ha
• Residue – 2500 kg/ha
• Grain/Cattle – 2500 kg/ha
The Nature and Properties
Of Soils, Fourteenth Edition.
1/3 1/3
Soil Food Web
The Soil Food Web
Working Toward A Higher Quality No-till
The “Below Ground” Players…
• Bacteria-
Decomposer of simple
carbon chains (low carbon
residue).
Little bag of fertilizer.
One bacterium can
produce 5 billion offspring in
12 hours (food available).
Feed on root exudates.
Soil Biology Primer
The Soil Food Web
Working Toward A Higher Quality No-till
The “Below Ground” Players…
• Fungi-
Saprophytic-primary
decomposer of complex
carbon chains (high carbon
chains).
Mycorrhizal-transports
nutrients.
Little bag of fertilizer.
Forms the soils glue
(glomalin) along with the
plant roots exudates.
Soil Biology Primer
The Soil Food Web
Working Toward A Higher Quality No-till
The “Below Ground” Players…
• Protozoa-
Mineralize nutrients by
eating the little guys (fungi
and bacteria).
Consumes an average of
10,000 bacteria per day.
Amoebae – large
Ciliates – medium
Flagellates - small
Soil Biology Primer
The Soil Food Web
Working Toward A Higher Quality No-till
The “Below Ground” Players…
• Nematodes-
Mineralize nutrients by eating
the little guys (fungi and
bacteria).
Taxi for the bacteria & fungi.
Locate food by temperature.
Types: Herbivore,
Bacterivores, Fungivores, and
Predator.
Large in size, compacted soil
restricts their travel.
Soil Biology Primer
The Soil Food Web
Working Toward A Higher Quality No-till
The “Below Ground” Players…
• Actinomycetes-
Source of antibiotics:
tetracycline, neomycin,
streptomycin.
Controls bacteria in the soil
and in humans.
Convert dinitrogen gas to
ammonia.
Decompose SOM.
Cure compost.
Soil Biology Primer
What Do They Weigh?
• Bacteria 2,000 - 2,500 Lbs/Ac
2,200 - 2800 Kilograms/Hectare
• Fungi 1,000 - 15,000 Lbs/Ac
1,200 – 17,000 Kilograms/Hectare
• Protozoa 20 - 300 Lbs/Ac
• Nematodes 10 - 300 Lbs/Ac
13 – 340 Kilograms/Hectare
• Microbes in Humans 3 lbs/Person
Source:
• The Nature and Properties of Soils
Brady and Weil, Fourteenth Edition.
Soil Biology Primer.
National Geographic, Nathan Wolfe, January 2013.
North Dakota
(5) Soil Monitoring Case Studies
0
1
2
3
4
5
6
7
8
SOM
Cropland 1 East
Cropland 1 West
(animal impact)
Native Rangeland
%
Ward Laboratories, Inc
Farm #1
North Dakota
Huge Carbon Sink
0
1000
2000
3000
4000
5000
6000
Total PLFA Total Bacteria
Cropland 1 East
Cropland 1 West
(animal impact)
Native Rangeland
Ng/g
Ward Laboratories, Inc
Farm #1
North Dakota
Below Ground Diversity
0
100
200
300
400
500
600
700
800
Total Fungi Total Protozoa
Cropland 1 East
Cropland 1 West
(Animal Impact)
Native Rangeland
Ng/g
Ward Laboratories, Inc
Farm #1
North Dakota
Below Ground Diversity
Farm #2
North Dakota
Native Rangeland
HaylandCorn Silage
Oat/Pea with Covers
Landuse PLFA
NG/Gram
Organic C
PPM
Total N Inorganic N Organic N
Native
Rangeland
1916 291 63 6 57
Hayland
Brome/Alf
1125 242 64 9 56
Oat/Pea
With Covers
3145 269 63 9 54
Corn Silage 1206 238 59 10 49
Farm #2 – North Dakota
PLFA and Haney Results – Ward Labs
0
1000
2000
3000
4000
5000
6000
7000
8000
9000
PLFA Mycorrhizal Fungi Saprophytic Fungi Protozoa
A Tale of Three Fields
Farm #3 Menoken Farm Farm #4
420 82 0
ng/g
143 40 0876 295 39
Phospholipid Fatty Acid (PLFA)
Ward Lab
Farm #3: Hayland field
with no exporting. All hay
produced is fed on the field.
Menoken Farm: A field using
all 4 crop types and cover crops
with livestock integration.
Farm #4: Heavy use of fungicides
every third year. Lighter use on
off years.
Farm #5
Biological Soil Tests - PLFA
Field 1
Corn - Year One
Season Long Cover Crop - Year Two
Field 2
Season Long Cover Crop - Year One
Season Long Cover Crop - Year Two
• Total Biology – 1774 ng/g soil
• Bacteria – 1473 ng/g soil
• Actinomycetes – 123 ng/g soil
• Fungi – 147 ng/g soil
• Ratio Bacteria:Fungi – 10.0
• Mycorrhiza – 37 ng/g soil
• Total Biology – 3312 ng/g soil
• Bacteria – 2510 ng/g soil
• Actinomycetes – 249 ng/g soil
• Fungi – 513 ng/g soil
• Ratio Bacteria:Fungi – 4.9
• Mycorrhiza – 251 ng/g soil
Energy
The Menoken Farm
Sunflower and 10 Broadleaf Covers
Cropping System of the Future?
10 Covers:
Buckwheat – 1.0 lbs
Flax – 0.75 lbs
Cowpea – 2.5 lbs
Soybean – 3.75 lbs
Turnip - 0.25 lbs
Radish – 0.25 lbs
Pea – 3.75 lbs
Phacelia – 0.25 lbs
Canola – 0.25 lbs
Subclover – 0.25 lbs
Total 13 lbs/ac
Fertilizer
*
Applied Per Acre
Actual Pounds
Diesel Fuel EQ
Gal/Lb N
Diesel Fuel EQ
Gal/Ac
Urea 90 0.129 11.6 (43.8 Liters)
Phosphorous P205 40.5 0.042 2.2 (8.3 Liters)
Insecticide
**
Applied Per Acre
Pounds AI
Diesel Fuel EQ
Gal/Lb Insect.
Diesel Fuel EQ
Gal/Ac
Warrior 0.01125 0.881 0.01 (0.04 Liters)
Fungicide
***
Applied Per Acre
Pounds AI
Diesel Fuel EQ
Gal/Lb Fung.
Diesel Fuel EQ
Gal/ac
Headline – 2 Aps 0.1463 2.172 0.6 (2.3 Liters)
Total Diesel Fuel EQ Gal Per Acre = 14.4 (54.4 Liters)
Cover Crop Energy Conservation – 1800 Lb Yield Goal
• * Energy Efficiency in Corn Nitrogen Fertilization, 2010, John Sawyer, Depart of Agronomy, Iowa State U.
• ** T.O. West and G.Marland; Agriculture, Ecosystems and Environment 91(2002): 217-232
• *** E. Audsley, et al. 2009, Cranfield University, Bedford, England. Estimation of the Greenhouse Gas
Emissions from Agricultural Manufacture and Use
Soil Health Principles
A Systems Approach – the Foundation
Soil Health Principles
Systems Approach
Soil Health: the
continued capacity of
soil to function as a
vital living ecosystem
that sustains plants,
animals, and humans.
Soil Armor
No-Till Field
Cont. Corn Silage
No Armor!
Corn Planting into
Multi Specie Cover
Menoken Farm
Fall Seeded Cover Crop.
Passive Armor and
Active Armor.
Both are food sources.
Menoken Farm
Soil Health Principles
Systems Approach
Soil Health: the
continued capacity of
soil to function as a
vital living ecosystem
that sustains plants,
animals, and humans.
Soil Armor
Minimize Soil
Disturbance
Horizontal
Compaction Layers.
First Year No-till.
North Dakota
June 2015
The trend in agricultural conservation has been
toward less tillage, but……..
Dust Bowl Era Present
Soil Health Principles
Systems Approach
Soil Health: the
continued capacity of
soil to function as a
vital living ecosystem
that sustains plants,
animals, and humans.
Soil Armor
Minimize Soil
Disturbance
Plant Diversity
Crop Diversity
“The type and diversity of organic residues added to a soil can influence the type and diversity
of organisms that make up the soil community. “ The Nature and Properties of Soils, 14th
Edition; Chapter 12.5
Menoken Farm
6 Years No-till
High Crop Diversity
Cover Crops
Livestock
Compost
Menoken Farm
6 Years No-till
Low Crop Diversity
No Covers
No Livestock
Full Commercial Fertility
Soil Health Principles
Systems Approach
Soil Health: the
continued capacity of
soil to function as a
vital living ecosystem
that sustains plants,
animals, and humans.
Soil Armor
Minimize Soil
Disturbance
Plant DiversityContinual Live
Plant/Root
A. H. Heggenstaller, University of Alberta
Missed Opportunities
Covers – Annuals
Nurture Nature with System Synergies
No Tillage Cover Crops
Sustainability
Carbon management
Minimum carbon loss Maximum carbon input
Dr. Don Reicosky
ARS, Morris, MN
Covers Seeded After Wheat Harvest
Menoken Farm
Field 3: No History of Cover Crops. Weeds: Downy Brome, Wild Oat, Tansy Mustard
Crop History 2009 Wheat 2010 Wheat 2011 Wheat
The Menoken Farm
Photo Date 4/30/12
Herbicide Applied 5/1/12
Seeding Date 5/1/12
Low Crop Diversity
No Cover Crops
Field 4 History of Cover Crops
Crop History 2009 Cover Crop 2010 Corn 2011 Pea + Cover Crop
The Menoken Farm
Photo Date 4/30/12
Herbicide Applied 5/1/12
Seeding Date 5/1/12
High Crop Diversity
With Cover Crops
Spring Weed Suppression
Integrated Pest Management BCSCD Site
Cover CropNo Cover Crop
Covers – Biennials
Biennial Cover Crop Options
Interseeding During the Growing Season (Gaining)
Flying on During the Growing Season (Least Common)
Drilling After Harvest (Most Common)
North Dakota, USA
Cereal Rye
Late Fall Seeded
Small Growth Before Freeze Up
Photo: February 2017
Cereal Rye
Early Spring Growth
Photo: April 19, 2017
North Dakota, USA
Planting Green into Cereal Rye
Soybeans
May 25, 2017
North Dakota, USA
Planting Green with Biennials in North Dakota
• Winter Hardy
• Controls Erosion
• Saline Tolerant
• Water Quality
• Wildlife Habitat
• Early Spring Grazing
• Adds Crop Diversity
• Adds Carbon
Sets the Stage for Livestock Integration
Video - Using Biennials for Planting Green, North Dakota. Photo: May 25, 2017
Cereal Rye Termination
Early in Dry Years
Later in Wet Years
Planting Green
Soybeans Emerging
Spring
North Dakota, USA
Soil Health Principles
Systems Approach
Soil Health: the
continued capacity of
soil to function as a
vital living ecosystem
that sustains plants,
animals, and humans.
Soil Armor
Minimize Soil
Disturbance
Plant DiversityContinual Live
Plant/Root
Livestock
Integration
Warm Season Cover Crop Mixture
9000 lbs/ac (10,080 kg/hectare
Menoken Farm - 2016
Cover Crop Feed and Forage Report
Menoken Farm
19-Sep-16
Specie Crude Protein RFV TDN
Annual Ryegrass - Top/half 15.67% 110.81 61.88%
Annual Ryegrass - Bottom/half 8.02% 109.05 60.12%
Cowpea - Top/half 14.79% 218.90 69.38%
Cowpea -Bottom/half 4.35% 103.72 58.94%
Hairy Vetch - Top/half 14.75% 126.74 60.78%
Hairy Vetch - Bottom/half 6.07% 85.59 52.08%
Pearl Millet - Top/half 9.77% 83.95 59.18%
Pearl Millet - Bottom/half 1.77% 86.91 57.79%
Radish - Top/half 10.74% 105.20 56.08%
Radish - Bottom/half 6.54% 75.30 48.09%
Soybean - Top/half 17.90% 190.15 67.95%
Soybean - Bottom/half 11.76% 114.08 59.10%
Sudan - Top/half 7.83% 83.93 58.21%
Sudan - Bottom/half 7.52% 84.78 57.56%
Sunflower - Top/half 10.38% 193.66 65.57%
Sunflower - Bottom/half 6.06% 123.83 58.30%
Sweet clover - Top/half 24.53% 228.51 72.25%
Sweet clover - Bottom/half 12.62% 97.47 55.15%
Cool Season Cover Crop Mix (fall seeded) 26.79% 208.43 71.32%
Source: Dairyland Laboratories, Inc.
Moving the open heifers to the next paddock – 17 head.
Armor After Grazing
Menoken Farm - 2016
Menoken Farm
Cool Season Cover Crop Mix - Crop Rolling (Video)
Soil Monitoring 10/22/2015
Ungrazed Cover Crop
PLFA 2008 NG/G
Solvita 45 ppm C
Total Organic Carbon 152 ppm C
Soil Monitoring 10/22/2015
Grazed Cover Crop
PLFA 3249 NG/G
Solvita 50 ppm C
Total Organic Carbon 172 ppm C
The Menoken Farm
Covers - Rotational Perennials
Salinity
Control
Erosion
Control and
Water Quality
Build Soil
Aggregates
Why Rotational Perennials? How About
Livestock
Integration?
Increase
Carbon
Seeded the Cool Season Species - November 2013
Seeded the Warm Season Species – June 2014
First year grazing - 2015
Side Oats Grama 1.5
Switch Grass 1.7
Blue Flax .05
Yellow Coneflower .05
Maximilian Sunflower .05
Alfalfa 1
Sweet Clover .75
Black Eyed Susan .05
Sainfoin 2.25
Canada Milkvetch .05
Evening Primrose .05
Plains Coreopsis .05
Big Bluestem1.5
Indian Grass .4
Little Bluestem .25
Blue Grama .2
Meadow Brome 2
Western Wheat 2
Green Needle 2
Green Wheat 2
Intermediate Wheat 2
Total of 21 Species
Menoken Farm 2015
Menoken Farm
Yearlings moved out
of this paddock a few
hours before the photo
was taken.
Menoken Farm
• 95% + Ground
Cover
• One - 12 Acre
Field
• 12 Paddocks
• 3 Day Moves
• No Regrowth Is
Grazed
• Harvested 30 –
40%
• Single Wire
Electric
• Cell Center
Specie Crude Protein % RFV TDN %
Alfalfa – Top 24.4 264 75.1
Alfalfa – Bottom 16.5 140 61.6
Meadow Brome – Top 12.7 100 64.8
Meadow Brome - Bottom 9.4 85 61.3
Intermediate – Top 15.8 106 70.7
Intermediate – Bottom 10.6 90 64.5
Ward Laboratories
6/17/16
Menoken Farm
21 Specie Mixture
Grasses, Legumes, and Forbs
Starting Period 5/25/16
Ending Period 6/30/16
Total Grazing Period 37 Days
Starting Weight Per Heifer 632 lbs (287 Kg)
Ending Weight Per Heifer 734 lbs (334 Kg)
Total Gain Per Heifer 734 lbs – 632 lbs =
Daily Gain Per Heifer 102 lbs/37 Days =
102 lbs (46 Kg)
2.75 lbs Per Day Gain (1.25 Kg)
Gain Per Herd 17 head x 102 lbs = 1734 Total lbs (788 Kg)
Gain Per Acre 1734 lbs/12 acres = 145 lbs Per Acre (163 Kg/Hectare)
Menoken Farm
Herd Size 17 Open Heifers – Field 1 – 1st Rotation
Starting Period 8/18/16
Ending Period 8/28/16
Total Grazing Period 11 Days
Starting Weight Per Heifer 798 lbs (363 Kg)
Ending Weight Per Heifer 835 lbs (380 Kg)
Total Gain Per Heifer 798 lbs – 835 lbs =
Daily Gain Per Heifer 37 lbs/11 Days =
37 lbs (17 Kg)
3.4 lbs Per Day Gain (1.5 Kg)
Gain Per Herd 17 head x 37lbs = 629 Total lbs (286 Kg)
Gain Per Acre 629 lbs/12 acres = 52 lbs Per Acre (58 Kg/Hectare)
Menoken Farm
Herd Size 17 Open Heifers – Field 1 – 2nd Rotation
Menoken Farm
Soil Monitoring – 5 Years
Field 1 East
Year pH SOM
10/12 5.8 2.8
12/17 6.8 3.2
Base Saturation
2013 Cropland
2014 Seed to Grass
2015 Graze
2016 Graze
2017 Graze
H 0-5%
K 1-7%
Ca 65-75%
Mg 15-20%
Na 0-5%
H K Ca Mg Na
36 4 45 15 0
0 8 63 28 1
0
1000
2000
3000
4000
5000
6000
2012 Cropland 2013 Cropland 2014 Seed Grass 2015 Grazed 2016 Grazed 2017 Grazed
TotalLivingMicrobialBiomass,PhospholipidFattyAcid(ng/g)
Grazing Impacts on Soil Food Web
1 East PLFA (Narrow) 1 West PLFA (Wide)
Menoken Farm
Find ways to increase soil
organic carbon, and soil
health will follow. Dr. Don Reicosky
ARS-Morris, MN
Self Education
• The Nature and Properties of Soils –
14th Edition : by Brady and Weil
• Journals of Lewis and Clark
• Buffalo Bird Women’s Garden : by
Gilbert Wilson
• The One Straw Revolution: by
Masanobu Fukuoka
• Managing Cover Crops Profitably 3rd
Edition
• A Sand County Almanac: by Aldo
Leopold
• Soil Biology Primer: by Elaine Ingham
• Life in the Soil: by James Nardi
• An Agricultural Testament: by Sir
Albert Howard
• Dirt – The Erosion of Civilizations: by
David Montgomery
www.menokenfarm.com
Click on the Learn tab.
• Early Settlement of North Dakota: by
Clement Lounsberry
• 1491: by Charles Mann
Contact Information:
Jay Fuhrer
Soil Health Specialist
Natural Resources Conservation Service
Bismarck, ND
Mailing address:
ND State Office
220 East Rosser Avenue
PO Box 1458
Bismarck, North Dakota USA
58502-1458
Email address:
Jay.Fuhrer@nd.usda.gov
Telephone:
1-701-530-2011 (O)
1-701-426-8611 (C)
Websites:
NRCS/USDA
https://www.nrcs.usda.gov/wps/portal/nrcs/site/nd/home/
Menoken Farm
http://menokenfarm.com/
USDA IS AN EQUAL OPPORTUNITY PROVIDER, EMPLOYER, and LENDER

Regenerative Agriculture as a Farming Solution

  • 1.
    By: Jay Fuhrer| Soil Health Specialist | Bismarck, ND - USA Natural Resources Conservation Service - USDA Regenerative Agriculture as the Farming Solution
  • 2.
    “If you havemore carbon entering the soil than leaving, your children will likely farm your land; if you have more carbon leaving than entering they likely won’t”. “Rebuilding and maintaining life in the soil is directly linked to the longevity and reliability of our future agriculture; recognizing plants, animals, and soils evolved together over geological time” “The Systems Which Built Our Soils Are Not The Systems We Are Using Today”
  • 3.
  • 4.
    Agriculture Resource Concerns Symptomsof Landscape Simplification • Wind Erosion • Water Erosion • Salinity (we need to transpire water in lieu of evaporation) • Water Quality • Lack of Plant Diversity & Cover • Lack of Animal Diversity and Animal Impact • Season Long Grazing • Drought/Flood Same Year • Exporting Carbon (old and new sunshine carbon) • Carbon deficient soils
  • 5.
  • 6.
    What Does ASoil Consist Of? • 25% Air • 25% Water • 45% Mineral • 5% SOM 25% Air 25% Water 5% SOM 45% Mineral Sand Silt Clay
  • 7.
  • 8.
    The Menoken Farm Infiltration– Silt Loam Soil – 10 Years Of No-till Seeding Minimal Disturbance Allows Soils To Rebuild 6 Inch Ring (15 Centimeters) Stop Watch Hammer & Block Of Wood Plastic Wrap 444 ML Water (one inch = 2.54 centimeters) Apply and Time 444 ML’s Twice Healthy Soils With Good Soil Aggregates Have Rapid Infiltration, usually < 10 minutes. Degraded Soils With Poor Soil Aggregates Have Slow Infiltration.
  • 9.
    The Menoken Farm Infiltration PoorInfiltration Bottom Of The Ring Is Mostly Dry Water Ponds On Top Of The Soil Profile Good Infiltration Bottom Of The Ring Is Wet Water Enters The Soil Profile Rapidly First 444 ML of Water Average Infiltration Time = 6 Minutes – 57 Seconds Second 444 ML of Water Average Infiltration Time = 18 Minutes – 54 Seconds 5% Wet 95% Dry 100% Wet
  • 10.
    Soil Organic Matterand Available Water Capacity Inches of Water/One Foot of Soil Percent SOM Sand Silt Loam Silty Clay Loam 1 1.0 1.9 1.4 2 1.4 2.4 1.8 3 1.7 2.9 2.2 4 2.1 3.5 2.6 5 2.5 4.0 3.0 Berman Hudson Journal Soil and Water Conservation 49(2) 189-194 March – April 1994 Summarized by: Dr. Mark Liebig, ARS, Mandan, ND Hal Weiser, Soil Scientist, NRCS, Bismarck, ND
  • 11.
  • 12.
    What Does DryAir Consist Of? • 78% Nitrogen N2 • 21% Oxygen O2 • 1% * • Argon Ar • Carbon Dioxide CO2 • Neon Ne • Helium He • Methane CH4 • Krypton Kr • Nitrogen Oxide N2O • Hydrogen H2 • Xenon Xe • Ozone O3 * 21% Oxygen 78% Nitrogen Source: Scifun.Chem.Wisc.edu
  • 13.
  • 14.
    What Does SoilOrganic Matter Consist Of: • The Living – Microorganisms • The Dead – Fresh Residues • The Very Dead - Humus 1 % Soil Organic Matter: 10,000 units carbon 1,000 units organic nitrogen 100 units phosphorous
  • 15.
    Nutrient Cycling Carbon/Nitrogen Ratios •Soil Microorganisms, Bacteria * 5/1 • SOM, Mollisol Ap horizon * 11/1 • Rotted barnyard manure * 20/1 • Mature Alfalfa Hay * 25/1 • Protozoa ** 30/1 • Corn Stover * 57/1 • Wheat Straw * 80/1 • Newspaper * 120/1 • Deciduous Wood ** 300/1 Source: *The Nature and Properties of Soils, fourteenth Edition. DR. Nyle C. Brady and DR. Ray R. Weil ** DR. Elaine R. Ingham, Soil Food Web
  • 16.
    Material C:N Ratio ryestraw 82:1 wheat straw 80:1 oat straw 70:1 corn stover 57:1 rye cover crop (anthesis) 37:1 pea straw 29:1 rye cover crop (vegetative) 26:1 mature alfalfa hay 25:1 Ideal Microbial Diet 24:1 rotted barnyard manure 20:1 legume hay 17:1 beef manure 17:1 young alfalfa hay 13:1 hairy vetch cover crop 11:1 soil microbes (average) 8:1 Carbon to Nitrogen Ratios in Cropping Systems USDA/NRCS Fact Sheet
  • 17.
  • 18.
    Nature and Propertiesof Soils, Fourteenth Edition, Chapter 12, Global Carbon
  • 19.
    Soil Biology –Plant Interaction Soil Aggregates last for Days-Weeks-Months Menoken Farm
  • 20.
    Exporting Carbon &Nutrients Menoken Farm
  • 21.
    Exporting Carbon &Nutrients Alamosa, Colorado
  • 22.
    Agriculture is acarbon exporter from the landscape in the form of our food. About one third of the carbon fixed in photosynthesis is exported in the grain yield used for our consumption. 1/3C Our Food 1/3C Soil Food 1/3C C Dr. Don Reicosky ARS-Morris, MN
  • 23.
    0 500 1000 1500 2000 2500 3000 Root Mass CResidue C Grain/Cattle C Total Carbon Produced and Approximate Amount Retained in the Soil Total Carbon Root Mass C Residue C Grain/Cattle C 1/3 Corn Crop 7500 kg/ha Carbon • Root Mass – 2500 kg/ha • Residue – 2500 kg/ha • Grain/Cattle – 2500 kg/ha The Nature and Properties Of Soils, Fourteenth Edition. 1/3 1/3
  • 24.
  • 25.
    The Soil FoodWeb Working Toward A Higher Quality No-till The “Below Ground” Players… • Bacteria- Decomposer of simple carbon chains (low carbon residue). Little bag of fertilizer. One bacterium can produce 5 billion offspring in 12 hours (food available). Feed on root exudates. Soil Biology Primer
  • 26.
    The Soil FoodWeb Working Toward A Higher Quality No-till The “Below Ground” Players… • Fungi- Saprophytic-primary decomposer of complex carbon chains (high carbon chains). Mycorrhizal-transports nutrients. Little bag of fertilizer. Forms the soils glue (glomalin) along with the plant roots exudates. Soil Biology Primer
  • 27.
    The Soil FoodWeb Working Toward A Higher Quality No-till The “Below Ground” Players… • Protozoa- Mineralize nutrients by eating the little guys (fungi and bacteria). Consumes an average of 10,000 bacteria per day. Amoebae – large Ciliates – medium Flagellates - small Soil Biology Primer
  • 28.
    The Soil FoodWeb Working Toward A Higher Quality No-till The “Below Ground” Players… • Nematodes- Mineralize nutrients by eating the little guys (fungi and bacteria). Taxi for the bacteria & fungi. Locate food by temperature. Types: Herbivore, Bacterivores, Fungivores, and Predator. Large in size, compacted soil restricts their travel. Soil Biology Primer
  • 29.
    The Soil FoodWeb Working Toward A Higher Quality No-till The “Below Ground” Players… • Actinomycetes- Source of antibiotics: tetracycline, neomycin, streptomycin. Controls bacteria in the soil and in humans. Convert dinitrogen gas to ammonia. Decompose SOM. Cure compost. Soil Biology Primer
  • 30.
    What Do TheyWeigh? • Bacteria 2,000 - 2,500 Lbs/Ac 2,200 - 2800 Kilograms/Hectare • Fungi 1,000 - 15,000 Lbs/Ac 1,200 – 17,000 Kilograms/Hectare • Protozoa 20 - 300 Lbs/Ac • Nematodes 10 - 300 Lbs/Ac 13 – 340 Kilograms/Hectare • Microbes in Humans 3 lbs/Person Source: • The Nature and Properties of Soils Brady and Weil, Fourteenth Edition. Soil Biology Primer. National Geographic, Nathan Wolfe, January 2013.
  • 31.
    North Dakota (5) SoilMonitoring Case Studies
  • 32.
    0 1 2 3 4 5 6 7 8 SOM Cropland 1 East Cropland1 West (animal impact) Native Rangeland % Ward Laboratories, Inc Farm #1 North Dakota Huge Carbon Sink
  • 33.
    0 1000 2000 3000 4000 5000 6000 Total PLFA TotalBacteria Cropland 1 East Cropland 1 West (animal impact) Native Rangeland Ng/g Ward Laboratories, Inc Farm #1 North Dakota Below Ground Diversity
  • 34.
    0 100 200 300 400 500 600 700 800 Total Fungi TotalProtozoa Cropland 1 East Cropland 1 West (Animal Impact) Native Rangeland Ng/g Ward Laboratories, Inc Farm #1 North Dakota Below Ground Diversity
  • 35.
    Farm #2 North Dakota NativeRangeland HaylandCorn Silage Oat/Pea with Covers
  • 36.
    Landuse PLFA NG/Gram Organic C PPM TotalN Inorganic N Organic N Native Rangeland 1916 291 63 6 57 Hayland Brome/Alf 1125 242 64 9 56 Oat/Pea With Covers 3145 269 63 9 54 Corn Silage 1206 238 59 10 49 Farm #2 – North Dakota PLFA and Haney Results – Ward Labs
  • 37.
    0 1000 2000 3000 4000 5000 6000 7000 8000 9000 PLFA Mycorrhizal FungiSaprophytic Fungi Protozoa A Tale of Three Fields Farm #3 Menoken Farm Farm #4 420 82 0 ng/g 143 40 0876 295 39 Phospholipid Fatty Acid (PLFA) Ward Lab Farm #3: Hayland field with no exporting. All hay produced is fed on the field. Menoken Farm: A field using all 4 crop types and cover crops with livestock integration. Farm #4: Heavy use of fungicides every third year. Lighter use on off years.
  • 38.
    Farm #5 Biological SoilTests - PLFA Field 1 Corn - Year One Season Long Cover Crop - Year Two Field 2 Season Long Cover Crop - Year One Season Long Cover Crop - Year Two • Total Biology – 1774 ng/g soil • Bacteria – 1473 ng/g soil • Actinomycetes – 123 ng/g soil • Fungi – 147 ng/g soil • Ratio Bacteria:Fungi – 10.0 • Mycorrhiza – 37 ng/g soil • Total Biology – 3312 ng/g soil • Bacteria – 2510 ng/g soil • Actinomycetes – 249 ng/g soil • Fungi – 513 ng/g soil • Ratio Bacteria:Fungi – 4.9 • Mycorrhiza – 251 ng/g soil
  • 39.
  • 40.
    The Menoken Farm Sunflowerand 10 Broadleaf Covers Cropping System of the Future?
  • 41.
    10 Covers: Buckwheat –1.0 lbs Flax – 0.75 lbs Cowpea – 2.5 lbs Soybean – 3.75 lbs Turnip - 0.25 lbs Radish – 0.25 lbs Pea – 3.75 lbs Phacelia – 0.25 lbs Canola – 0.25 lbs Subclover – 0.25 lbs Total 13 lbs/ac
  • 42.
    Fertilizer * Applied Per Acre ActualPounds Diesel Fuel EQ Gal/Lb N Diesel Fuel EQ Gal/Ac Urea 90 0.129 11.6 (43.8 Liters) Phosphorous P205 40.5 0.042 2.2 (8.3 Liters) Insecticide ** Applied Per Acre Pounds AI Diesel Fuel EQ Gal/Lb Insect. Diesel Fuel EQ Gal/Ac Warrior 0.01125 0.881 0.01 (0.04 Liters) Fungicide *** Applied Per Acre Pounds AI Diesel Fuel EQ Gal/Lb Fung. Diesel Fuel EQ Gal/ac Headline – 2 Aps 0.1463 2.172 0.6 (2.3 Liters) Total Diesel Fuel EQ Gal Per Acre = 14.4 (54.4 Liters) Cover Crop Energy Conservation – 1800 Lb Yield Goal • * Energy Efficiency in Corn Nitrogen Fertilization, 2010, John Sawyer, Depart of Agronomy, Iowa State U. • ** T.O. West and G.Marland; Agriculture, Ecosystems and Environment 91(2002): 217-232 • *** E. Audsley, et al. 2009, Cranfield University, Bedford, England. Estimation of the Greenhouse Gas Emissions from Agricultural Manufacture and Use
  • 43.
    Soil Health Principles ASystems Approach – the Foundation
  • 44.
    Soil Health Principles SystemsApproach Soil Health: the continued capacity of soil to function as a vital living ecosystem that sustains plants, animals, and humans. Soil Armor
  • 45.
    No-Till Field Cont. CornSilage No Armor! Corn Planting into Multi Specie Cover Menoken Farm
  • 46.
    Fall Seeded CoverCrop. Passive Armor and Active Armor. Both are food sources. Menoken Farm
  • 47.
    Soil Health Principles SystemsApproach Soil Health: the continued capacity of soil to function as a vital living ecosystem that sustains plants, animals, and humans. Soil Armor Minimize Soil Disturbance
  • 48.
    Horizontal Compaction Layers. First YearNo-till. North Dakota June 2015
  • 49.
    The trend inagricultural conservation has been toward less tillage, but…….. Dust Bowl Era Present
  • 50.
    Soil Health Principles SystemsApproach Soil Health: the continued capacity of soil to function as a vital living ecosystem that sustains plants, animals, and humans. Soil Armor Minimize Soil Disturbance Plant Diversity
  • 51.
    Crop Diversity “The typeand diversity of organic residues added to a soil can influence the type and diversity of organisms that make up the soil community. “ The Nature and Properties of Soils, 14th Edition; Chapter 12.5
  • 52.
    Menoken Farm 6 YearsNo-till High Crop Diversity Cover Crops Livestock Compost Menoken Farm 6 Years No-till Low Crop Diversity No Covers No Livestock Full Commercial Fertility
  • 53.
    Soil Health Principles SystemsApproach Soil Health: the continued capacity of soil to function as a vital living ecosystem that sustains plants, animals, and humans. Soil Armor Minimize Soil Disturbance Plant DiversityContinual Live Plant/Root
  • 54.
    A. H. Heggenstaller,University of Alberta Missed Opportunities
  • 56.
  • 57.
    Nurture Nature withSystem Synergies No Tillage Cover Crops Sustainability Carbon management Minimum carbon loss Maximum carbon input Dr. Don Reicosky ARS, Morris, MN
  • 58.
    Covers Seeded AfterWheat Harvest Menoken Farm
  • 59.
    Field 3: NoHistory of Cover Crops. Weeds: Downy Brome, Wild Oat, Tansy Mustard Crop History 2009 Wheat 2010 Wheat 2011 Wheat The Menoken Farm Photo Date 4/30/12 Herbicide Applied 5/1/12 Seeding Date 5/1/12 Low Crop Diversity No Cover Crops
  • 60.
    Field 4 Historyof Cover Crops Crop History 2009 Cover Crop 2010 Corn 2011 Pea + Cover Crop The Menoken Farm Photo Date 4/30/12 Herbicide Applied 5/1/12 Seeding Date 5/1/12 High Crop Diversity With Cover Crops
  • 61.
    Spring Weed Suppression IntegratedPest Management BCSCD Site Cover CropNo Cover Crop
  • 62.
  • 63.
    Biennial Cover CropOptions Interseeding During the Growing Season (Gaining) Flying on During the Growing Season (Least Common) Drilling After Harvest (Most Common) North Dakota, USA
  • 64.
    Cereal Rye Late FallSeeded Small Growth Before Freeze Up Photo: February 2017
  • 65.
    Cereal Rye Early SpringGrowth Photo: April 19, 2017 North Dakota, USA
  • 66.
    Planting Green intoCereal Rye Soybeans May 25, 2017 North Dakota, USA
  • 67.
    Planting Green withBiennials in North Dakota • Winter Hardy • Controls Erosion • Saline Tolerant • Water Quality • Wildlife Habitat • Early Spring Grazing • Adds Crop Diversity • Adds Carbon
  • 68.
    Sets the Stagefor Livestock Integration
  • 69.
    Video - UsingBiennials for Planting Green, North Dakota. Photo: May 25, 2017
  • 70.
    Cereal Rye Termination Earlyin Dry Years Later in Wet Years
  • 71.
  • 72.
    Soil Health Principles SystemsApproach Soil Health: the continued capacity of soil to function as a vital living ecosystem that sustains plants, animals, and humans. Soil Armor Minimize Soil Disturbance Plant DiversityContinual Live Plant/Root Livestock Integration
  • 73.
    Warm Season CoverCrop Mixture 9000 lbs/ac (10,080 kg/hectare Menoken Farm - 2016
  • 74.
    Cover Crop Feedand Forage Report Menoken Farm 19-Sep-16 Specie Crude Protein RFV TDN Annual Ryegrass - Top/half 15.67% 110.81 61.88% Annual Ryegrass - Bottom/half 8.02% 109.05 60.12% Cowpea - Top/half 14.79% 218.90 69.38% Cowpea -Bottom/half 4.35% 103.72 58.94% Hairy Vetch - Top/half 14.75% 126.74 60.78% Hairy Vetch - Bottom/half 6.07% 85.59 52.08% Pearl Millet - Top/half 9.77% 83.95 59.18% Pearl Millet - Bottom/half 1.77% 86.91 57.79% Radish - Top/half 10.74% 105.20 56.08% Radish - Bottom/half 6.54% 75.30 48.09% Soybean - Top/half 17.90% 190.15 67.95% Soybean - Bottom/half 11.76% 114.08 59.10% Sudan - Top/half 7.83% 83.93 58.21% Sudan - Bottom/half 7.52% 84.78 57.56% Sunflower - Top/half 10.38% 193.66 65.57% Sunflower - Bottom/half 6.06% 123.83 58.30% Sweet clover - Top/half 24.53% 228.51 72.25% Sweet clover - Bottom/half 12.62% 97.47 55.15% Cool Season Cover Crop Mix (fall seeded) 26.79% 208.43 71.32% Source: Dairyland Laboratories, Inc.
  • 75.
    Moving the openheifers to the next paddock – 17 head.
  • 77.
  • 78.
    Menoken Farm Cool SeasonCover Crop Mix - Crop Rolling (Video)
  • 79.
    Soil Monitoring 10/22/2015 UngrazedCover Crop PLFA 2008 NG/G Solvita 45 ppm C Total Organic Carbon 152 ppm C Soil Monitoring 10/22/2015 Grazed Cover Crop PLFA 3249 NG/G Solvita 50 ppm C Total Organic Carbon 172 ppm C The Menoken Farm
  • 80.
  • 81.
    Salinity Control Erosion Control and Water Quality BuildSoil Aggregates Why Rotational Perennials? How About Livestock Integration? Increase Carbon
  • 82.
    Seeded the CoolSeason Species - November 2013 Seeded the Warm Season Species – June 2014 First year grazing - 2015 Side Oats Grama 1.5 Switch Grass 1.7 Blue Flax .05 Yellow Coneflower .05 Maximilian Sunflower .05 Alfalfa 1 Sweet Clover .75 Black Eyed Susan .05 Sainfoin 2.25 Canada Milkvetch .05 Evening Primrose .05 Plains Coreopsis .05 Big Bluestem1.5 Indian Grass .4 Little Bluestem .25 Blue Grama .2 Meadow Brome 2 Western Wheat 2 Green Needle 2 Green Wheat 2 Intermediate Wheat 2 Total of 21 Species Menoken Farm 2015
  • 83.
    Menoken Farm Yearlings movedout of this paddock a few hours before the photo was taken.
  • 84.
    Menoken Farm • 95%+ Ground Cover • One - 12 Acre Field • 12 Paddocks • 3 Day Moves • No Regrowth Is Grazed • Harvested 30 – 40% • Single Wire Electric • Cell Center
  • 85.
    Specie Crude Protein% RFV TDN % Alfalfa – Top 24.4 264 75.1 Alfalfa – Bottom 16.5 140 61.6 Meadow Brome – Top 12.7 100 64.8 Meadow Brome - Bottom 9.4 85 61.3 Intermediate – Top 15.8 106 70.7 Intermediate – Bottom 10.6 90 64.5 Ward Laboratories 6/17/16 Menoken Farm 21 Specie Mixture Grasses, Legumes, and Forbs
  • 86.
    Starting Period 5/25/16 EndingPeriod 6/30/16 Total Grazing Period 37 Days Starting Weight Per Heifer 632 lbs (287 Kg) Ending Weight Per Heifer 734 lbs (334 Kg) Total Gain Per Heifer 734 lbs – 632 lbs = Daily Gain Per Heifer 102 lbs/37 Days = 102 lbs (46 Kg) 2.75 lbs Per Day Gain (1.25 Kg) Gain Per Herd 17 head x 102 lbs = 1734 Total lbs (788 Kg) Gain Per Acre 1734 lbs/12 acres = 145 lbs Per Acre (163 Kg/Hectare) Menoken Farm Herd Size 17 Open Heifers – Field 1 – 1st Rotation
  • 87.
    Starting Period 8/18/16 EndingPeriod 8/28/16 Total Grazing Period 11 Days Starting Weight Per Heifer 798 lbs (363 Kg) Ending Weight Per Heifer 835 lbs (380 Kg) Total Gain Per Heifer 798 lbs – 835 lbs = Daily Gain Per Heifer 37 lbs/11 Days = 37 lbs (17 Kg) 3.4 lbs Per Day Gain (1.5 Kg) Gain Per Herd 17 head x 37lbs = 629 Total lbs (286 Kg) Gain Per Acre 629 lbs/12 acres = 52 lbs Per Acre (58 Kg/Hectare) Menoken Farm Herd Size 17 Open Heifers – Field 1 – 2nd Rotation
  • 88.
    Menoken Farm Soil Monitoring– 5 Years Field 1 East Year pH SOM 10/12 5.8 2.8 12/17 6.8 3.2 Base Saturation 2013 Cropland 2014 Seed to Grass 2015 Graze 2016 Graze 2017 Graze H 0-5% K 1-7% Ca 65-75% Mg 15-20% Na 0-5% H K Ca Mg Na 36 4 45 15 0 0 8 63 28 1
  • 89.
    0 1000 2000 3000 4000 5000 6000 2012 Cropland 2013Cropland 2014 Seed Grass 2015 Grazed 2016 Grazed 2017 Grazed TotalLivingMicrobialBiomass,PhospholipidFattyAcid(ng/g) Grazing Impacts on Soil Food Web 1 East PLFA (Narrow) 1 West PLFA (Wide) Menoken Farm
  • 90.
    Find ways toincrease soil organic carbon, and soil health will follow. Dr. Don Reicosky ARS-Morris, MN
  • 91.
    Self Education • TheNature and Properties of Soils – 14th Edition : by Brady and Weil • Journals of Lewis and Clark • Buffalo Bird Women’s Garden : by Gilbert Wilson • The One Straw Revolution: by Masanobu Fukuoka • Managing Cover Crops Profitably 3rd Edition • A Sand County Almanac: by Aldo Leopold • Soil Biology Primer: by Elaine Ingham • Life in the Soil: by James Nardi • An Agricultural Testament: by Sir Albert Howard • Dirt – The Erosion of Civilizations: by David Montgomery www.menokenfarm.com Click on the Learn tab. • Early Settlement of North Dakota: by Clement Lounsberry • 1491: by Charles Mann
  • 92.
    Contact Information: Jay Fuhrer SoilHealth Specialist Natural Resources Conservation Service Bismarck, ND Mailing address: ND State Office 220 East Rosser Avenue PO Box 1458 Bismarck, North Dakota USA 58502-1458 Email address: Jay.Fuhrer@nd.usda.gov Telephone: 1-701-530-2011 (O) 1-701-426-8611 (C) Websites: NRCS/USDA https://www.nrcs.usda.gov/wps/portal/nrcs/site/nd/home/ Menoken Farm http://menokenfarm.com/ USDA IS AN EQUAL OPPORTUNITY PROVIDER, EMPLOYER, and LENDER