This document summarizes a numerical investigation into the effects of roughness on near-bed turbulence characteristics in oscillatory flows. Direct numerical simulations were performed for two particle sizes corresponding to large gravel and small sand particles. A double-averaging technique was used to study the wake field spatial inhomogeneities introduced by the roughness. Preliminary results showed additional production and transport terms in the double-averaged Reynolds stress budgets, indicating alternate turbulent energy transfer pathways. Budgets of normal Reynolds stress components revealed redistribution of energy from the streamwise to other components due to pressure work. The large gravel particles significantly modulated near-bed flow structures and isotropization, while elongated horseshoe structures formed for the sand case due to high shear. Redistribution of energy
FIELD AND THEORETICAL ANALYSIS OF ACCELERATED CONSOLIDATION USING VERTICAL DR...P singh
Mumbai is the region consisting of soft compressible marine clay deposits. There are several construction problems on such soils and thus ground improvement is need to be carried out. Vertical drains is generally preferred technique as accelerated settlement is achieved during the construction phase itself if planned accordingly. The concept of vertical drains is based on the theory of three dimensional consolidation as described by Terzaghi (1943). Based on this concept, a consolidation programme is developed and an attempt is made to determine the field to laboratory coefficient of vertical consolidation ratio by Taylor’s Square Root of Time Method and Casagrande’s Logarithm of Time Fitting Method for this region by considering the case study of Bhandup Lagoon Works Embankment. Based on this ratio, the rate of consolidation and time required for consolidation in the field can be determined knowing the consolidation parameters. Equations are developed by using output of the programme and it is explained.
IJERA (International journal of Engineering Research and Applications) is International online, ... peer reviewed journal. For more detail or submit your article, please visit www.ijera.com
A Note on the Beavers and Joseph Condition for Flow over a Forchheimer Porous...IJRESJOURNAL
ABSTRACT : In thiswork, an attemptis made to relate the slip parameter in the Beavers and Joseph condtionat the interface between a Darcy layer and a Navier-Stokes channel, to the slip parameter to beusedwhen the porous layer is a Forchheimer layer.
Application of DRP scheme solving for rotating disk-driven cavityijceronline
International Journal of Computational Engineering Research (IJCER) is dedicated to protecting personal information and will make every reasonable effort to handle collected information appropriately. All information collected, as well as related requests, will be handled as carefully and efficiently as possible in accordance with IJCER standards for integrity and objectivity.
This paper presents the effectiveness and assessment of the potential of the vacuum consolidation using Prefabricated Vertical Drain, in Mumbai marine clay, as more economical and effective method of consolidation. Large 3-D consolidation cell was designed to carry out laboratory experiments on the reconstituted soft marine clay from the project site at New Mumbai, western part of the India. Various combinations of the surcharge and vacuum loading with PVD were tested and examined. The study showed that method is feasible and save significant time for the consolidation process in turn saving in construction time of foundation on soft marine clay. The strength and stability of the clay also enhances greatly. This paper examines the applicability of Asaoka method to predict settlement of Mumbai Marine clay. An overview is also provided to some geotechnical properties such as density, moisture content, void ratio and shear strength which are predominantly affected during the vacuum preloading system. The settlement analysis was conducted using conventional solution by Hansbo and Asaoka.. The hydraulic conductivity of reconstituted specimen was back calculated. The Back calculated coefficient of radial consolidation was observed in the range of 1.45 to 2.27 m2/year and ratio of ch/cv.odeo was found to be 1.5 to 2. The addition of vacuum pressure tends to increase horizontal coefficient of consolidation leads to shorten the preloading time t by 15 to 80 % depending on the vacuum preload magnitude. The attempt is also made to find out kh/ks values for the selected soil specimen. It was observed that kh/ks value for Mumbai marine clay is about 1.50.
International Journal of Engineering and Science Invention (IJESI)inventionjournals
International Journal of Engineering and Science Invention (IJESI) is an international journal intended for professionals and researchers in all fields of computer science and electronics. IJESI publishes research articles and reviews within the whole field Engineering Science and Technology, new teaching methods, assessment, validation and the impact of new technologies and it will continue to provide information on the latest trends and developments in this ever-expanding subject. The publications of papers are selected through double peer reviewed to ensure originality, relevance, and readability. The articles published in our journal can be accessed online
Nonclassical Properties of Even and Odd Semi-Coherent StatesIOSRJAP
Even and odd semi-coherent states have been introduced. Some of the nonclasscial properties of the states are studied in terms of the quadrature squeezing as well as sub-Poissonian photon statistics. The Husimi– Kano Q-function and the phase distribution in the framework of Pegg and Barnett formalism, are also discussed.
Field and Theoretical Analysis of Accelerated Consolidation Using Vertical Dr...inventionjournals
Mumbai is the region consisting of soft compressible marine clay deposits. There are several construction problems on such soils and thus ground improvement is need to be carried out. Vertical drains is generally preferred technique as accelerated settlement is achieved during the construction phase itself if planned accordingly. The concept of vertical drains is based on the theory of three dimensional consolidation as described by Terzaghi (1943). Based on this concept, a consolidation programme is developed and an attempt is made to determine the field to laboratory coefficient of vertical consolidation ratio by Taylor’s Square Root of Time Method and Casagrande’s Logarithm of Time Fitting Method for this region. Based on this, the rate of consolidation and time required for consolidation in the field can be determined knowing the consolidation parameters. Equations are developed by using output of the programme and it is explained.
This paper illustrates that the flow resistance equations require further testing and development for gravel bed rivers. Such rivers are characterized by coarse bed materials, steeps slopes, and low depths. Comparison of data with the similar resistance equation relating the Darcy -Weisbach friction factor to the logarithm of relative submergence shows that the equation tends to overestimate the resistance in uniform flow. The main objective of this paper is review the current knowledge about flow resistance in gravel bed rivers.
"A full experimental and numerical modelling of the practicability of thin fo...Mehran Naghizadeh
Paper entitled "A full experimental and numerical modelling of the practicability of thin foam barrier as vibration reduction measure" published by Soil Dynamics and Earthquake Engineering (2020).
Influence of Dense Granular Columns on the Performance of Level and Gently Sl...Mahir Badanagki, Ph.D.
Dense granular columns are often used as a liquefaction mitigation measure to (1) enhance drainage; (2) provide shear reinforcement; and (3) densify and increase lateral stresses in the surrounding soil during installation. However, the independent influence and contribution of these mitigation mechanisms on the excess pore pressures, accelerations (or shear stresses), and lateral and vertical deformations are not sufficiently understood to facilitate a reliable design. This paper presents the results of a series of dynamic centrifuge tests to fundamentally evaluate the influence of dense granular columns on the seismic performance of level and gently sloped sites, including a liquefiable layer of clean sand. Specific consideration was given to the relative importance of enhanced drainage and shear reinforcement. Granular columns with greater area replacement ratios (Ar), for example Ar greater than about 20%, were shown to be highly effective in reducing the seismic settlement and lateral deformations in gentle slopes, owing primarily to the expedited dissipation of excess pore water pressures. The influence of granular columns on accelerations (and therefore, the shear stress demand) in the surrounding soil depended on the column’s Ar and drainage capacity. Increasing Ar from 0 to 10% was shown to reduce the accelerations across a range of frequencies in the surrounding soil due to the shear reinforcement effect alone. However, enhanced drainage simultaneously increased the rate of excess pore pressure dissipation, helping the surrounding soil regain more quickly its shear strength and stiffness. At short drainage distances or higher Ar values (for example, 20%), this could notably amplify the acceleration and shear stress demand on soil, particularly at greater frequencies that influence PGA. The experimental insight presented in this paper aims to improve our understanding of the mechanics of liquefaction and lateral spreading mitigation with granular columns, and it may be used to validate the numerical models used in their design.
Flow Modeling Based Wall Element TechniqueCSCJournals
Two types of flow where examined, pressure and combination of pressure and Coquette flow of confined turbulent flow with a one equation model used to depict the turbulent viscosity of confined flow in a smooth straight channel when a finite element technique based on a zone close to a solid wall has been adopted for predicting the distribution of the pertinent variables in this zone and examined even with case when the near wall zone was extended away from the wall. The validation of imposed technique has been tested and well compared with other techniques.
Wave-Current Interaction Model on an Exponential Profileijceronline
We develop a model that approximates the exponential depth, which exhibits the behavior of linear depth particularly in the surf zone. The main effect of the present exponential depth is found in the shoaling zone, where the depth remains finite. The basic description and the outcome is essentially rip currents where in the surf zone the wave behavior is the same as found in the linear depth case. In the shoaling zone the present exponential depth exhibits the hypergeometric functions.
A full experimental and numerical modelling of the practicability of thin foa...Mehran Naghizadeh
This paper presents the performance of geofoam-filled trenches in mitigating of ground vibration transmissions by the means of a full experimental study. The results are interpreted in the frequency domain. Fully automated 2D and 3D numerical models are applied to evaluate the screening effectiveness of geofoam-filled trenches in the active and passive schemes. Experimental results are in good agreement with the prediction of numerical modelling. The validated model is used to investigate the influence of geometrical and dimensional features on the trench. In addition, three different systems including single, double and triangle wall obstacles are selected for analysis, and the results are compared for various situations. The parametric study is based on complete automation of the model through coupling finite element analysis software (Plaxis) and Python programming language to control input, change the parameters, as well as to produce output and calculate the efficiency of the barrier. The results show that the depth and the width of approximately 1λr and 0.2λr, respectively are enough to reach the acceptable amount of efficiency for the active isolation for all three systems. For the passive scheme, the role of depth can be ignored for the single and double wall barriers, while depth plays a significant role for the triangle wall system.
analysis of flow resistance in open channel for proper flow predictionINFOGAIN PUBLICATION
In an open channel flow, the Manning’s n depends on the bed material of the channel, the slope of the channel and the rate of discharge in the channel. Experiments are done with two bed materials, the original bed surface of the channel and with grass carper. The roughness coefficient is determined in various cases. The variations in roughness coefficient is tested with respect to flow parameters such as discharge, depth and bed slope. The effect of variations the flow parameters on different bed roughness is also analyzed by taking into account the original flume surface and grass carpet surface.
NUMERICAL SIMULATION OF FORCED CONVECTION IN OIL SANDS USING LATTICE BOLTZMAN...IAEME Publication
Lattice Boltzmann method is used to simulate forced convection in oil sands (low permeable porous geometries). Fluid flows through a sandstone look alike square geometry with left wall of the geometry kept at higher temperature compared to other walls. Investigation is carried out to study influence of increased temperature on flow properties by observing the variation in velocity and temperature profiles for various permeability and porosity values, which were varied to match the geometrical properties of oil sands.
NO1 Uk best vashikaran specialist in delhi vashikaran baba near me online vas...Amil Baba Dawood bangali
Contact with Dawood Bhai Just call on +92322-6382012 and we'll help you. We'll solve all your problems within 12 to 24 hours and with 101% guarantee and with astrology systematic. If you want to take any personal or professional advice then also you can call us on +92322-6382012 , ONLINE LOVE PROBLEM & Other all types of Daily Life Problem's.Then CALL or WHATSAPP us on +92322-6382012 and Get all these problems solutions here by Amil Baba DAWOOD BANGALI
#vashikaranspecialist #astrologer #palmistry #amliyaat #taweez #manpasandshadi #horoscope #spiritual #lovelife #lovespell #marriagespell#aamilbabainpakistan #amilbabainkarachi #powerfullblackmagicspell #kalajadumantarspecialist #realamilbaba #AmilbabainPakistan #astrologerincanada #astrologerindubai #lovespellsmaster #kalajaduspecialist #lovespellsthatwork #aamilbabainlahore#blackmagicformarriage #aamilbaba #kalajadu #kalailam #taweez #wazifaexpert #jadumantar #vashikaranspecialist #astrologer #palmistry #amliyaat #taweez #manpasandshadi #horoscope #spiritual #lovelife #lovespell #marriagespell#aamilbabainpakistan #amilbabainkarachi #powerfullblackmagicspell #kalajadumantarspecialist #realamilbaba #AmilbabainPakistan #astrologerincanada #astrologerindubai #lovespellsmaster #kalajaduspecialist #lovespellsthatwork #aamilbabainlahore #blackmagicforlove #blackmagicformarriage #aamilbaba #kalajadu #kalailam #taweez #wazifaexpert #jadumantar #vashikaranspecialist #astrologer #palmistry #amliyaat #taweez #manpasandshadi #horoscope #spiritual #lovelife #lovespell #marriagespell#aamilbabainpakistan #amilbabainkarachi #powerfullblackmagicspell #kalajadumantarspecialist #realamilbaba #AmilbabainPakistan #astrologerincanada #astrologerindubai #lovespellsmaster #kalajaduspecialist #lovespellsthatwork #aamilbabainlahore #Amilbabainuk #amilbabainspain #amilbabaindubai #Amilbabainnorway #amilbabainkrachi #amilbabainlahore #amilbabaingujranwalan #amilbabainislamabad
Water scarcity is the lack of fresh water resources to meet the standard water demand. There are two type of water scarcity. One is physical. The other is economic water scarcity.
Final project report on grocery store management system..pdfKamal Acharya
In today’s fast-changing business environment, it’s extremely important to be able to respond to client needs in the most effective and timely manner. If your customers wish to see your business online and have instant access to your products or services.
Online Grocery Store is an e-commerce website, which retails various grocery products. This project allows viewing various products available enables registered users to purchase desired products instantly using Paytm, UPI payment processor (Instant Pay) and also can place order by using Cash on Delivery (Pay Later) option. This project provides an easy access to Administrators and Managers to view orders placed using Pay Later and Instant Pay options.
In order to develop an e-commerce website, a number of Technologies must be studied and understood. These include multi-tiered architecture, server and client-side scripting techniques, implementation technologies, programming language (such as PHP, HTML, CSS, JavaScript) and MySQL relational databases. This is a project with the objective to develop a basic website where a consumer is provided with a shopping cart website and also to know about the technologies used to develop such a website.
This document will discuss each of the underlying technologies to create and implement an e- commerce website.
Democratizing Fuzzing at Scale by Abhishek Aryaabh.arya
Presented at NUS: Fuzzing and Software Security Summer School 2024
This keynote talks about the democratization of fuzzing at scale, highlighting the collaboration between open source communities, academia, and industry to advance the field of fuzzing. It delves into the history of fuzzing, the development of scalable fuzzing platforms, and the empowerment of community-driven research. The talk will further discuss recent advancements leveraging AI/ML and offer insights into the future evolution of the fuzzing landscape.
Automobile Management System Project Report.pdfKamal Acharya
The proposed project is developed to manage the automobile in the automobile dealer company. The main module in this project is login, automobile management, customer management, sales, complaints and reports. The first module is the login. The automobile showroom owner should login to the project for usage. The username and password are verified and if it is correct, next form opens. If the username and password are not correct, it shows the error message.
When a customer search for a automobile, if the automobile is available, they will be taken to a page that shows the details of the automobile including automobile name, automobile ID, quantity, price etc. “Automobile Management System” is useful for maintaining automobiles, customers effectively and hence helps for establishing good relation between customer and automobile organization. It contains various customized modules for effectively maintaining automobiles and stock information accurately and safely.
When the automobile is sold to the customer, stock will be reduced automatically. When a new purchase is made, stock will be increased automatically. While selecting automobiles for sale, the proposed software will automatically check for total number of available stock of that particular item, if the total stock of that particular item is less than 5, software will notify the user to purchase the particular item.
Also when the user tries to sale items which are not in stock, the system will prompt the user that the stock is not enough. Customers of this system can search for a automobile; can purchase a automobile easily by selecting fast. On the other hand the stock of automobiles can be maintained perfectly by the automobile shop manager overcoming the drawbacks of existing system.
Cosmetic shop management system project report.pdfKamal Acharya
Buying new cosmetic products is difficult. It can even be scary for those who have sensitive skin and are prone to skin trouble. The information needed to alleviate this problem is on the back of each product, but it's thought to interpret those ingredient lists unless you have a background in chemistry.
Instead of buying and hoping for the best, we can use data science to help us predict which products may be good fits for us. It includes various function programs to do the above mentioned tasks.
Data file handling has been effectively used in the program.
The automated cosmetic shop management system should deal with the automation of general workflow and administration process of the shop. The main processes of the system focus on customer's request where the system is able to search the most appropriate products and deliver it to the customers. It should help the employees to quickly identify the list of cosmetic product that have reached the minimum quantity and also keep a track of expired date for each cosmetic product. It should help the employees to find the rack number in which the product is placed.It is also Faster and more efficient way.
Vaccine management system project report documentation..pdfKamal Acharya
The Division of Vaccine and Immunization is facing increasing difficulty monitoring vaccines and other commodities distribution once they have been distributed from the national stores. With the introduction of new vaccines, more challenges have been anticipated with this additions posing serious threat to the already over strained vaccine supply chain system in Kenya.
Sachpazis:Terzaghi Bearing Capacity Estimation in simple terms with Calculati...Dr.Costas Sachpazis
Terzaghi's soil bearing capacity theory, developed by Karl Terzaghi, is a fundamental principle in geotechnical engineering used to determine the bearing capacity of shallow foundations. This theory provides a method to calculate the ultimate bearing capacity of soil, which is the maximum load per unit area that the soil can support without undergoing shear failure. The Calculation HTML Code included.
Courier management system project report.pdfKamal Acharya
It is now-a-days very important for the people to send or receive articles like imported furniture, electronic items, gifts, business goods and the like. People depend vastly on different transport systems which mostly use the manual way of receiving and delivering the articles. There is no way to track the articles till they are received and there is no way to let the customer know what happened in transit, once he booked some articles. In such a situation, we need a system which completely computerizes the cargo activities including time to time tracking of the articles sent. This need is fulfilled by Courier Management System software which is online software for the cargo management people that enables them to receive the goods from a source and send them to a required destination and track their status from time to time.
Explore the innovative world of trenchless pipe repair with our comprehensive guide, "The Benefits and Techniques of Trenchless Pipe Repair." This document delves into the modern methods of repairing underground pipes without the need for extensive excavation, highlighting the numerous advantages and the latest techniques used in the industry.
Learn about the cost savings, reduced environmental impact, and minimal disruption associated with trenchless technology. Discover detailed explanations of popular techniques such as pipe bursting, cured-in-place pipe (CIPP) lining, and directional drilling. Understand how these methods can be applied to various types of infrastructure, from residential plumbing to large-scale municipal systems.
Ideal for homeowners, contractors, engineers, and anyone interested in modern plumbing solutions, this guide provides valuable insights into why trenchless pipe repair is becoming the preferred choice for pipe rehabilitation. Stay informed about the latest advancements and best practices in the field.
Saudi Arabia stands as a titan in the global energy landscape, renowned for its abundant oil and gas resources. It's the largest exporter of petroleum and holds some of the world's most significant reserves. Let's delve into the top 10 oil and gas projects shaping Saudi Arabia's energy future in 2024.
Student information management system project report ii.pdfKamal Acharya
Our project explains about the student management. This project mainly explains the various actions related to student details. This project shows some ease in adding, editing and deleting the student details. It also provides a less time consuming process for viewing, adding, editing and deleting the marks of the students.
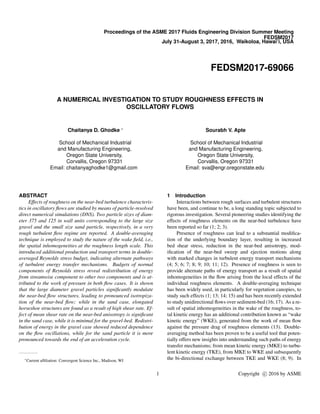
1. Proceedings of the ASME 2017 Fluids Engineering Division Summer Meeting
FEDSM2017
July 31-August 3, 2017, 2016, Waikoloa, Hawai’i, USA
FEDSM2017-69066
A NUMERICAL INVESTIGATION TO STUDY ROUGHNESS EFFECTS IN
OSCILLATORY FLOWS
Chaitanya D. Ghodke ∗
School of Mechanical Industrial
and Manufacturing Engineering,
Oregon State University,
Corvallis, Oregon 97331
Email: chaitanyaghodke1@gmail.com
Sourabh V. Apte
School of Mechanical Industrial
and Manufacturing Engineering,
Oregon State University,
Corvallis, Oregon 97331
Email: sva@engr.oregonstate.edu
ABSTRACT
Effects of roughness on the near-bed turbulence characteris-
tics in oscillatory flows are studied by means of particle-resolved
direct numerical simulations (DNS). Two particle sizes of diam-
eter 375 and 125 in wall units corresponding to the large size
gravel and the small size sand particle, respectively, in a very
rough turbulent flow regime are reported. A double-averaging
technique is employed to study the nature of the wake field, i.e.,
the spatial inhomogeneities at the roughness length scale. This
introduced additional production and transport terms in double-
averaged Reynolds stress budget, indicating alternate pathways
of turbulent energy transfer mechanisms. Budgets of normal
components of Reynolds stress reveal redistribution of energy
from streamwise component to other two components and is at-
tributed to the work of pressure in both flow cases. It is shown
that the large diameter gravel particles significantly modulate
the near-bed flow structures, leading to pronounced isotropiza-
tion of the near-bed flow; while in the sand case, elongated
horseshoe structures are found as a result of high shear rate. Ef-
fect of mean shear rate on the near-bed anisotropy is significant
in the sand case, while it is minimal for the gravel-bed. Redistri-
bution of energy in the gravel case showed reduced dependence
on the flow oscillations, while for the sand particle it is more
pronounced towards the end of an acceleration cycle.
∗Current affiliation: Convergent Science Inc., Madison, WI
1 Introduction
Interactions between rough surfaces and turbulent structures
have been, and continue to be, a long standing topic subjected to
rigorous investigation. Several pioneering studies identifying the
effects of roughness elements on the near-bed turbulence have
been reported so far (1; 2; 3).
Presence of roughness can lead to a substantial modifica-
tion of the underlying boundary layer, resulting in increased
bed shear stress, reduction in the near-bed anisotropy, mod-
ification of the near-bed sweep and ejection motions along
with marked changes in turbulent energy transport mechanisms
(4; 5; 6; 7; 8; 9; 10; 11; 12). Presence of roughness is seen to
provide alternate paths of energy transport as a result of spatial
inhomogeneities in the flow arising from the local effects of the
individual roughness elements. A double-averaging technique
has been widely used, in particularly for vegetation canopies, to
study such effects (1; 13; 14; 15) and has been recently extended
to study unidirectional flows over sediment-bed (16; 17). As a re-
sult of spatial inhomogeneities in the wake of the roughness, to-
tal kinetic energy has an additional contribution known as “wake
kinetic energy” (WKE), generated from the work of mean flow
against the pressure drag of roughness elements (13). Double-
averaging method has been proven to be a useful tool that poten-
tially offers new insights into understanding such paths of energy
transfer mechanisms; from mean kinetic energy (MKE) to turbu-
lent kinetic energy (TKE), from MKE to WKE and subsequently
the bi-directional exchange between TKE and WKE (8; 9). In
1 Copyright c 2016 by ASME
2. order to characterize modulation of the near-bed turbulence as it
governs the nature of inner–outer layer interactions along with
generation of the drag on the roughness elements, it is important
to analyze energy transport mechanism in detail.
While many attempts to investigate such turbulence charac-
teristics have been based on laboratory studies, obtaining some
of the terms related to pressure and small-scale energy dissipa-
tion is extremely challenging. On the other hand, owing to the
enormous computational cost in resolving individual roughness
elements, performing detailed numerical investigations of these
flows at high Reynolds numbers is still a challenge and very few
numerical investigations studying spatial inhomogeneities have
been reported so far (18; 8). Furthermore, most of the afore-
mentioned studies pertaining to this topic are reported for uni-
directional, steady flows. However, detailed information of the
effects of roughness on the near-bed turbulence in oscillatory,
non-stationary flows yet remain elusive.
As a first step towards fundamental understanding of such
flows, detailed simulations studying effects of gravel-type rough-
ness on the oscillatory turbulence have been recently reported in
(9; 10; 19; 20; 21; 22). Presence of roughness was shown to al-
ter near-bed TKE transport mechanism, resulting in reduction of
large-scale anisotropy. Supplementing (9), present investigation
aims to study several other aspects of the interactions between
rough-bed and oscillatory turbulence; in particular, effects of size
of the roughness elements, redistribution of energy between nor-
mal components of Reynolds stress as well as budgets of WKE to
understand the energy transfer between the wake and the turbu-
lence, among others. To the best of authors’ knowledge, such de-
tailed characterization is the first of its kind and may have direct
relevance to applications such as sediment transport in coastal
flows. The outline of the paper is as follows: the computational
setup and methodology are presented in § 2. In § 3, simulation
results are presented followed by main conclusions in § 4.
2 Computational setup
In the present notation x, y and z, respectively, denote the
streamwise, spanwise and vertical directions and u, v and w de-
note the velocity components in those directions. Viscous length
of the problem is defined by Stokes-layer thickness δ = 2ν/ω,
where ν is the kinematic viscosity, ω = 2π/T is the oscillation
frequency and T is the period of the wave. The rough-bed is
made up of a single layer of hexagonal pack of fixed spheri-
cal particles that are touching each other. To study the effects
of particle size on turbulence characteristics, two sizes of parti-
cle diameter normalized by the Stokes-layer thickness, D = d/δ,
corresponding to the large diameter gravel (D = 6.95) and the
small diameter sand-type roughness (D = 2.7) are studied. Based
on (cf. Fig. 2) from (9), both gravel and sand case correspond
to very rough turbulent regime; latter approaching the limit of
rough turbulent regime.
The dimensionless parameters to characterize the flow along
with grid resolutions are summarized in Table 2. As described in
(9), uniform grids, although not cubic, are employed only in the
region surrounding the particles and the grids are stretched in the
flow normal direction above z = 8δ(6δ) for the gravel (sand) us-
ing hyperbolic tangent function. For both the cases, the grid sizes
in the streamwise and spanwise directions, on an average, are less
than 8 and 6 wall units, respectively with ∆z+ < 1 in the near-
bed region and were shown to be adequate to capture near-bed
flow features (9; 12). Moreover, the present grid resolutions in
wall units are also comparable to the values used in existing DNS
studies on rough-wall turbulent boundary layers (18; 7; 23; 24).
Around 15 flow cycles per case are computed to obtain statistical
convergence.
The computational domain similar to (9; 12) consisting of a
doubly periodic box in x- and y-directions is used. The flow do-
main is around 24δ(28δ) long in the flow direction, 14δ(16δ)
wide in the spanwise direction and 45δ in the wall-normal di-
rection for the gravel (sand) case. Vertical size of the domain
is chosen such that all turbulent statistics decay to zero case at
almost half the vertical height for large Reynolds number sand
case under consideration.
The numerical solver based on fictitious domain algorithm
(25), that facilitates solution of freely moving particles for a wide
range of fluid-particle density ratios is used, although the parti-
cles are held fixed in the present study. The solver is fully val-
idated for a range of test cases and the details of the algorithm
as well as very detailed verification and validation studies have
been published elsewhere (26; 25). In addition, current flow con-
figuration for the gravel particle is validated against experimental
data of (27) for Reδ = 95 to show very good agreement as re-
ported in (9). Other numerical predictions such as friction factor
and boundary layer thickness for Reynolds numbers in the range
Reδ = 95 − 400 for the gravel-bed also show good comparison
with experimental data, further confirming adequacy of the com-
putational domain, grid resolution and rigid body treatment (9).
3 Results and discussion
3.1 Double averaging approach
Following (13; 16), a double averaging procedure is em-
ployed for the analysis described below that decomposes a flow
quantity, φ into double average φ (where, overbar and brackets
respectively denote phase and homogeneous spatial averages),
the spatial disturbance (also known as the wake fluctuation) of
the phase-average φ and the turbulent fluctuation φ ,
φ(x,y,z,ωt) = φ (z,ωt)+φ(x,y,z,ωt)+φ (x,y,z,ωt) (1)
Note that, φ is a measure of velocity scale of the wake field
and is an artifact of spatial heterogeneity resulting from rough-
2 Copyright c 2016 by ASME
3. Case Reδ Rea ReD k+
s D+ fw,max D/∆x D/∆y D/∆z a/ks Regime
Gravel 400 80000 2780 745 375 0.036 40 55 300 14.4 rough turbulent
Sand 545 148500 950 250 125 0.015 18 20 70 50 rough turbulent
TABLE 1. Computational parameters and grid resolution details: Reδ = U∞δ/ν is the Reynolds number based on the Stokes-layer thickness, Rea
= U∞a/ν is the Reynolds number based on the wave amplitude, ReD = U∞D/ν is the particle Reynolds number, k+
s = uτ,maxks/ν is the effective
roughness Reynolds number and D+ = uτ,maxD/ν is the particle size in wall units. Here, U∞ is the amplitude of the free-stream velocity, a = U∞/ω is
the amplitude of wave oscillation, ks ≈ 2d is the Nikuradse roughness size and uτ,max is the maximum friction velocity in a flow cycle. Maximum value
of the wave friction factor, fw,max = 2(uτ,max/U∞)2
is also given. Details of calculation of friction velocity are given in (9). Present study assumes low
Froude numbers.
ness elements. This term is otherwise absent in smooth wall
flows. Such spatial disturbance in the velocity field results in ad-
ditional stresses in the vicinity of the roughness elements given
by, uiuj and are called form-induced or dispersive stresses.
3.2 Near-bed flow structures
To elucidate the turbulence modulation by roughness ele-
ments, instantaneous near-bed flow structures are visualized for
the gravel and the sand particle case. As noted in Table 2, the
amplitude based Reynolds number (Rea) in the sand case is al-
most two times larger than that in the gravel case. On the other
hand, effective roughness Reynolds number (k+
s ) in the gravel
case is almost three times higher than that in the sand case. As
a result, there exist some differences in the elementary processes
that govern the near-bed turbulence structure in the gravel and the
sand case. The large size of the gravel particle plays an important
role in forming and then breaking the streamwise structures (9).
On the other hand, inertial effects play an important role in trig-
gering the turbulence in small diameter sand case. This behav-
ior is depicted in Fig. 1 that shows instantaneous near-bed flow
structures in the form of λ2-iso-surfaces (28) plotted at the peak
phase for (a) gravel and (b) sand particle. For the gravel-bed,
there exists a complex forest of highly densed near-bed struc-
tures that appear to be broken and are slightly inclined with re-
spect to the horizontal direction. The disruption of these near-bed
structures is attributed to the tendency of the gravel particles to
energize the wall-normal velocity fluctuations that in turn dis-
tort the streamwise structures and cause flow isotropization, as
already discussed in (9). As seen in Fig. 1 (b), the presence of
larger horseshoe structures that span over more than few parti-
cles diameter in the flow direction is clearly evident in the sand
case. Contrary to the gravel, these structures appear to be less
broken, suggesting lower degree of near-bed flow isotropization
in the sand case. Further quantification of flow isotropization for
the gravel and the sand particle in terms of variation of Reynolds
stresses along with their budgets and non-dimensional structure
parameters will be discussed in the following sections.
3.3 Reynolds and dispersive stresses
Figure 2 shows profiles of double-averaged Reynolds stress
normalized by u2
τ,max, plotted against wall-normal distance for
(a,b,c) gravel and (d,e,f) sand case; where zb is the zero-
displacement plane (it is the effective level at which the bulk drag
force is exerted on the roughness). Based on the variation of drag
force in the wall-normal direction, the zero-displacement plane
is located at 0.7D(0.85D) for the gravel (sand) particle. Profiles
at three phases in a flow cycle, representing (a,d) acceleration,
(b,e) peak and (c,f) deceleration phase are plotted.
In both flow cases, all components of Reynolds stress in-
crease away from the effective bed location, peak close to the
roughness crest level, and decay to zero in the outer region
away from the roughness crest. In agreement to canonical wall-
bounded flows, the streamwise component u 2 increases away
from the wall at much faster rate. Some discernible differences
are observed in the near-bed turbulence statistics between two
flow cases. As shown in Fig. 2 (d,e,f), the peak value of u 2 at
all the phases in the sand case is significantly higher than v 2
and w 2 . On the contrary, the disparity between peak values of
u 2 , v 2 and w 2 is significantly smaller in the gravel case
shown in Fig. 2 (a,b,c). This could be attributed to the effect of
particle size and indicates the tendency of the gravel particle to
redistribute more energy from streamwise to spanwise and wall-
normal stresses, as also reported in (9). It is also worth noting
that the fraction of energy redistributed from streamwise to other
two components in the sand case shows some dependence on the
flow oscillations, while for the gravel particle it remains almost
identical as shown in Fig. 2 (a,b,c); quantitative measure of this
characteristic will be presented later. As seen in Fig. 2 (a,b,c),
all the components of Reynolds stress in the gravel case decay
to zero at a distance (z−zb)/D ≈ 1 away from the effective bed
level. Conversely, as a result of high Reynolds number (Rea) and
presence of larger wall-inclined horseshoe structures, Reynolds
stresses decrease at much slower rate away from the crest and
remain significant until (z−zb)/D ≈ 2 in the sand case.
Wall-normal profiles of the dispersive stresses, uiuj , nor-
malized by u2
τ,max are plotted in Fig. 3 for (a,b,c) gravel and
3 Copyright c 2016 by ASME
4. (a) (b)
FIGURE 1. Close-up view of the instantaneous iso-surfaces of the λ2−parameter colored by u /U∞ for (a) gravel and (b) sand case plotted at a peak
phase, ωt = 5π/10. The flow direction is the positive x-direction.
(c)(b)(a)
(f)(e)(d)
FIGURE 2. Profiles of double-averaged Reynolds stress at various phases in a flow cycle for (a,b,c) gravel and (d,e,f) sand case. Symbols represent:
, streamwise Reynolds stress u 2 ; , spanwise Reynolds stress v 2 ; , wall-normal Reynolds stress w 2 ; , Reynolds shear stress u w . All the
terms are normalized by u2
τ,max. Panels show (a,d) acceleration, (b,e) peak and (c,f) deceleration phase. The dash-dot line at (z−zb)/D = 0.3 in (a,b,c)
and at 0.15 in (d,e,f) shows roughness crest level for the gravel and the sand particle, respectively.
(d,e,f) sand case. Overall variation of the dispersive stresses
is almost same as that of Reynolds stresses shown in Fig. 2.
The region with non-negligible dispersive stress uiuj , known
as roughness sublayer, is smaller for the gravel as that compared
to the sand particle with the thickness of approximately 0.5D and
2D above the zero-displacement plane in the former and the latter
case, respectively.
3.4 Budgets of Reynolds and dispersive stresses
The total kinetic energy in the turbulent flow over rough-
ness elements, 1
2 uiui , may be decomposed into three parts as
follows,
1
2
uiui =
1
2
ui ui +
1
2
uiui +
1
2
uiui (2)
4 Copyright c 2016 by ASME
5. (b) (c)
(f)(e)(d)
(a)
FIGURE 3. Profiles of double-averaged dispersive stress at various phases in a flow cycle for (a,b,c) gravel and (d,e,f) sand case. Symbols represent:
, streamwise dispersive stress u2 ; , spanwise dispersive stress v2 ; , wall-normal dispersive stress w2 ; , shear component of the dispersive
stress uw . All the terms are normalized by u2
τ,max. Panels show (a,d) acceleration, (b,e) peak and (c,f) deceleration phase. The dash-dot line at
(z−zb)/D = 0.3 in (a,b,c) and at 0.15 in (d,e,f) shows roughness crest level for the gravel and the sand particle, respectively.
where, terms on the right-hand side are, respectively, the
MKE, the WKE and the TKE.
Schematic representation illustrating various energy transfer
mechanisms and their pathways can be found in Fig. 8 from (9)
and is again presented here for the sake of completeness. As re-
ported by (14), conversion of MKE to the fine-scale TKE takes
places in two ways. In the first pathway, the energy goes through
the entire energy cascade process converting MKE to TKE and
subsequently into heat. In the second alternate pathway (shown
in Fig. 4 by dashed arrow), the work of mean flow against pres-
sure drag converts MKE to WKE, and WKE then generates TKE
of scales smaller than the roughness elements through a process
called ‘short-circuited’ energy cascade (2). Furthermore, as in-
dicated in Fig. 4, bi-directional interactions between TKE and
WKE can be explained as follows: eddies of all scales larger than
the roughness elements work against the pressure drag and lose
their TKE to WKE. At the same time, WKE generates TKE of
scales smaller than roughness elements through aforementioned
short-circuited energy cascade. Take a note that, physical pro-
cesses represented in this bi-directional exchange involve action
on the turbulent eddies rather than the mean flow.
The budget of TKE for the gravel case was reported in
(9) where important processes governing TKE–WKE interac-
tions were discussed. In addition, to further explain the phe-
nomenon of redistribution of energy among normal components
of Reynolds stresses and illustrate the relative importance of the
FIGURE 4. Schematic representation of energy transfer mechanisms
and their pathways. Dashed arrow path indicates short-circuited energy
cascade. Conversion of energy into heat is not illustrated.
various processes involved, budgets of normal Reynolds stresses
along with normal dispersive stresses are studied here. Based
on (1; 16; 8), double-averaged normal Reynolds stress budget
equation for flow over roughness with streamwise-spanwise ho-
mogeneity is given as,
5 Copyright c 2016 by ASME
6. ∂ uα uα
∂t
= −2 uα w
∂ uα
∂z
Ps
+
−2 uα uj
∂uα
∂xj
Pw
−2 uα uj
∂uα
∂xj
Pm
−
∂
∂z
uα uα w
Tt
−
∂
∂z
uα uα w
Tw
−
2
ρ
uα
∂ p
∂xα
Παα
+ν
∂2
∂z2
uα uα − εαα (3)
where, the eight terms on the right-hand side are, respec-
tively, shear production term, Ps, that represents the work of
double-averaged velocity against double-averaged shear; wake
production term, Pw, is the work of wake-induced velocity fluc-
tuations against the bed-induced shear. This term represents the
net exchange of energy between TKE and WKE; Pm is the work
of the bed-induced velocity fluctuations against double-averaged
shear; Tt is turbulent transport, Tw is the bed-induced turbulent
transport; Παα is the pressure work followed by seventh term of
viscous transport. The last term on the right εαα represents
viscous dissipation rate of u 2
α . Note that the terms Pm, Pw and
Tw arise as a result of spatial heterogeneity at roughness element
length scale.
Figure 5 shows variation of various terms in the budget equa-
tion of (a,d) streamwise, (b,e) spanwise and (c,f) wall-normal
components of Reynolds stress plotted at a peak phase. Here,
panels (a,b,c) show variation in the gravel and (d,e,f) present that
in the sand case. The results for gravel and sand case are pre-
sented only for the peak phase in a flow cycle. Similar trends
albeit with different maxima and minima are observed for rest of
the turbulent phases and details are avoided for brevity. Also note
that, the quantitative comparison of budget terms in the gravel
and the sand case is not reported here as the level of turbulence
at peak phase is different in both the cases. Nevertheless, trends
discussed here sufficiently elucidate near-bed turbulence charac-
teristics in both flow cases.
As the flow accelerates, standing vortices around the spheri-
cal particle begin to form in the streamwise direction; as a result,
shear layers start emanating from the upper hemisphere of the
particle causing peak in the shear production Ps,uu and viscous
dissipation εuu close to the roughness crest in both flow cases
as shown in Fig. 5 (a,d). Consistent with the TKE budget re-
ported in (9), there exists a negative peak in the wake production
term Pw,uu close to the roughness crest, indicating the conver-
sion of TKE to WKE. At this location, streamwise component
of the Reynolds stress, u 2 , contributes most to the TKE and is
typically associated with near-bed turbulent structures of length
scales larger than the roughness scale. These large-scale struc-
tures work against the pressure drag and lose their TKE to WKE,
resulting in the negative peak in Pw,uu. As expected, shear pro-
duction is almost zero in the budgets of v 2 and w 2 , with
the only non-negligible production term as the wake production.
In both gravel and sand case, Pw,vv shows positive peak below
the roughness crest indicating conversion of WKE to TKE. At
this location, turbulent scales associated with spanwise Reynolds
stress are smaller than the roughness size; therefore converting
WKE to TKE through short-circuited energy cascade. Wake pro-
duction in the budget of w 2 in negligible in comparison with
Pw,uu and Pw,vv for both flow cases. Another production term Pm
is slightly positive for both gravel and sand in the streamwise
Reynolds stress budget, however is negligible otherwise. In the
outer part of the roughness sublayer, all the terms except shear
production and dissipation decay to zero, establishing equilib-
rium outer layer where the rate of production balances the rate
of dissipation. Consistent with the gravel case (c.f. Fig. 8) from
(9), net wake production in the TKE budget for sand case (not
shown) also exhibits two peaks; positive below the roughness
crest and negative close to the crest; indicating transfer of energy
from WKE to TKE in the former and TKE to WKE in the latter.
Apart from production and dissipation, another important
term in the budget of normal Reynolds stress is the term of pres-
sure work. In both gravel and sand case, pressure work Π11 is al-
most equal to viscous dissipation and acts a dominant sink term
in the budget of u 2 . Conversely, Π22 and Π33 are typically
positive and serve as source terms in the balance of v 2 and
w 2 , respectively. Peak in Π22 is seen close to the crest in the
case of gravel particle and near the zero-displacement plane in
the case of sand particle as shown in Fig. 5 (b) and (e), respec-
tively. In both gravel and sand case, Π33 exhibits two positive
peaks; one is located below the roughness crest, while second is
above the crest. Magnitudes of these two peaks in the sand case
are almost same, however, for the gravel particle, peak in Π33 be-
low the roughness crest is almost two times higher than the one
above the crest. Presence of these peaks could be attributed to
the turbulence–wake interactions in the vicinity of the roughness
crest resulting in more enhanced intensification of wall-normal
fluctuations, along with increased p intensity resulting from sig-
nificant wake-related terms (the second and fourth term) in the
source of the p Poisson equation (24) given as,
∇2
p = −2
∂ ui
∂xj
∂uj
∂xi
−2
∂ui
∂xj
∂uj
∂xi
−
∂2
∂xi∂xj
(uiuj − uiuj )−
∂2uiuj
∂xi∂xj
(4)
6 Copyright c 2016 by ASME
7. (a)
loss gain
(b)
loss gain
(d)
(c)
loss gain loss gain
(e) (f)
loss gain
loss gain
FIGURE 5. Budget at a peak phase (ωt = 5π/10) of (a,d) streamwise u 2 ; (b,e) spanwise v 2 ; and (c,f) wall-normal w 2 component of Reynolds
stress. Symbols represent: •, Ps; , Pm; , Pw; , viscous dissipation; , pressure work. Only selected terms are plotted. Panels (a,b,c) are for the
gravel and (d,e,f) are for the sand case. All the terms are normalized by u4
τ,max/ν. The dash-dot line at (z−zb)/D = 0.3 in (a,b,c) and at 0.15 in (d,e,f)
shows roughness crest level for the gravel and the sand particle, respectively.
As foreshadowed earlier, the positive pressure work terms in both
flow cases indicate the tendency of roughness to redistribute en-
ergy from streamwise to spanwise and wall-normal fluctuations,
resulting in homogenization of the near-wall turbulence.
Following (1; 8), double-averaged dispersive Reynolds
stress budget equation for flow over roughness with streamwise-
spanwise homogeneity is given as,
∂ uα uα
∂t
= −2 uα w
∂ uα
∂z
Ps
+
2 uα uj
∂uα
∂xj
−Pw
+2 uα uj
∂uα
∂xj
−Pm
−
∂
∂z
uα uα w
Tt
−
∂
∂z
uα uα w
Tw
−
2
ρ
uα
∂ p
∂xα
Παα
+ν
∂2
∂z2
uα uα − εαα (5)
where, the eight terms on the right-hand side are, respec-
tively, shear production of WKE, Ps; wake production term, −Pw;
7 Copyright c 2016 by ASME
8. −Pm is the work of the bed-induced velocity fluctuations against
double-averaged shear; Tt is turbulent transport of WKE, Tw is
the transport due to wake; Παα is the pressure work followed
by seventh term of viscous transport and the last term of viscous
dissipation rate of u2
α . Note that the terms Pw and Pm appear
with opposite signs in the budgets of TKE and WKE.
Figure 6 shows variation of various terms in the budget equa-
tion of (a,d) streamwise, (b,e) spanwise and (c,f) wall-normal
components of dispersive Reynolds stress plotted at a peak phase.
Again, panels (a,b,c) show variation in the gravel and (d,e,f)
present that in the sand case. As expected, terms in the dispersive
budget equation are significant mostly near and below the crest of
gravel and sand particle. As shown in Fig. 6 (a,d), the shear pro-
duction term, Ps, representing the work of the mean flow against
the bed-induced stress is significant only for u2 and it peaks be-
low the roughness crest in both flow cases. Wake production of
the WKE (−Pw,uu) in the gravel case peaks close to the roughness
crest and is almost of the same magnitude as the shear produc-
tion term Ps,uu. On the other hand, interestingly, wake production
(−Pw,uu) in the sand case peaks close to the roughness, however,
exceeds the shear production term Ps,uu. This is presumably due
to elongated streamwise structures in the sand case resulting in
large amount of TKE being converted to WKE in comparison
to the production of WKE through Ps,uu. This suggest that the
process of short-circuited energy cascade is less dominant in the
sand case. Consistent with normal stress budget, pressure work
terms Π22 and Π33 in both flow cases are typically positive and
act as dominant sources below the roughness crest in the balance
of v2 and w2 , respectively.
3.5 Turbulence structure
To further understand the behavior of the near-bed turbu-
lence, large-scale aniostropy and its response to flow oscillations,
dimensionless parameters that represent flow structures in turbu-
lent shear flows are examined. As reported by (29), near-wall
structures that influence the anisotropy in the turbulent bound-
ary layer are primarily attributed to the effects of mean shear
rate. Therefore, to examine the effects of shear rate on the de-
velopment of near-bed anisotropy in the present flow cases, the
shear-rate parameter S∗ given as,
S∗
=
Sq2
2ε
, (6)
where, S = 2(SijSij)1/2 is the mean strain rate, Sij = (∂ ui /∂xj +
∂ uj /∂xi)/2 is the strain-rate tensor, q = uiuu
1/2 is a measure
of turbulent velocity scale and ε is the dissipation rate of TKE
is calculated. The shear-rate parameter S∗ signifies the ratio of
turbulent and the mean deformation time scale and quantifies the
importance of the mean shear against the shear of the turbulence
on the near-bed flow structures. Take a note that, S∗ ≈ 10 is
regarded as a lower threshold for observing near-bed horseshoe
structures (29). Figure 7 compares the shear-rate parameter S∗
in the gravel and sand case. To examine the effects of flow os-
cillations, variation at three phases in a flow cycle, i.e. acceler-
ation, peak and deceleration phase is plotted. As shown in Fig.
7 (a), the shear-rate parameter in the gravel case attains its maxi-
mum, S∗
max ≈ 12, at the gravel crest level and interestingly, does
not show any dependence on the flow oscillations. Further away
from the gravel crest, in agreement with the conclusions of (29),
S∗ is close to 5, which implies that elongated coherent structures
cannot form. Small difference in S∗ values in the inner and outer
layer highlights the incompetence of the mean shear to affect the
turbulent eddy shape and the Reynolds stress anisotropy in the
gravel case. In the case of sand-bed shown in Fig. 7 (b), S∗
peaks just above the particle crest and takes the maximum value
of 30 towards the end of an acceleration cycle at ωt = 4π/10,
eventually decreasing to S∗
max ≈ 12 later in the flow cycle. Con-
sistent with (29), S∗ attains the value between 4 to 5 in the outer
part of the roughness sublayer. Contrary to the gravel case, shear-
rate parameter for the sand particle shows some dependence on
the flow oscillations, especially in the vicinity of the roughness
crest. Large values of S∗ in the vicinity of the sand particle crest
indicate the existence of longer streamwise structures as also vi-
sualized in Fig. 1 (b). This also implies that the response time
of the turbulence in that region is typically higher, and its shape
is significantly modified by the stretching of the vortex elements
leading to the state of 1D turbulence on the Lumley’s triangle
(30).
Following (24), the ratio of turbulence time scale and that of
the bed-induced (wake) strain given by,
S∗
w =
Swq2
2ε
, (7)
where, wake strain Sw is approximated as u2 1/2/D is also plot-
ted in Fig. 8. Similar to S∗, the variation of S∗
w in the gravel case
reveals no dependence on the flow oscillations. As seen in Fig. 8
(a), maxima in the S∗
w are found just below the gravel crest with
overall values inside the roughness sublayer less than one. In the
sand case, S∗
w peaks much away from the particle crest showing
reduced dependence on the flow oscillations with overall values
of the order of one. These results indicate that the wake strain
rate is not sufficient to change the near-bed aniostropy in both
the flow cases.
In addition, the anisotropic nature of the near-bed structures
is also quantified by calculating energy-partition parameter (29)
given as,
8 Copyright c 2016 by ASME
9. (a)
loss gain
(b)
loss gain
(d)
(c)
loss gain loss gain
(e) (f)
loss
gainloss
gain
FIGURE 6. Budget at a peak phase (ωt = 5π/10) of (a,d) streamwise u2 ; (b,e) spanwise v2 ; and (c,f) wall-normal w2 component of dispersive
Reynolds stress. Symbols represent: •, Ps; , (−Pm); , (−Pw); , viscous dissipation; , pressure work. Only selected terms are plotted. Panels
(a,b,c) are for the gravel and (d,e,f) are for the sand case. All the terms are normalized by u4
τ,max/ν. The dash-dot line at (z−zb)/D = 0.3 in (a,b,c) and
at 0.15 in (d,e,f) shows roughness crest level for the gravel and the sand particle, respectively.
(a) (b)
FIGURE 7. Variation of the shear-rate parameter S∗ inside the roughness sublayer for (a) gravel and (b) sand case. Symbols represent variation at: •,
acceleration phase 4π/10; , peak phase (5π/10); , deceleration phase (6π/10). The dash-dot lines at (z−zb)/D = 0.3 in (a) and 0.15 in (b) show
roughness crest level for gravel and sand, respectively.
K∗
=
2u 2
v 2 +w 2
(8)
where, K∗ is a measure of high concentration of TKE in the
streamwise component of the normal Reynolds stress. Note that,
K∗ = 1 in the isotropic turbulence and according to (29), the near-
bed elongated streaks are known to exist when K∗ > 5.
Figure 9 (a) and (b) shows variation of K∗ inside the rough-
ness sublayer for gravel and sand particle, respectively. Consis-
tent with the earlier observations, K∗ in the gravel case shows no
9 Copyright c 2016 by ASME
10. (b)
(a)
FIGURE 8. Variation of S∗
w inside the roughness sublayer for (a) gravel and (b) sand case. Symbols are same as in Fig. 7.
(a) (b)
FIGURE 9. Variation of the energy-partition parameter K∗ inside the roughness sublayer for (a) gravel and (b) sand case. Symbols are same as in
Fig. 7.
differences for various phases in a flow cycle and takes values
of the order one. This indicates the absence of elongated streaky
structures and further corroborates the observation of near-bed
flow isotropization in the gravel case. Conversely, in the case
of sand particle, K∗
max ≈ 33 towards the end of an acceleration
cycle at ωt = 4π/10, eventually decreasing to K∗
max ≈ 10 at the
peak phase at ωt = 5π/10. This reduction in the value of K∗
max
with flow acceleration is attributed to the intensification of near-
bed bursting phenomenon at the peak phase, leading to enhanced
redistribution of the energy from streamwise to other two com-
ponents of the normal Reynolds stress. However, in comparison
to the gravel case, the extent of near-bed flow isotropization is
typically less for the sand-bed.
4 Conclusions
A numerical study of oscillatory turbulent flow over a bed of
closely packed spherical particles of diameter 375 (125) in wall
units, corresponding to the gravel (sand) particle, in a very rough
turbulent flow regime is carried out. Detailed characterization
of the near-bed turbulence by employing double averaging tech-
nique is reported.
It was shown that the rough-bed leads to a wake field that in
turn results in dispersive stresses in the vicinity of the particle-
bed. In the case of gravel, such bed-induced stresses were signif-
icant mostly in the region below the particle crest, while for the
sand case, their effect was seen to penetrate up to the distance of
2D above the particle-bed.
The spatial inhomogeneity at roughness length scale in-
troduced additional production and transport terms in double-
averaged Reynolds stress budget. In both flow cases, negative
peak in the wake production term Pw,uu is observed close to the
roughness crest and was attributed to the conversion of TKE to
WKE as a result of larger turbulent scales that are associated
with u 2 at this location. In addition, positive peak in the wake
production Pw,vv of spanwise component of the Reynolds stress
was observed close to the effective bed location, indicating the
conversion of WKE to TKE of scales smaller than roughness
length scale at this location. The pressure work term in the bud-
get of u 2 for both gravel and sand case remained negative and
worked as a dominant sink. On the other hand, intensified tur-
bulence–wake interactions led to positive pressure work in the
budgets of v 2 and w 2 , resulting in redistribution of energy
between components of Reynolds stresses. In both flow cases,
10 Copyright c 2016 by ASME
11. bed-induced transport term was found to be negligible.
For the grave-bed, amount of WKE converted from TKE
(through −Pw,uu) is of the same order as that received from MKE
(through Ps,uu). On the contrary, presence of elongated stream-
wise structures in the sand case resulted in augmentation of the
wake production term −Pw,uu that is larger compared to shear
production term Ps,uu. This therefore suggests that the process of
short-circuited energy cascade is less dominant in the sand case.
The large size of the gravel particles was seen to play an im-
portant role in forming and then breaking the streamwise struc-
tures, leading to isotropization of the near-bed flow; while in the
sand case, elongated horseshoe structures formed as a result of
high shear rate. Small values of the shear-rate parameter in the
gravel case highlights the incompetence of the mean shear to af-
fect the turbulent eddy shape and the Reynolds stress anisotropy.
Contrary to this, large shear-rate parameter in the sand case indi-
cated the importance of mean strain rate in modifying the shape
of the near-bed turbulence.
Variation of the normal components of the Reynolds stress
showed fraction of energy from streamwise component being
redistributed to other two components, more so for the gravel
case as that compared to the sand. As also evident from energy-
partition parameter, redistribution of energy in the gravel case
showed no dependence on the flow oscillations, while for the
sand particle it is more pronounced towards the end of an accel-
eration cycle.
Acknowledgments
This work is supported by the National Science Foundation
(NSF-CBET - 1133363). The computations were performed on
the Texas Advanced Computing Center’s Stampede machine.
REFERENCES
[1] Raupach, M., and Thom, A., 1981. “Turbulence in and
above plant canopies”. Annual Rev. Fluid Mech., 13,
pp. 97–129.
[2] Raupach, M., Antonia, R., and Rajagopalan, S., 1991.
“Rough-wall boundary layers”. Appl.Mech.Rev, 44, pp. 1–
25.
[3] Jim´enez, J., 2004. “Turbulent flow over rough walls”. An-
nual Rev. Fluid Mech., 36, pp. 173–196.
[4] Krogstad, P.-A., Antonia, R., and Browne, L., 1992. “Com-
parison between rough and smooth-wall turbulent boundary
layers”. J. Fluid Mech., 245, pp. 599–617.
[5] Krogstad, P.-A., and Antonia, R., 1994. “Stucture of turbu-
lent boundary layers on smooth and rough walls”. J. Fluid
Mech., 277, pp. 1–21.
[6] Krogstad, P.-A., Andersson, H., Bakken, O., and Ashrafin,
A., 2005. “An experimental and numerical study of channel
flow with rough walls”. J. Fluid Mech., 530, pp. 327–352.
[7] Ikeda, T., and Durbin, P., 2007. “Direct simulations of a
rough-wall channel flow”. J. Fluid Mech., 571, pp. 235–
263.
[8] Yuan, J., and Piomelli, U., 2014. “Roughness effects on the
Reynolds stress budgets in near-wall turbulence”. J. Fluid
Mech., 760.
[9] Ghodke, C., and Apte, S., 2016. “DNS study of particle-
bed–turbulence interactions in an oscillatory wall-bounded
flow”. J. Fluid Mech., 792, pp. 232–251.
[10] Ghodke, C., 2016. “DNS study of particle-bed–turbulence
interactions in oscillatory flows”. PhD thesis, Oregon State
University,USA.
[11] Ghodke, C., and Apte, S., 2016. “A numerical investiga-
tion of particle-bed–turbulence interactions in oscillatory
flows”. Proc. ICMF 9th International Conference on Mul-
tiphase Flow, Firenze, Italy.
[12] Ghodke, C., and Apte, S., 2017. “Roughness effects
on second-order turbulence statistics in oscillatory flows”.
Comp. Fluids, in revision.
[13] Raupach, M., and Shaw, R., 1982. “Averaging procedures
for flow within vegetation canopies”. Boundary-Layer Me-
teorol., 22, pp. 79–90.
[14] Finnigan, J., 2000. “Turbulence in plant canopies”. Annual
Rev. Fluid Mech., 32, pp. 519–571.
[15] Nikora, V., Goring, D., McEwan, I., and Griffiths, G., 2001.
“Spatially averaged open-channel flow over rough bed”.
J. Hydraulic Eng., 127, pp. 123–133.
[16] Mignot, E., Bartheleemy, E., and Hurther, D., 2009.
“Double-averaging analysis and local flow characteriza-
tion of near-bed turbulence in gravel-bed channel flows”.
J. Fluid Mech., 618, pp. 279–303.
[17] Dey, S., and Das, R., 2012. “Gravel-bed hydrodynam-
ics: double-averaging approach”. J. Hydraulic Eng., 138,
pp. 707–725.
[18] Coceal, O., Thomas, T. G., Castro, I. P., and Belcher, S. E.,
2006. “Mean flow and turbulence statistics over groups of
urban-like cubical obstacles”. Boundary-Layer Meteorol.,
121, pp. 491–519.
[19] Ghodke, C., and Apte, S., 2016. “Particle-resolved DNS
to study spatio-temporal correlations of hydrodynamic
forces on particle-bed in an oscillatory flow environment”.
Proc. ASME Fluids Engineering Summer Meeting, Wash-
ington DC, USA.
[20] Ghodke, C., Apte, S., and Urzay, J., 2014. “Direct nu-
merical simulations of oscillatory wall-bounded flow over a
closely-packed fixed bed of spherical particles”. Proc. Cen-
ter for Turbulence Research Summer Prog., pp. 47–55.
[21] Ghodke, C., Skitka, J., and Apte, S., 2014. “Characteriza-
tion of oscillatory boundary layer over a closely packed bed
of sediment particles”. J. Comput. Multiphase Flows, 6(4),
pp. 187–197.
[22] Ghodke, C., and Apte, S., 2014. “DNS of Oscillatory
11 Copyright c 2016 by ASME
12. Boundary Layer Over a Closely Packed Layer of Sediment
Particles”. Proc. ASME Fluids Engineering Summer Meet-
ing, Chicago, IL, USA.
[23] Cardillo, J., Chen, Y., Araya, G., Newman, J., Jansen, K.,
and Castillo, L., 2013. “DNS of a turbulent boundary layer
with surface roughness”. J. Fluid Mech., 729, pp. 603–637.
[24] Yuan, J., and Piomelli, U., 2015. “Numerical simulation
of a spatially developing accelerating boundary layer over
roughness”. J. Fluid Mech., 780, pp. 192–214.
[25] Apte, S., and Finn, J., 2013. “A variable-density ficti-
tious domain method for particulate flows with broad range
of particle-fluid density ratios”. J. Comput. Phys., 243,
pp. 109–129.
[26] Apte, S., Martin, M., and Patankar, N., 2008. “A numer-
ical method for fully resolved simulation (FRS) of rigid
particle-flow interactions in complex flows”. J. Comput.
Phys., 228(8), pp. 2712–2738.
[27] Keiller, D., and Sleath, J., 1976. “Velocity measurements
close to a rough plate oscillating in its own plane”. J. Fluid
Mech., 73(04), pp. 673–691.
[28] Jeong, J., and Hussain, F., 1995. “On the identification of a
vortex”. J. Fluid Mech., 285, pp. 69–94.
[29] Lee, M., Kim, J., and Moin, P., 1990. “Structure of turbu-
lence at high shear rate”. J. Fluid Mech., 216, pp. 561–583.
[30] Choi, K.and Lumley, J., 2001. “The return to isotropy of
homogeneous turbulence”. J. Fluid Mech., 436, pp. 59–
84.
12 Copyright c 2016 by ASME