Download to read offline
![Research Article
Effect of Bend Radius on Magnitude and Location of
Erosion in S-Bend
Quamrul H. Mazumder, Siwen Zhao, and Kawshik Ahmed
Department of Mechanical Engineering, University of Michigan-Flint, 303 East Kearsley Street, Flint, MI 48502, USA
Correspondence should be addressed to Quamrul H. Mazumder; qmazumde@umflint.edu
Received 28 October 2014; Revised 13 December 2014; Accepted 15 December 2014
Academic Editor: Dimitrios E. Manolakos
Copyright © 2015 Quamrul H. Mazumder et al. This is an open access article distributed under the Creative Commons Attribution
License, which permits unrestricted use, distribution, and reproduction in any medium, provided the original work is properly cited.
Solid particle erosion is a mechanical process that removes material by the impact of solid particles entrained in the flow. Erosion
is a leading cause of failure of oil and gas pipelines and fittings in fluid handling industries. Different approaches have been used to
control or minimize damage caused by erosion in particulated gas-solid or liquid-solid flows. S-bend geometry is widely used in
different fluid handling equipment that may be susceptible to erosion damage. The results of a computational fluid dynamic (CFD)
simulation of diluted gas-solid and liquid-solid flows in an S-bend are presented in this paper. In addition to particle impact velocity,
the bend radius may have significant influence on the magnitude and the location of erosion. CFD analysis was performed at three
different air velocities (15.24 m/s–45.72 m/s) and three different water velocities (0.1 m/s–10 m/s) with entrained solid particles. The
particle sizes used in the analysis range between 50 and 300 microns. Maximum erosion was observed in water with 10 m/s, 250-
micron particle size, and a ratio of 3.5. The location of maximum erosion was observed in water with 10 m/s, 300-micron particle
size, and a ratio of 3.5. Comparison of CFD results with available literature data showed reasonable and good agreement.
1. Introduction
Erosion due to particulated multiphase flow is a complex
phenomenon resulting in severe structural damage due to
wall thickness loss in high pressure pipelines and fluid
handling equipment. Erosive wear damage has been observed
in oil and gas pipelines, aircraft, cyclone separators, boilers,
fluidized beds, gas turbines, and coal gasification processes.
This type of damage was recognized as a leading problem
causing pipeline failure [1]. A number of different factors that
contribute to erosion include impact velocity, particle size and
shape, and mechanical properties of both the target material
and the solid particles [2]. Solid particle impact velocity was
recognized as the most significant factor influencing erosion
by researchers, and the erosion rate is proportional to the
exponent of the solid particle velocity or the fluid velocity
surrounding the particles [3]. The synergisms of these factors
make the erosion process difficult to manage and observe
in reality. However, the advancement of computational fluid
dynamics (CFD) provides an effective method to predict the
flow behavior that can aid in predicting erosion. CFD simula-
tions can provide an economical means of understanding the
complex fluid dynamics and how it is influenced by changes
in both design and operating conditions [4]. Engineers can
obtain real-scale geometry to model a 3D structure under
different conditions during CFD analysis. CFD can provide
data and valuable visualizations of what will happen in
real life when these conditions occur, which will become
important reference information applied to the design [5].
CFD models are based on Navier-Stokes equations which
include the first principles of mass, momentum, and energy
conservation [6]. The most generalized model for multiphase
flow is the Eulerian-Eulerian model, based on the principle of
interpenetrating continua. It also has ability for continuous-
dispersed and continuous-continuous systems where each
phase is controlled by the Navier-Stokes equations [6].
2. Background
Wang and Shirazi investigated the effect of elbows with
different radii on erosion and reported that the long radius
bend with 𝑟/𝐷 > 1.5 (where 𝑟 is the elbow curvature radius
and 𝐷 is the diameter of pipe) has smaller impingement
angles than short radius bend [7]. The study also reported
lower erosion when a long radius elbow is used compared to
Hindawi Publishing Corporation
Modelling and Simulation in Engineering
Volume 2015,Article ID 930497, 7 pages
http://dx.doi.org/10.1155/2015/930497](https://image.slidesharecdn.com/42cef4ab-2ad6-40fd-8fd2-de512b6d00a9-151120161100-lva1-app6891/75/930497-1-2048.jpg)
![2 Modelling and Simulation in Engineering
a standard elbow (𝑟/𝐷 = 1.5) for the same flow condition.
A mechanistic model was developed by Mazumder et al.
to predict erosion in elbows with multiphase flow (gas-
liquid-solid). The model was based on erosion equations and
numerical and experimental results and provides an adequate
understanding of the erosion behavior in multiphase annular
flow [8].
The solid particle impact angles also have great influence
on erosion. For the same material, the erosion caused by
an impact angle of 30∘
was significantly more than that
caused by an impact angle of 90∘
[9]. Several investigations
used computational methods to predict erosion behavior in
different geometries, different solid particles, and different
flow velocities and fluids [10–12]. For fluid handling system
designers and engineers, identification of the location of
maximum erosion is as equally important as the magnitude
of the erosion. Most of the available literature data showed
studies that identified the magnitude of erosion without
specifying the locations. A previous CFD study reported the
location of maximum erosion at 182∘
from inlet of a U-bend
at a 15.24 m/s air velocity and 50-micron particle size [13].
Three distinct regions, namely, the core, the layer of
peripheral flow, and the region of eddying flow, may be
distinguished in a pipe flow. The radius of curvature of
bend and Reynolds number are the leading parameters in
determining the strength of swirling flow [14]. The flow in
multiple bends is more complex than in single bends due to
the interaction of the flow dynamics within the two bends.
The effect of the bend sweep angle and Reynolds number
was studied by Niazmand and Jaghargh [15]. In S-bend or
some other multiphase bend, the sweep angles also have a
large influence on flow in addition to the diameter used in
determining the Reynolds number. The small sweep angle
was found to suppress the swirling structure in the second
bend while large angles could result in strong vortices in the
second bend that can diminish the intensity of vortices in the
first bend. Additionally, an adverse pressure gradient always
occurs upstream of the first bend outer wall of the S-bend. It
occurs at the transition of two bends along the second bend’s
outer wall and depends on the Reynolds number, sweep angle,
and curvature ratio. The effect of the ratio of curvature on
erosion in the bend was reported in previous studies [3, 16].
Although a number of studies were conducted to determine
the magnitude and location of erosion in pipes, they were
limited to a single velocity and particle size. The location
of maximum erosion in a bend at different velocities and
particle sizes is extremely important for understanding the
erosion behavior in multiphase flow. The maximum mass
transfer enhancement was found to increase as the bend
radius to diameter ratio (𝑟/𝐷) and decreased due to increase
in turbulence levels.
3. Current Work
Review of previous work in solid particle erosion was mainly
focused on the effect of particle size on magnitude and
location of maximum erosion at a constant ratio of bend
radius to pipe diameter. The effect of 𝑟/𝐷 ratio of different
bends on erosion was reported in one previous study by
Wang and Shirazi [7]. The current study was conducted to
understand the effect of 𝑟/𝐷 on magnitude and location of
erosion in S-bend geometry using CFD. A commercial CFD
code FLUENT was used to perform the analysis as presented
in the later sections.
4. Materials and Methods
4.1. CFD Approach and Analysis. Due to the advanced
development of computational resources and capabilities in
recent years, the computational fluid dynamics technique
has been recognized as a powerful and effective method to
predict and analyze erosion behavior. A set of fluid dynamic
balance equations, usually in Navier-Stokes formulation for
momentum balance, can be solved by CFD codes. The
FLUENT [17] code was used in this study which was adopted
to solve the balance equation set via domain discretization,
using a control volume approach to convert the balance
partial differential equations (PDEs) into algebraic equations
solved numerically [18].
The equation of motion for a discrete phase dispersed in
the continuous phase was solved by a discrete phase model
(DPM) option. This option adopts a Lagrangian frame of
coordinates and leads to the computation of the particle
trajectories. The force balance equation on the particle is
solved using the local continuous phase conditions:
𝑑V 𝑝
𝑑𝑡
= 𝐹 𝐷 (V 𝑓 − V 𝑝) + 𝑔
(𝜌𝑝 − 𝜌 𝑓)
𝜌𝑝
+ 𝐹𝑥, (1)
where V 𝑝 and V 𝑓 are the particle and fluid velocities, 𝜌𝑝
and 𝜌 𝑓 are the particle and fluid densities, respectively, 𝑔 is
the gravitational acceleration, 𝐹𝑥 is a term accounting for
additional forces, and 𝐹 𝐷(V 𝑝 − V 𝑓) is the drag force per unit
particle mass [1]:
𝐹 𝐷 =
18𝜇
𝜌𝑝 𝑑2
𝑝
+
𝐶 𝐷 𝑅𝑒
24
. (2)
The solid particle erosion rates at wall boundaries were
determined by the following equation:
𝑅erosion =
𝑁particles
∑
𝑝=1
𝑚 𝑝 𝐶 (𝑑 𝑝) 𝑓 (𝛼) V 𝑏(V)
𝐴face
, (3)
where 𝐶(𝑑 𝑝) is a function of particle diameter, 𝑓(𝛼) is a
function of impact angle, where 𝛼 is the impact angle of
the particle path with the wall face, V is the relative particle
velocity, 𝑏(V) is a function of relative particle velocity, and
𝐴face is the area of the cell face at the wall. 𝐶, 𝑓, and 𝑏 are
default values, which are 1.8𝐸 − 9, 1, and 0. 𝐶, 𝑓, and 𝑏
are defined as boundary conditions at the wall rather than
properties of the material; hence, the default values were not
updated to reflect the material being used. Appropriate values
of these functions were also specified for solid particles being
used and the impacting surface material. The erosion rates
were calculated with regard to loss material (area-time) or
kg/m2
-sec [1].](https://image.slidesharecdn.com/42cef4ab-2ad6-40fd-8fd2-de512b6d00a9-151120161100-lva1-app6891/75/930497-2-2048.jpg)
![Modelling and Simulation in Engineering 3
Table 1: Parameters used in CFD analysis.
Type of fluid Air Water
Fluid density (kg/m3
) 1.225 9982
Fluid viscosity (kg m−1
s−1
) 1.8 × 10⁻⁵
0.001003
CFD element type Tetrahedron
Number of elements 40,930,
Poisson’s ratio 0.30
Young’s modulus (N m−1
) 1 × 10⁷
Fluid inlet velocity (m/sec)
Air: 15.24, 30.48, and 45.72 m/s
Water: 0.1, 1.0, and 10.0 m/sec
Particle diameter (𝜇m) 50, 100, 150, 200, 250, and 300
Particle density (kg/m3
) Sand (1500)
Particle rate (kg/sec) 1.0
Ratio (𝑟/𝐷, 𝐷 = 12.7 mm) 1.5, 2.5, and 3.5
4.2. Turbulence Model. Turbulence plays an important role
in many chemical engineering processes. The standard 𝑘-𝜀
model is one of the most popular viscosity models based
on the Reynolds averaged Navier-Stokes (RANS) equations
[19]. The 𝑘-𝜀 model was used in this paper. A realizable 𝑘-𝜀
turbulence model is applied to calculate normal Reynolds
stresses and shear Reynolds stresses, and the equation is
written as follows [1]:
𝜕 (𝜌𝜀)
𝜕𝑡
+
𝜕 (𝜌𝑈𝑗 𝜀)
𝜕𝑥𝑗
=
𝜕
𝜕𝑥𝑗
[(𝜇 +
𝜇𝑡
𝜎𝜀
)
𝜕𝜀
𝜕𝑥𝑗
]
+ 𝜌𝐶1 𝑆𝜀 − 𝜌𝐶𝜀2
𝜀2
𝑘 + √(𝜇/𝜌)𝜀
.
(4)
The model constants are 𝐶𝜀2 = 1.9, 𝐴0 = 4.0, 𝜎𝑘 = 1.0, and
𝜎𝑘𝜀 = 1.2.
5. Geometry Detail
Three S-bends of 12.7 mm pipe diameter, 𝑟/𝐷 = 1.5, 𝑟/𝐷 =
2.5, and 𝑟/𝐷 = 3.5, with 50.8 mm of straight pipe sections
upstream and downstream of the bend were used in the CFD
analysis. An S-bend geometry with 𝑟/𝐷 ratio of 1.5 is shown
in Figure 1. As the core of the turbulent pipe flow is reasonably
uniform, the grid size in this region was relatively coarse.
For efficient discretization, the geometry of the fluids flow
area was divided into three parts: upstream, downstream, and
central parts. The meshed S-bend geometry with 𝑟/𝐷 ratio
of 1.5 is shown in Figure 2. The parameters used in the CFD
analysis are presented in Table 1.
6. Results and Discussion
CFD analyses were performed for the conditions listed in
Table 1 to determine the magnitude and location of maximum
erosion wear damage of the S-bend. As Figure 2 showed, the
bend closer to the inlet was defined as bend 1 and the bend
closer to the outlet was defined as bend 2. The location of
maximum erosion is shown as angles measured from the start
of the bend.
Inlet
Outlet
L
Max. erosion
bend 1
D
Max. erosion
bend 2
r
𝜃1
𝜃2
𝜃3
𝜃4
Figure 1: S-bend geometry with 𝑟/𝐷 = 1.5.
Inlet
Outlet
Figure 2: Meshed geometry with flow direction.
Maximum
erosion
Figure 3: Maximum erosion in S-bend with 𝑟/𝐷 = 1.5.
A CFD result of erosion at 15.24 m/s air velocity, 50-
micron particle size, and the ratio of 1.5 was shown in
Figure 3. Erosion was observed in both bend 1 and bend 2.
Furthermore, erosion was observed in two locations in bend
1 and two locations in bend 2. The location of maximum
erosion for this condition was 34.8 and 157 degrees in bend
1 and 46.5 and 150.1 degrees in bend 2.
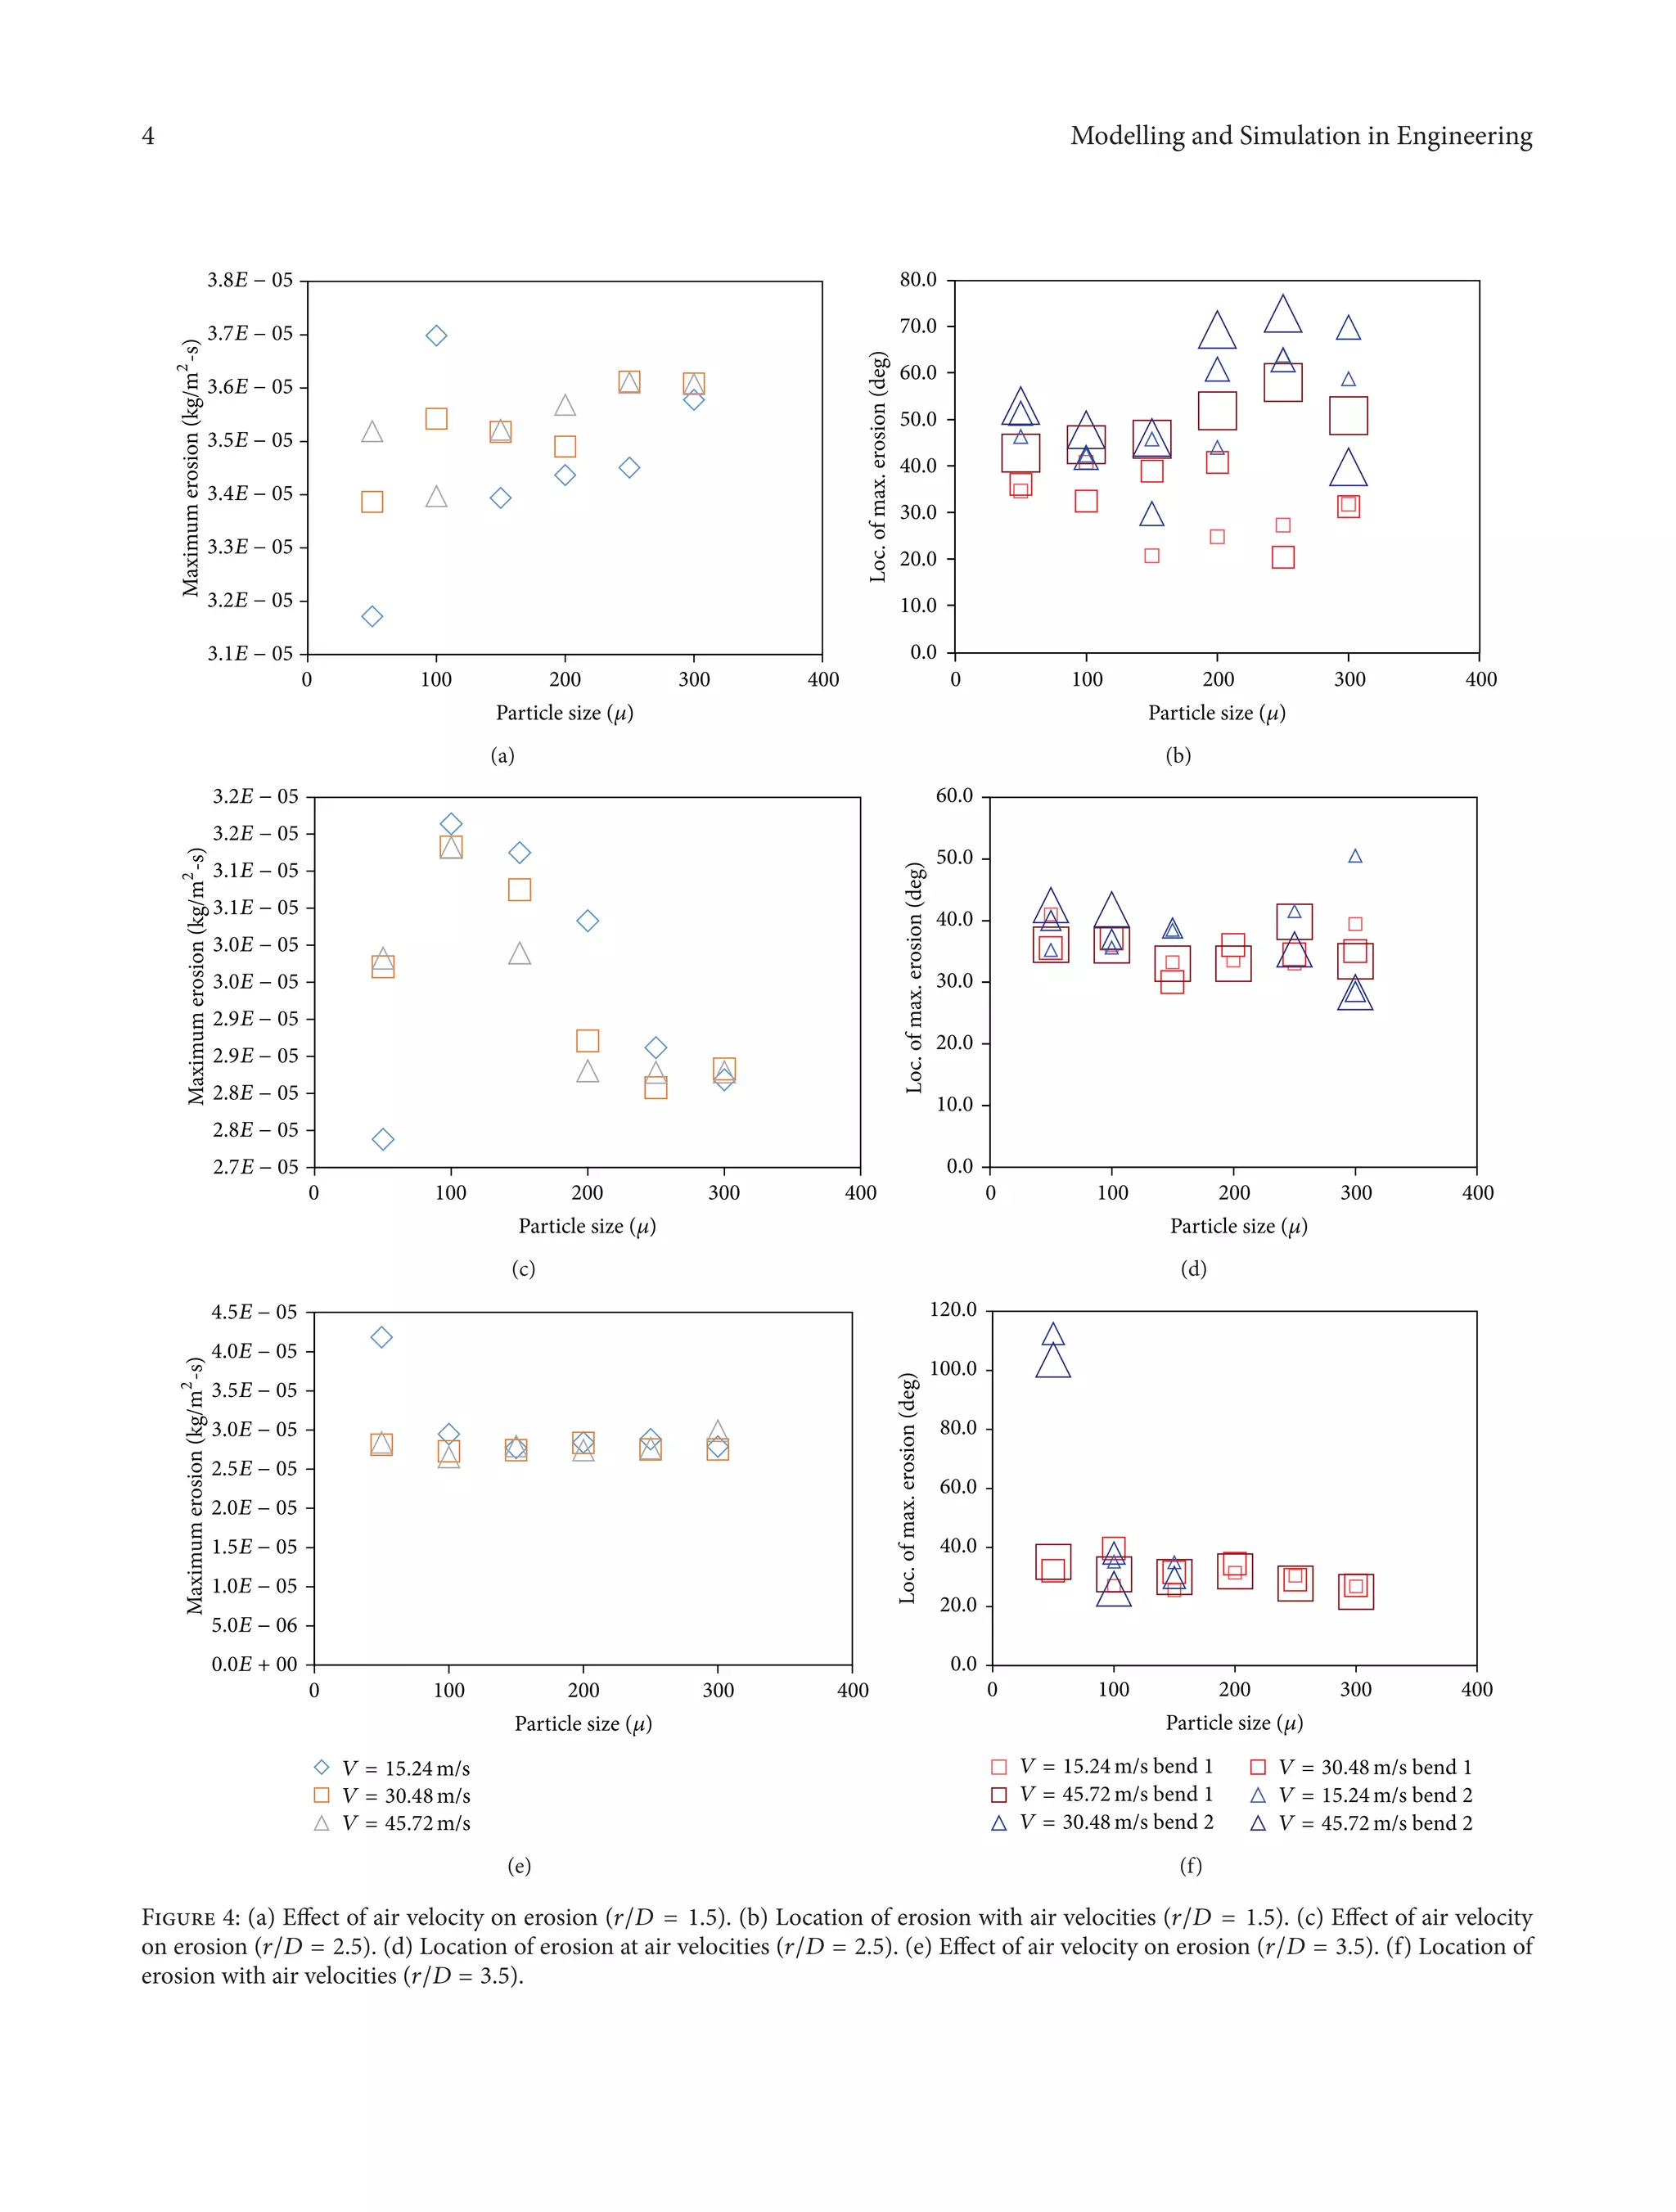
The effect of air velocities and particle sizes on erosion
with 𝑟/𝐷 = 1.5 is presented in Figures 4(a) and 4(b).
Maximum erosion was observed at 15.24 m/sec at 20–73
degrees, with 100-micron particles. No significant differences
in erosion were observed for particle sizes between 150 and
300 microns. Large amounts of erosion were observed in both
bends for some conditions. For example, with 200-micron
particle size, maximum erosions were observed at 25 degrees
in bend 1 and at 44.2 degrees in bend 2.
The effect of air velocities and particle sizes on an erosion
of ratio 2.5 is presented in Figures 4(c) and 4(d). Erosions
were observed in one location of the bend compared to
multiple locations observed in the bend with 𝑟/𝐷 = 1.5 for
all velocities and particle sizes. This validates the literature](https://image.slidesharecdn.com/42cef4ab-2ad6-40fd-8fd2-de512b6d00a9-151120161100-lva1-app6891/75/930497-3-2048.jpg)
![Modelling and Simulation in Engineering 5
Table 2: Comparison of available literature data.
Ref./geometry Fluid/particle size Fluid velocity Amount of erosion Location of max. erosion
Mazumder 2012 [13]: CFD
(U-bend)
Air (50–300 microns) 15.24 m/s, 30.48 m/s, and 45.72 m/s N/A 40∘
–182∘
Water (50–300 microns) 15.24 m/s, 30.48 m/s, and 45.72 m/s N/A 60∘
–155∘
Wang and Shirazi 2003 [7]:
CFD (elbow)
Air (100–350 microns) 50 m/s N/A 30∘
–40∘
Suhane and Agarwal 2012
[20]: experiment
Air (106–125 microns) 18.23 m/s Mass loss 99.6 g 24∘
–32∘
Mills and Mason 1977 [21]:
experiment (elbow)
Air (70 and 230 microns)
26 m/s 44 g mass loss
32∘
, 38∘
32 m/s 115 g mass loss
Fan et al. 2001 [10]:
experiment (elbow)
Gas 41.2 m/s N/A 20∘
–30∘
El-Behery et al. 2010 [22]:
CFD (curved duct)
Gas (100 microns) 10 m/s, 20 m/s, and 30 m/s
N/A 15∘
–70∘
N/A 10∘
–140∘
Table 3: Results of CFD and experimental investigations.
Ref./geometry Fluid/particle size Fluid velocity Amount of erosion
Location of max.
erosion
Mazumder [current work]:
CFD (S-bend)
Air (300 microns)
15.24 m/s,
30.48 m/s, and
45.72 m/s
3.57𝐸 − 5
3.61𝐸 − 5
3.61𝐸 − 5
32∘
, 153∘
32∘
, 151∘
41∘
, 147∘
Air (150 microns)
15.24 m/s,
30.48 m/s, and
45.72 m/s
3.39𝐸 − 5
3.52𝐸 − 5
3.52𝐸 − 5
21∘
, 148∘
39∘
, 151∘
46∘
, 142∘
Mazumder [current work]:
experiment (S-bend)
Air (300 microns)
15.24 m/s,
30.48 m/s, and
45.72 m/s
N/A
27∘
32∘
44∘
Air (150 microns)
15.24 m/s,
30.48 m/s, and
45.72 m/s
N/A
27∘
42.5∘
41∘
reported data indicating a reduction of erosion by using a
larger radius elbow geometry. The effect of air velocities and
particle sizes on erosion of ratio 3.5 is presented in Figures
4(e) and 4(f). The magnitude and location of erosions were
somewhat similar to the previous bend with 𝑟/𝐷 = 2.5.
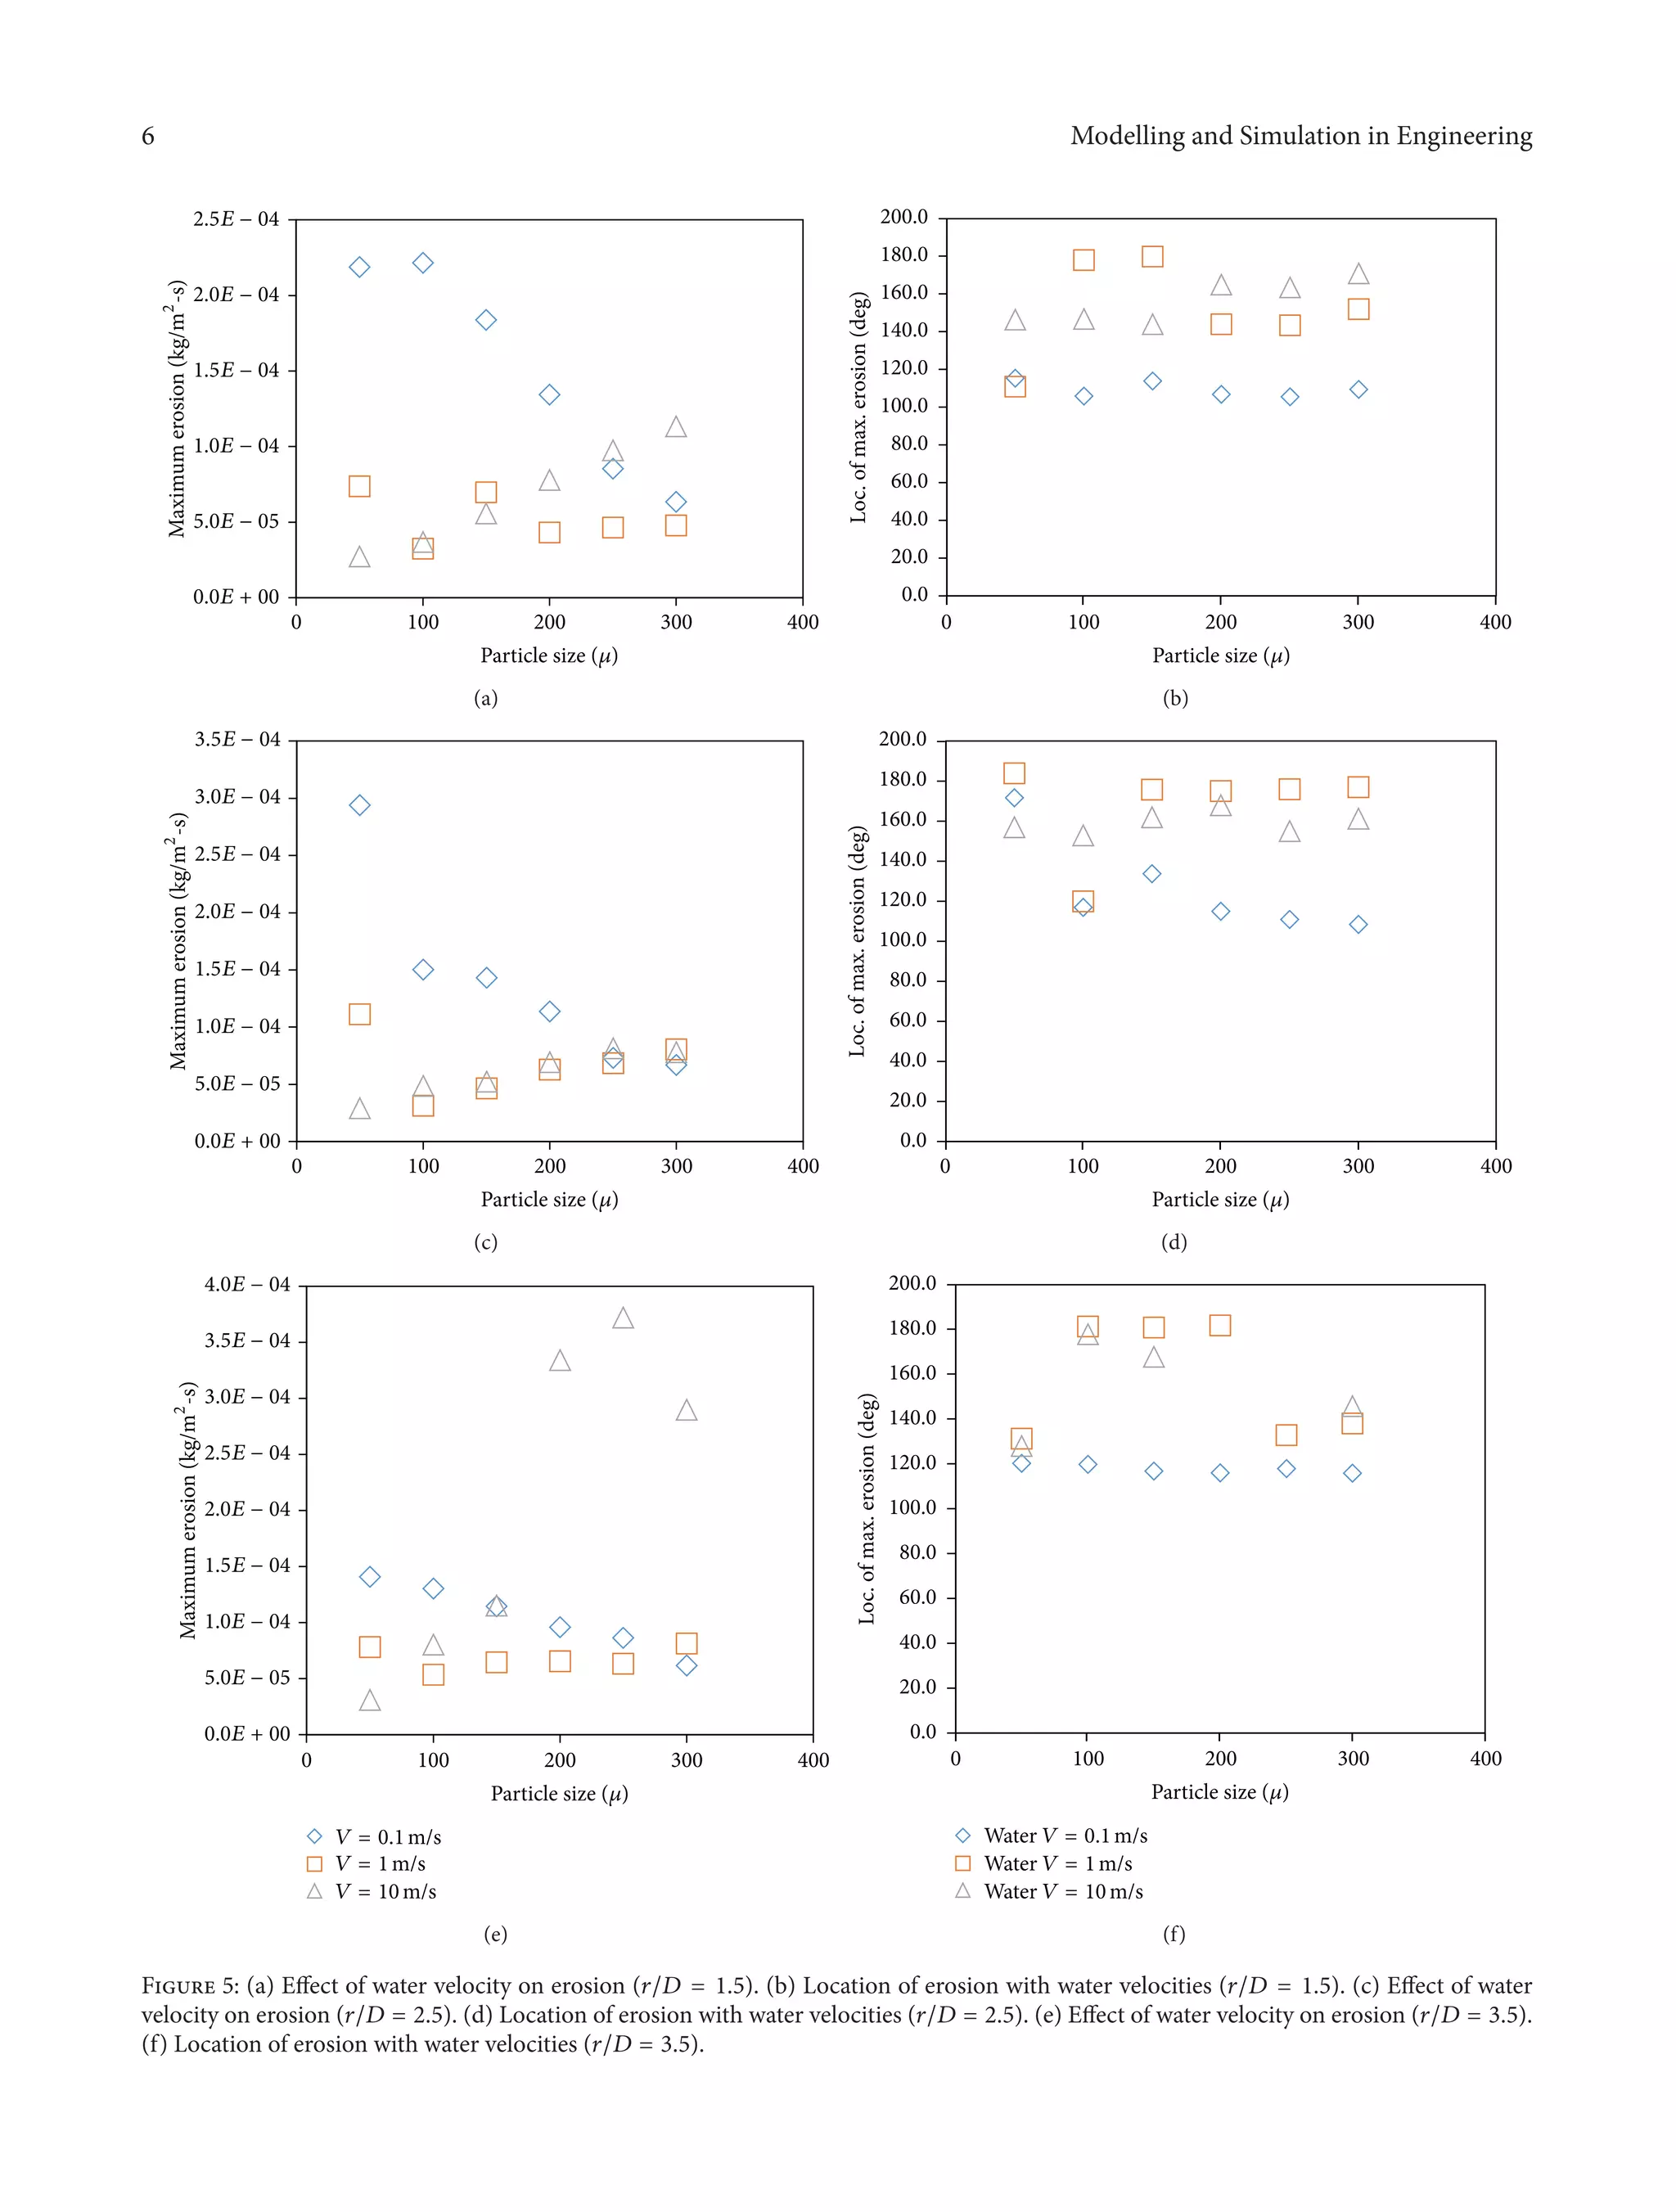
The effect of water velocities and particle sizes on mag-
nitude and locations of maximum erosion with 𝑟/𝐷 = 1.5
is presented in Figures 5(a) and 5(b). Maximum erosion was
observed at 105.5 degrees with 0.1 m/s air velocity and 50-
micron sand size. Erosion at 0.1 m/sec was 3 times more
than erosion at 1 m/sec and 8 times more than at 10 m/sec.
Location of erosion for water was further downstream of the
radius of the bend compared to air. For example, location of
maximum erosion with water was 105.5 degrees compared to
20–73 degrees with air.
The effect of water velocities and particle sizes on magni-
tude and location of erosion with 𝑟/𝐷 ratio of 2.5 is presented
in Figures 5(c) and 5(d). Maximum erosion was at 0.1 m/s
with 50-micron sand size which is 2.6 times higher than at
1 m/sec and 10 times higher than at 10 m/s. No significant
difference in erosion was observed with water velocities of
1 m/sec and 10 m/sec.
The effect of water velocity and particle size on maximum
erosion with 𝑟/𝐷 ratio of 3.5 is shown in Figures 5(e) and
5(f). Maximum erosion was observed at 106–120 degrees with
0.1 m/s and 250-micron particles. The maximum erosion at
0.1 m/sec was 4.3 times higher than that at 1 m/s and 5.9 times
higher than that at 10 m/s. No erosion was observed in bend
1 at 10 m/s for 200 and 250 microns.
A comparison of literature reported erosion results is
presented in Table 2. Due to limited availability of erosion
results for S-bend geometry, data presented in Table 2 are
for different types of bends including elbows, U-bends, and
ducts. Mazumder [13] investigated the location of maximum
erosion in U-bends with three different air and water veloc-
ities. Maximum erosion was observed at 182 degrees from
inlet at 15.24 m/sec with 300-micron particle size. Suhane and
Agarwal [20] reported experimental results of erosion in 51
and 102 mm diameter bends in a 40-meter-long test loop. At
18.23 m/sec air velocity maximum mass loss was 99.6 grams
in the 51 mm bend at a 24-degree impact angle.
The results of current CFD and experimental investi-
gations are presented in Table 3. The experimental results
showed a good agreement with CFD results. For example, at
45.72 m/s air velocity with 300 microns, CFD results showed
the location of maximum erosion was 41∘
and 147.2∘
in
bend 1. For the above condition, experimental results showed
location of maximum erosion at 44 degrees.](https://image.slidesharecdn.com/42cef4ab-2ad6-40fd-8fd2-de512b6d00a9-151120161100-lva1-app6891/75/930497-5-2048.jpg)
![Modelling and Simulation in Engineering 7
7. Conclusions
CFD-based erosion prediction for S-bend geometry of 12.7-
millimeter diameter with three different 𝑟/𝐷 (1.5, 2.5, and 3.5)
is presented in this paper. CFD simulations were performed
using a comprehensive procedure that included flow simu-
lation, particle tracking, and erosion calculation. Three dif-
ferent air and water velocities with six different particle sizes
ranging from 50 to 300 microns were used in the simulation.
Experimental investigations were conducted with an S-bend
with 𝑟/𝐷 = 1.5 and for three different air velocities of 15.24,
30.48, and 45.72 m/sec with two different particle sizes of 150
and 300 microns. The CFD and experimental results were
compared with available literature results showing reasonably
good agreements. CFD simulation results presented in this
paper will shed some light on the importance of location of
maximum erosion in S-bend geometry. The study presented
in this paper will provide better understanding of the relative
magnitude and location of erosion in S-bend geometry.
Conflict of Interests
The authors declare that there is no conflict of interests
regarding the publication of this paper.
Acknowledgments
The authors would like to thank the Office of Research at the
University of Michigan-Flint for financial support. The work
presented was supported by Research Grant no. U042784.
Kawshik Ahmed also provided support in the CFD analysis
presented in the paper.
References
[1] Q. H. Mazumder, “Effect of particle size on magnitude and
location of maximum erosion in S-bend,” in Proceedings of the
ASME 2014 Fluids Engineering Summer Meeting (FEDSM ’14),
FEDSM2014-2127, Chicago, Ill, USA, August 2014.
[2] Q. Chen and D. Y. Li, “Computer simulation of solid particle
erosion,” Wear, vol. 254, no. 3-4, pp. 203–210, 2003.
[3] I. Dorina, “Reduction of pipe wall erosion by creating a vortex
flow in anthracite powder pneumatic transport for power
plants,” in Proceedings of the International Conference on Renew-
able Energies and Power Quality, European Association for the
Development of Renewable Energies, Environment and Power
Quality, March 2012.
[4] S. Bernardo, M. Mori, A. P. Peres, and R. P. Dion´ısio, “3-D
computational fluid dynamics for gas and gas-particle flows in a
cyclone with different inlet section angles,” Powder Technology,
vol. 162, no. 3, pp. 190–200, 2006.
[5] C. Knatz, “Modeling with CFD,” Public Works, vol. 136, no. 3,
pp. 50–55, 2005.
[6] A. Sharifi and A. Mohebbi, “A combined CFD modeling with
population balance equation to predict pressure drop in venturi
scrubbers,” Research on Chemical Intermediates, vol. 40, no. 3,
pp. 1021–1042, 2014.
[7] J. Wang and S. A. Shirazi, “A CFD based correlation for erosion
factor for long-radius elbows and bends,” Journal of Energy
Resources Technology, Transactions of the ASME, vol. 125, no. 1,
pp. 26–34, 2003.
[8] Q. H. Mazumder, S. A. Shirazi, and B. S. McLaury, “Prediction
of solid particle erosive wear of elbows in multiphase annular
flow-model development and experimental validation,” Journal
of Energy Resources Technology, vol. 130, no. 2, Article ID 023001,
10 pages, 2008.
[9] Q. Chen and D. Y. Li, “Computer simulation of solid particle
erosion,” Wear, vol. 254, no. 3-4, pp. 203–210, 2003.
[10] J. Fan, J. Yao, X. Zhang, and K. Cen, “Experimental and
numerical investigation of a new method for protecting bends
from erosion in gas-particle flows,” Wear, vol. 251, no. 1, pp. 853–
860, 2001.
[11] I. Finnie, “Erosion of surfaces by solid particles,” Wear, vol. 3,
no. 2, pp. 87–103, 1960.
[12] P. Rudolfa and M. Desov´aa, “Flow characteristics of curved
ducts,” Applied and Computational Mechanica, vol. 1, pp. 255–
264, 2007.
[13] Q. H. Mazumder, “Effect of liquid and gas velocities on
magnitude and location of maximum erosion in U-bend,” Open
Journal of Fluid Dynamics, vol. 2, no. 2, pp. 29–34, 2012.
[14] J. R. Weske, Experimental Investigation of Velocity Distribu-
tions Downstream of Single Dust Bends, No. NACA-TN-1471,
National Aeronautics and Space Administration, Washington,
DC, USA, 1948.
[15] H. Niazmand and E. R. Jaghargh, “Bend sweep angle and
reynolds number effects on hemodynamics of S-shaped arter-
ies,” Annals of Biomedical Engineering, vol. 38, no. 9, pp. 2817–
2828, 2010.
[16] K. Sudo, M. Sumida, and H. Hibara, “Experimental investiga-
tion on turbulent flow in a circular-sectioned 90-degree bend,”
Experiments in Fluids, vol. 25, no. 1, pp. 42–49, 1998.
[17] I. Fluent, “Fluent 14.5 user guide,” Tech. Rep. NH-03766, Fluent
Inc., 2002.
[18] B. Bozzini, M. E. Ricotti, M. Boniardi, and C. Mele, “Evaluation
of erosion-corrosion in multiphase flow via CFD and experi-
mental analysis,” Wear, vol. 255, no. 1–6, pp. 237–245, 2003.
[19] D. Kuzmin, O. Mierka, and S. Turek, “On the implementation
of the 𝜅-𝜀 turbulence model in incompressible flow solvers
based on a finite element discretisation,” International Journal
of Computing Science and Mathematics, vol. 1, no. 2–4, pp. 193–
206, 2007.
[20] A. Suhane and V. K. Agarwal, “Effect of bend geometry
on erosion and product degradation in pneumatic conveying
pipeline systems,” International Journal of Engineering Research
and Applications, vol. 2, no. 4, pp. 129–136, 2012.
[21] D. Mills and J. S. Mason, “Particle size effects in bend erosion,”
Wear, vol. 44, no. 2, pp. 311–328, 1977.
[22] S. M. El-Behery, M. H. Hamed, K. A. Ibrahim, and M. A.
El-Kadi, “CFD evaluation of solid particles erosion in curved
ducts,” Journal of Fluids Engineering, vol. 132, no. 7, Article ID
071303, 2010.](https://image.slidesharecdn.com/42cef4ab-2ad6-40fd-8fd2-de512b6d00a9-151120161100-lva1-app6891/75/930497-7-2048.jpg)


This computational fluid dynamics study used simulations to analyze the effect of bend radius on erosion magnitude and location in an S-bend pipe carrying gas-solid or liquid-solid flows. Simulations were run for air velocities of 15.24-45.72 m/s and water velocities of 0.1-10 m/s, with particle sizes of 50-300 microns and bend radius to pipe diameter ratios (r/D) of 1.5, 2.5, and 3.5. Maximum erosion was found at certain velocity-particle size combinations and occurred at specific angle locations within each bend. The simulations aim to provide insight on erosion behavior to inform pipe design and operating conditions.