Downloaded 135 times

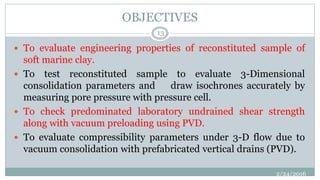
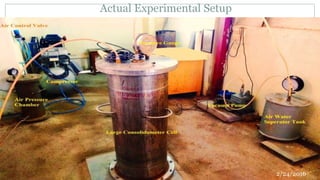
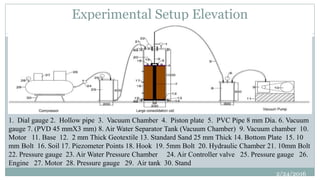
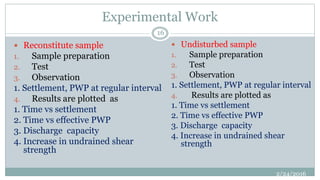
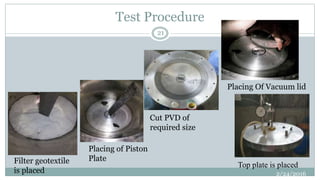
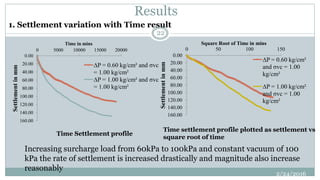
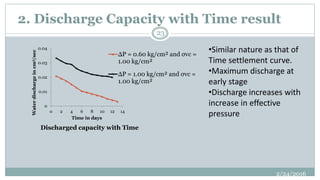
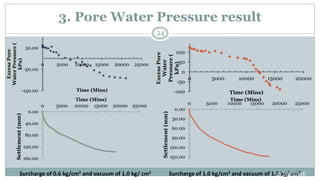
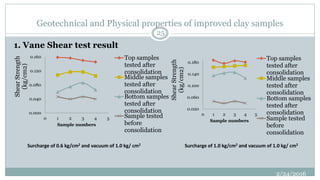
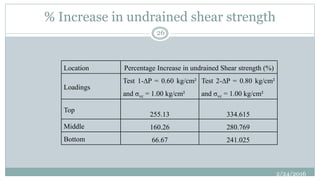
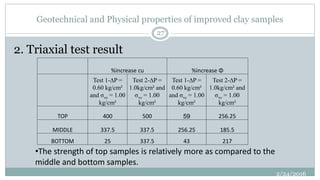
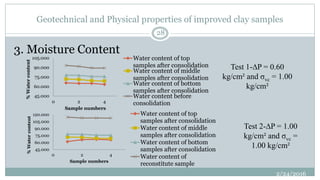


This presentation focuses on a 3-dimensional consolidation test on soft marine clay under vacuum preloading with prefabricated vertical drains (PVD). It outlines the challenges of constructing on soft marine clay, the developments in vertical drain theory, and compares conventional and vacuum preloading systems. The study aims to evaluate the engineering properties and consolidation behaviors of the clay, presenting methods, experimental setups, and key findings related to settlement and shear strength improvements.


![Geotechnical Engineering-I [Lec #27: Flow Nets]](https://cdn.slidesharecdn.com/ss_thumbnails/27-180924141458-thumbnail.jpg?width=640&height=640&fit=bounds)


![Geotechnical Engineering-I [Lec #17: Consolidation]](https://cdn.slidesharecdn.com/ss_thumbnails/17-180924140731-thumbnail.jpg?width=640&height=640&fit=bounds)


