Download to read offline


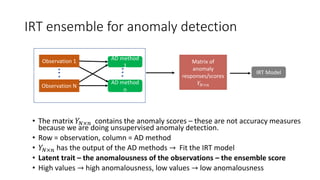
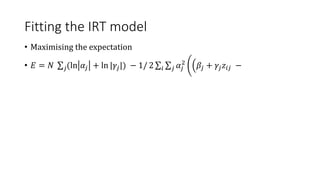
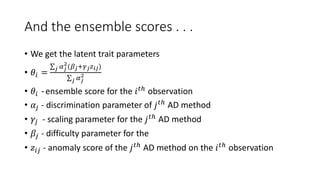
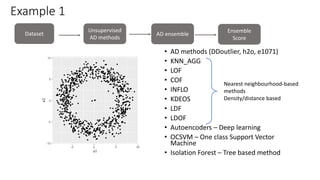
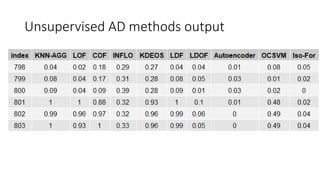
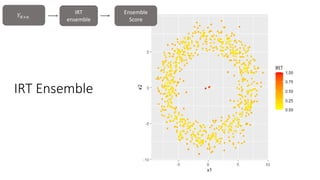

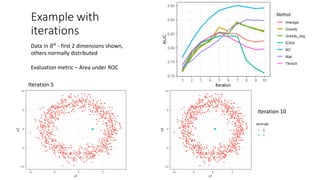
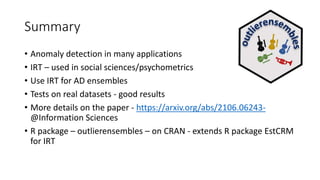


The document discusses improving anomaly detection through ensembles and Item Response Theory (IRT), highlighting its applications in areas like fraud detection and social sciences. It explains the process of fitting IRT models to unsupervised anomaly detection methods, yielding a score representing the anomaly levels of observations. The paper presents results indicating the effectiveness of IRT-based ensembles for detecting anomalies in real datasets.