Download to read offline
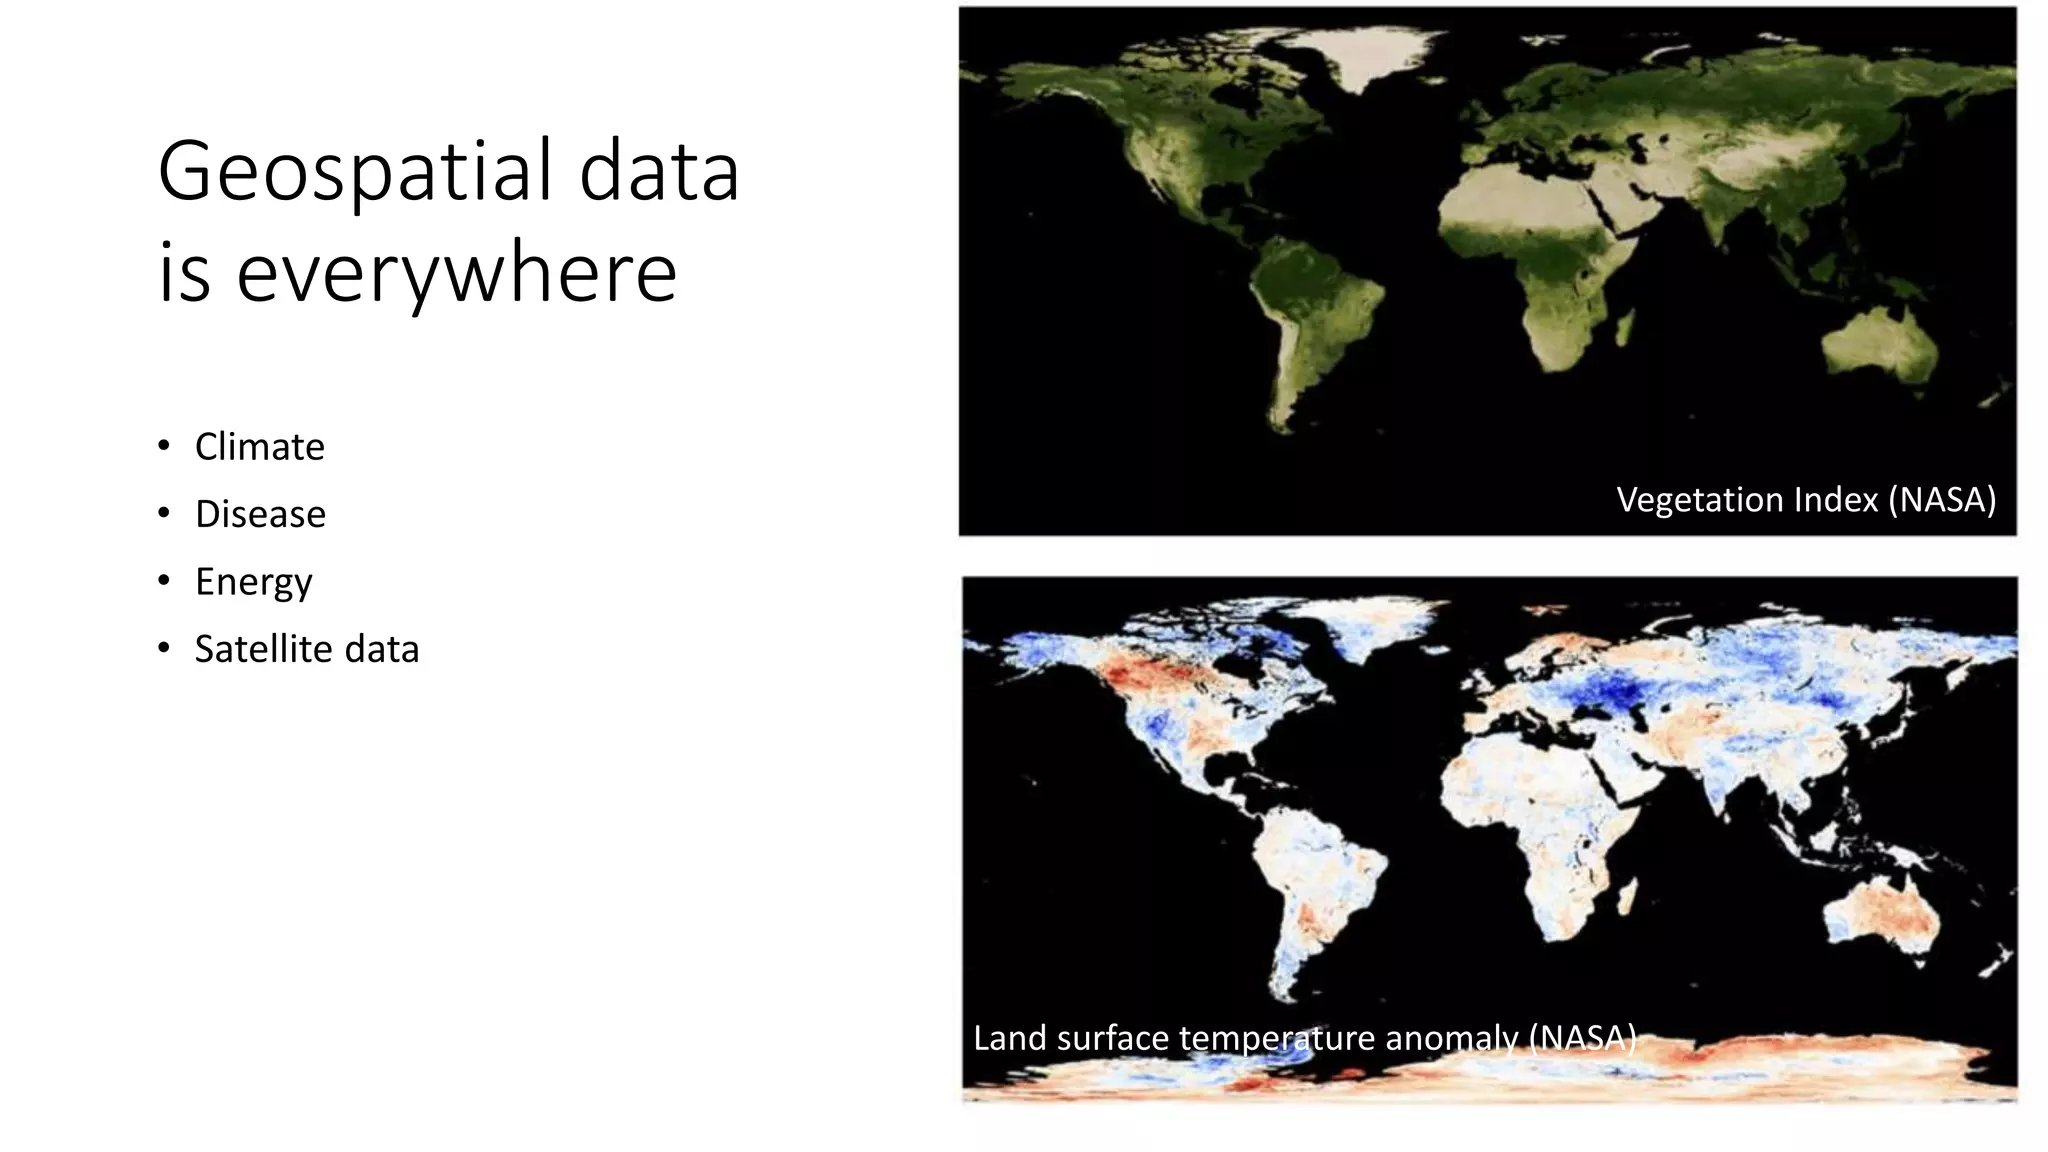
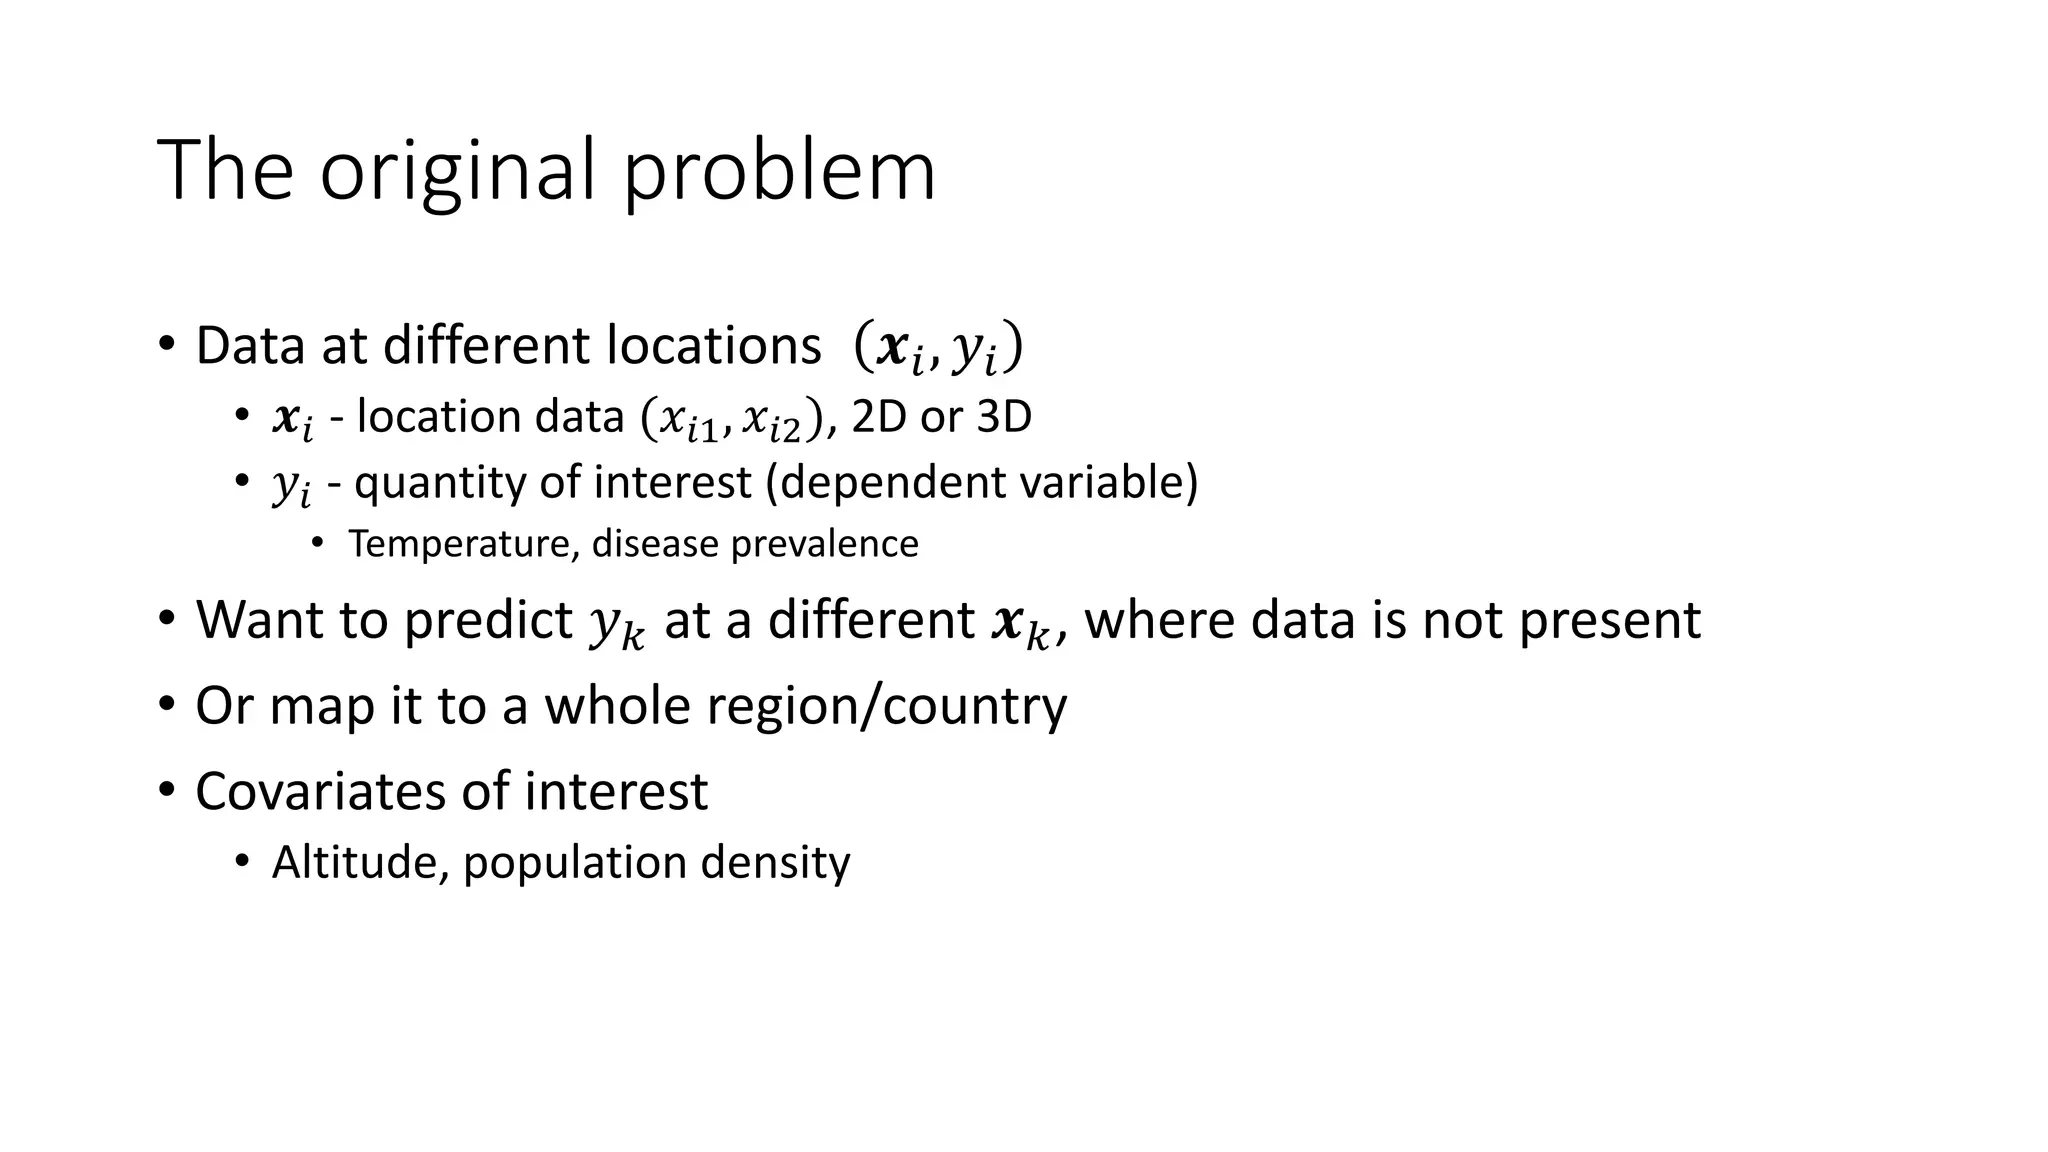

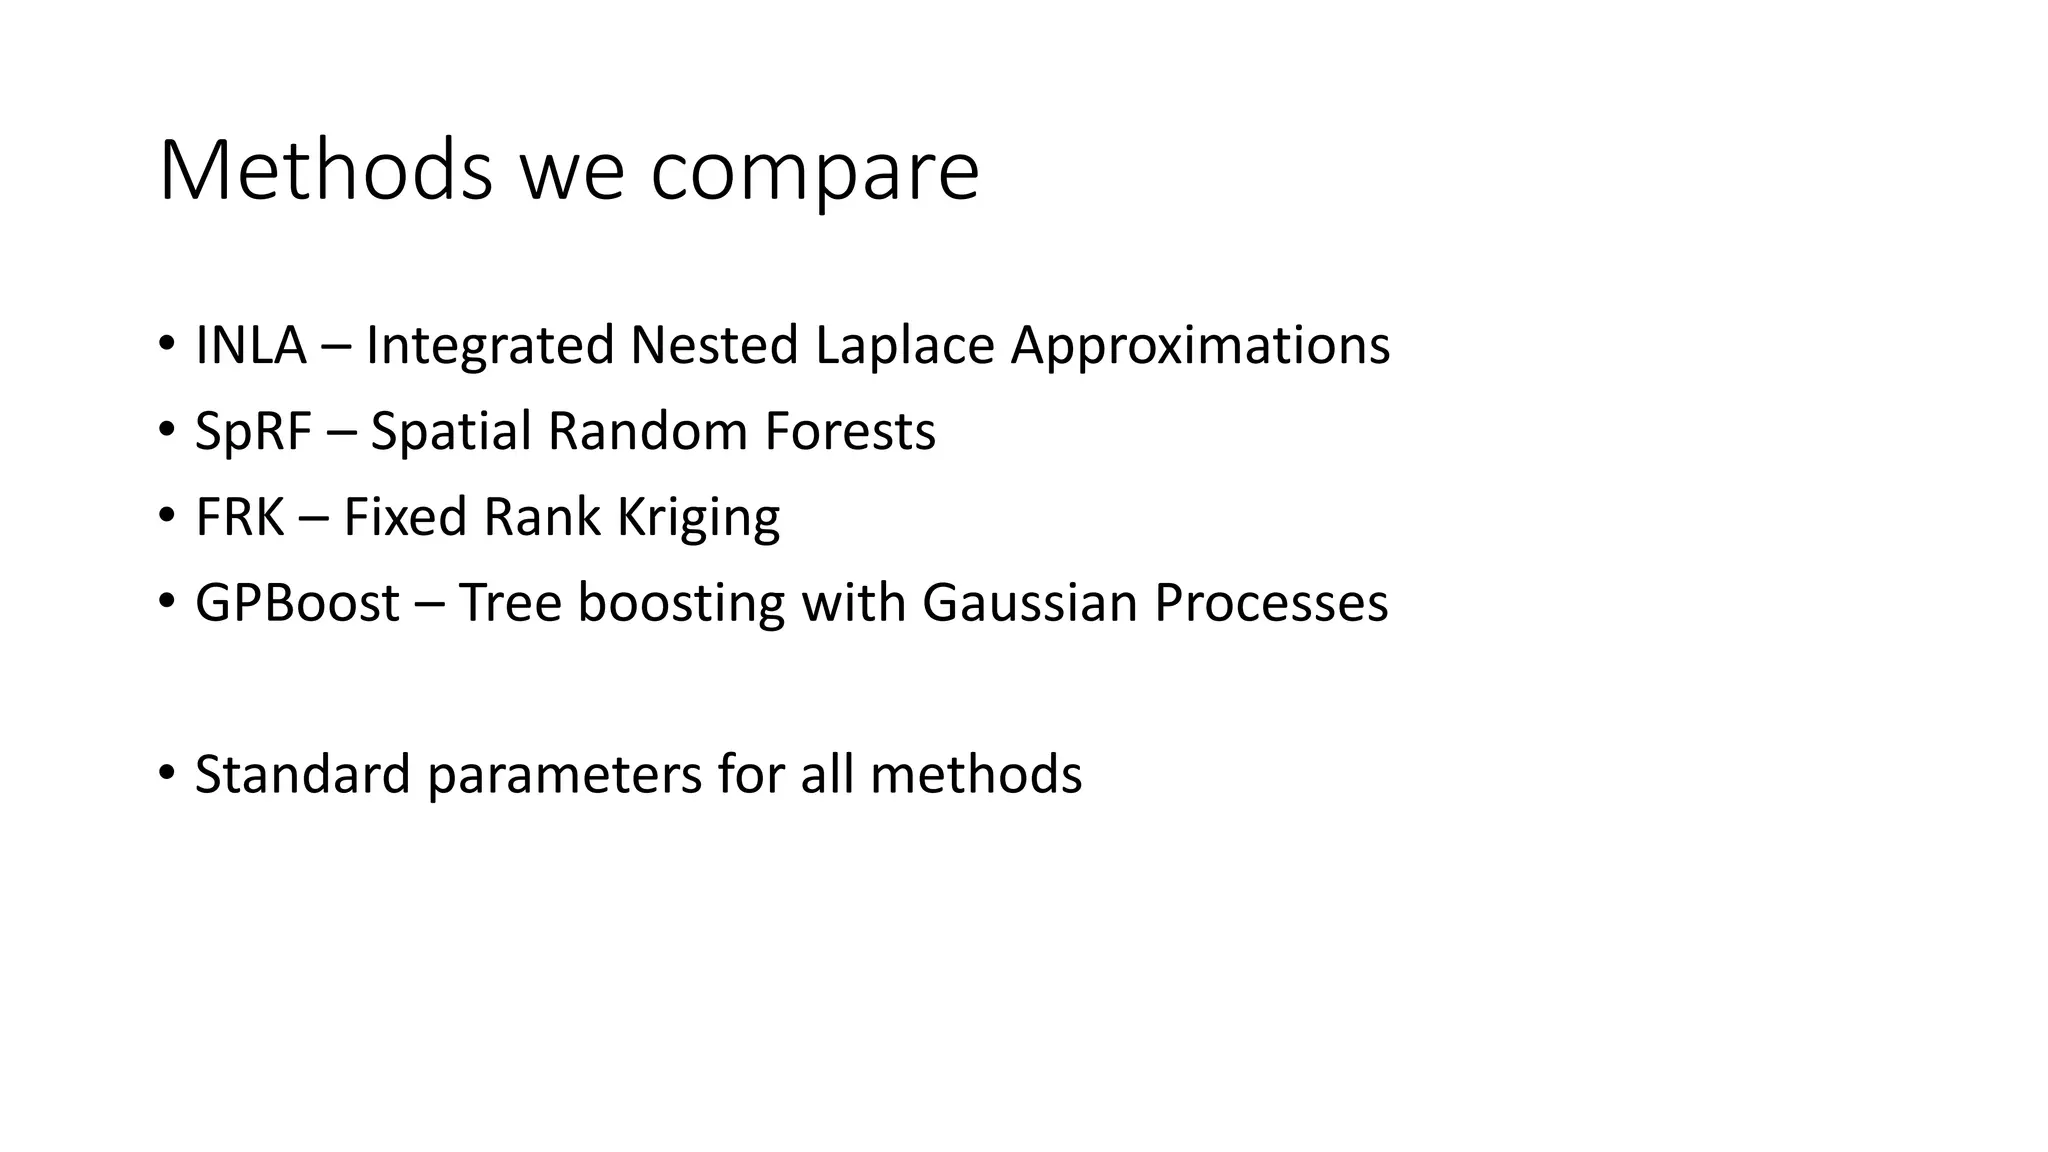
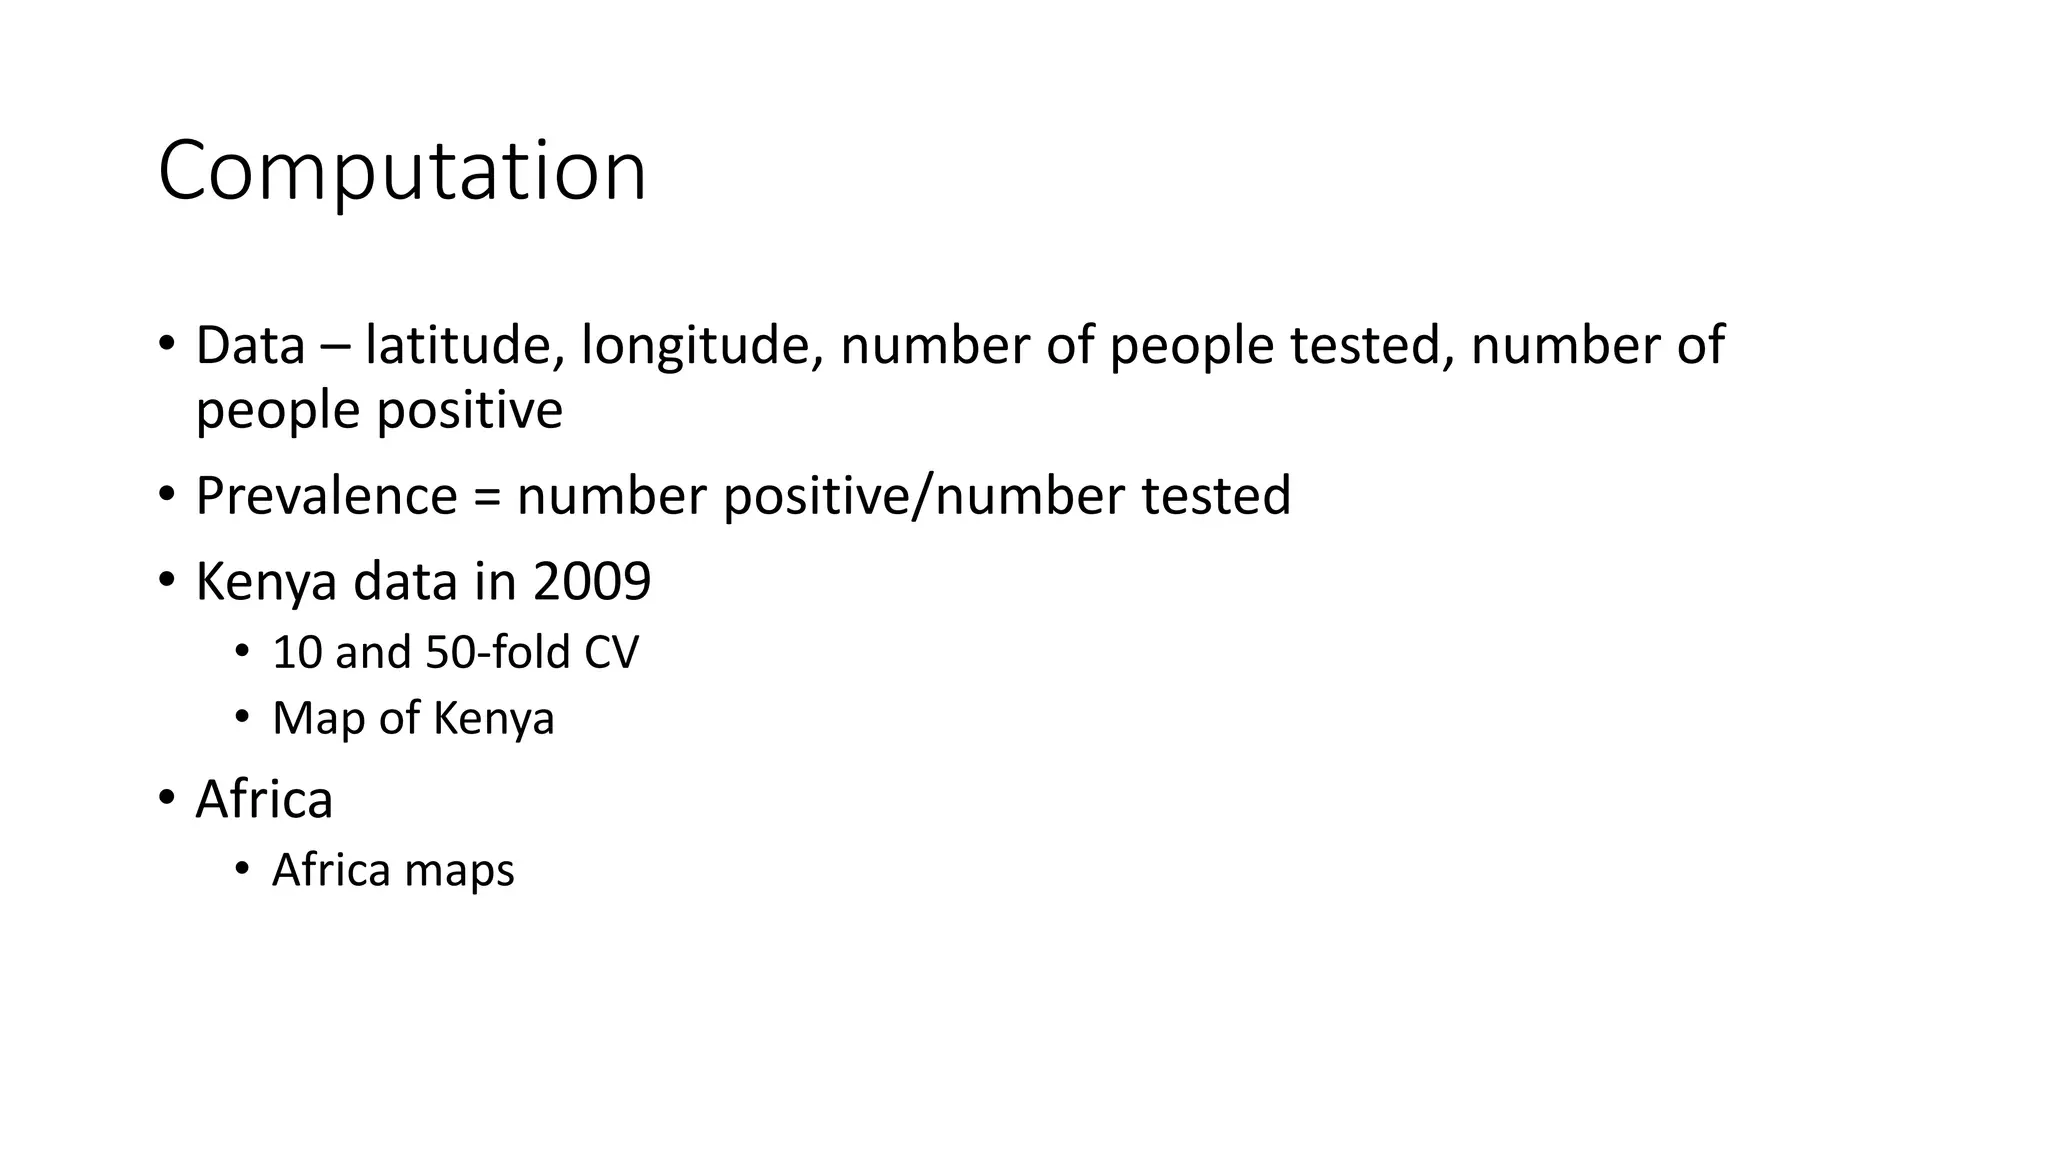

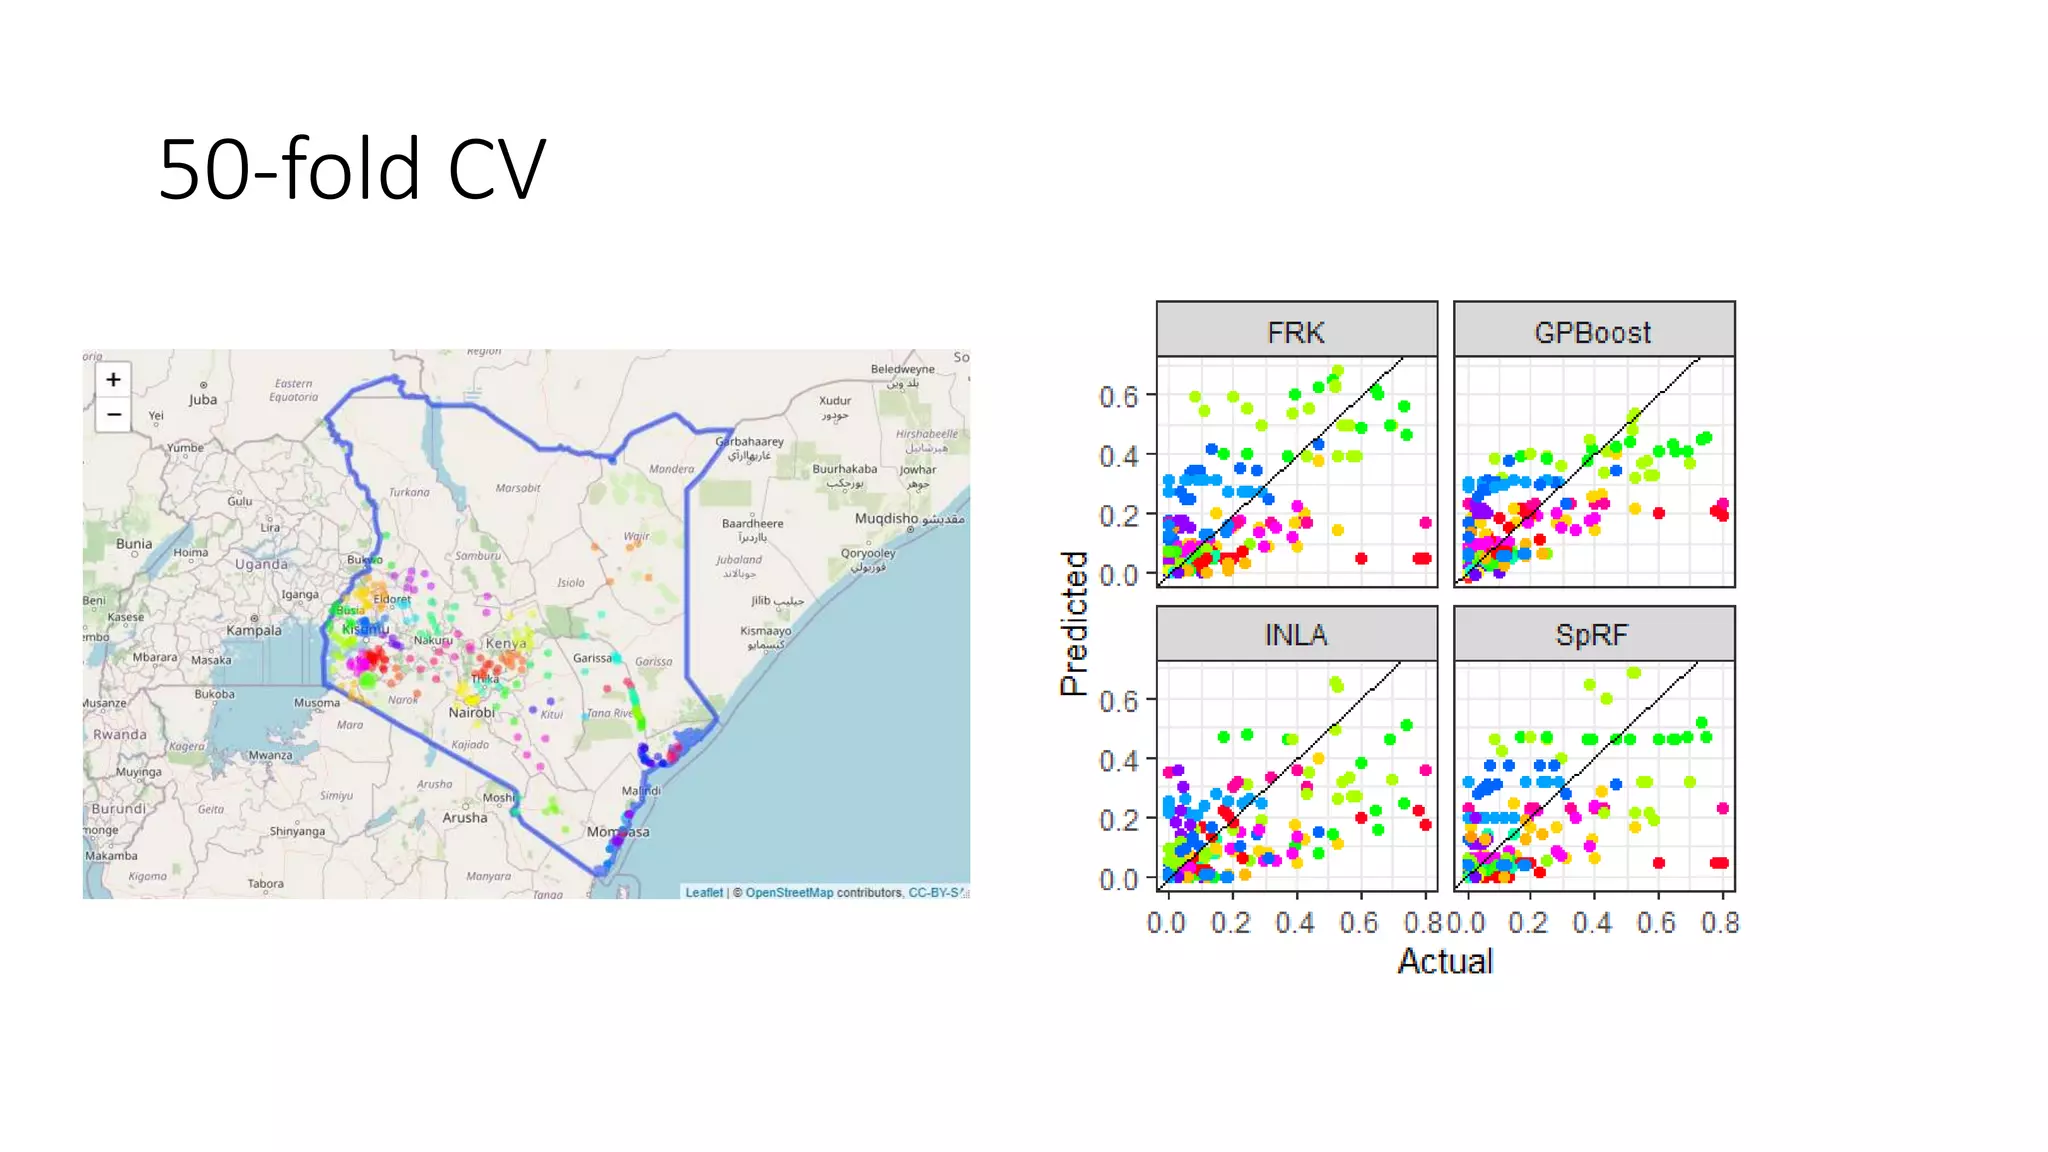
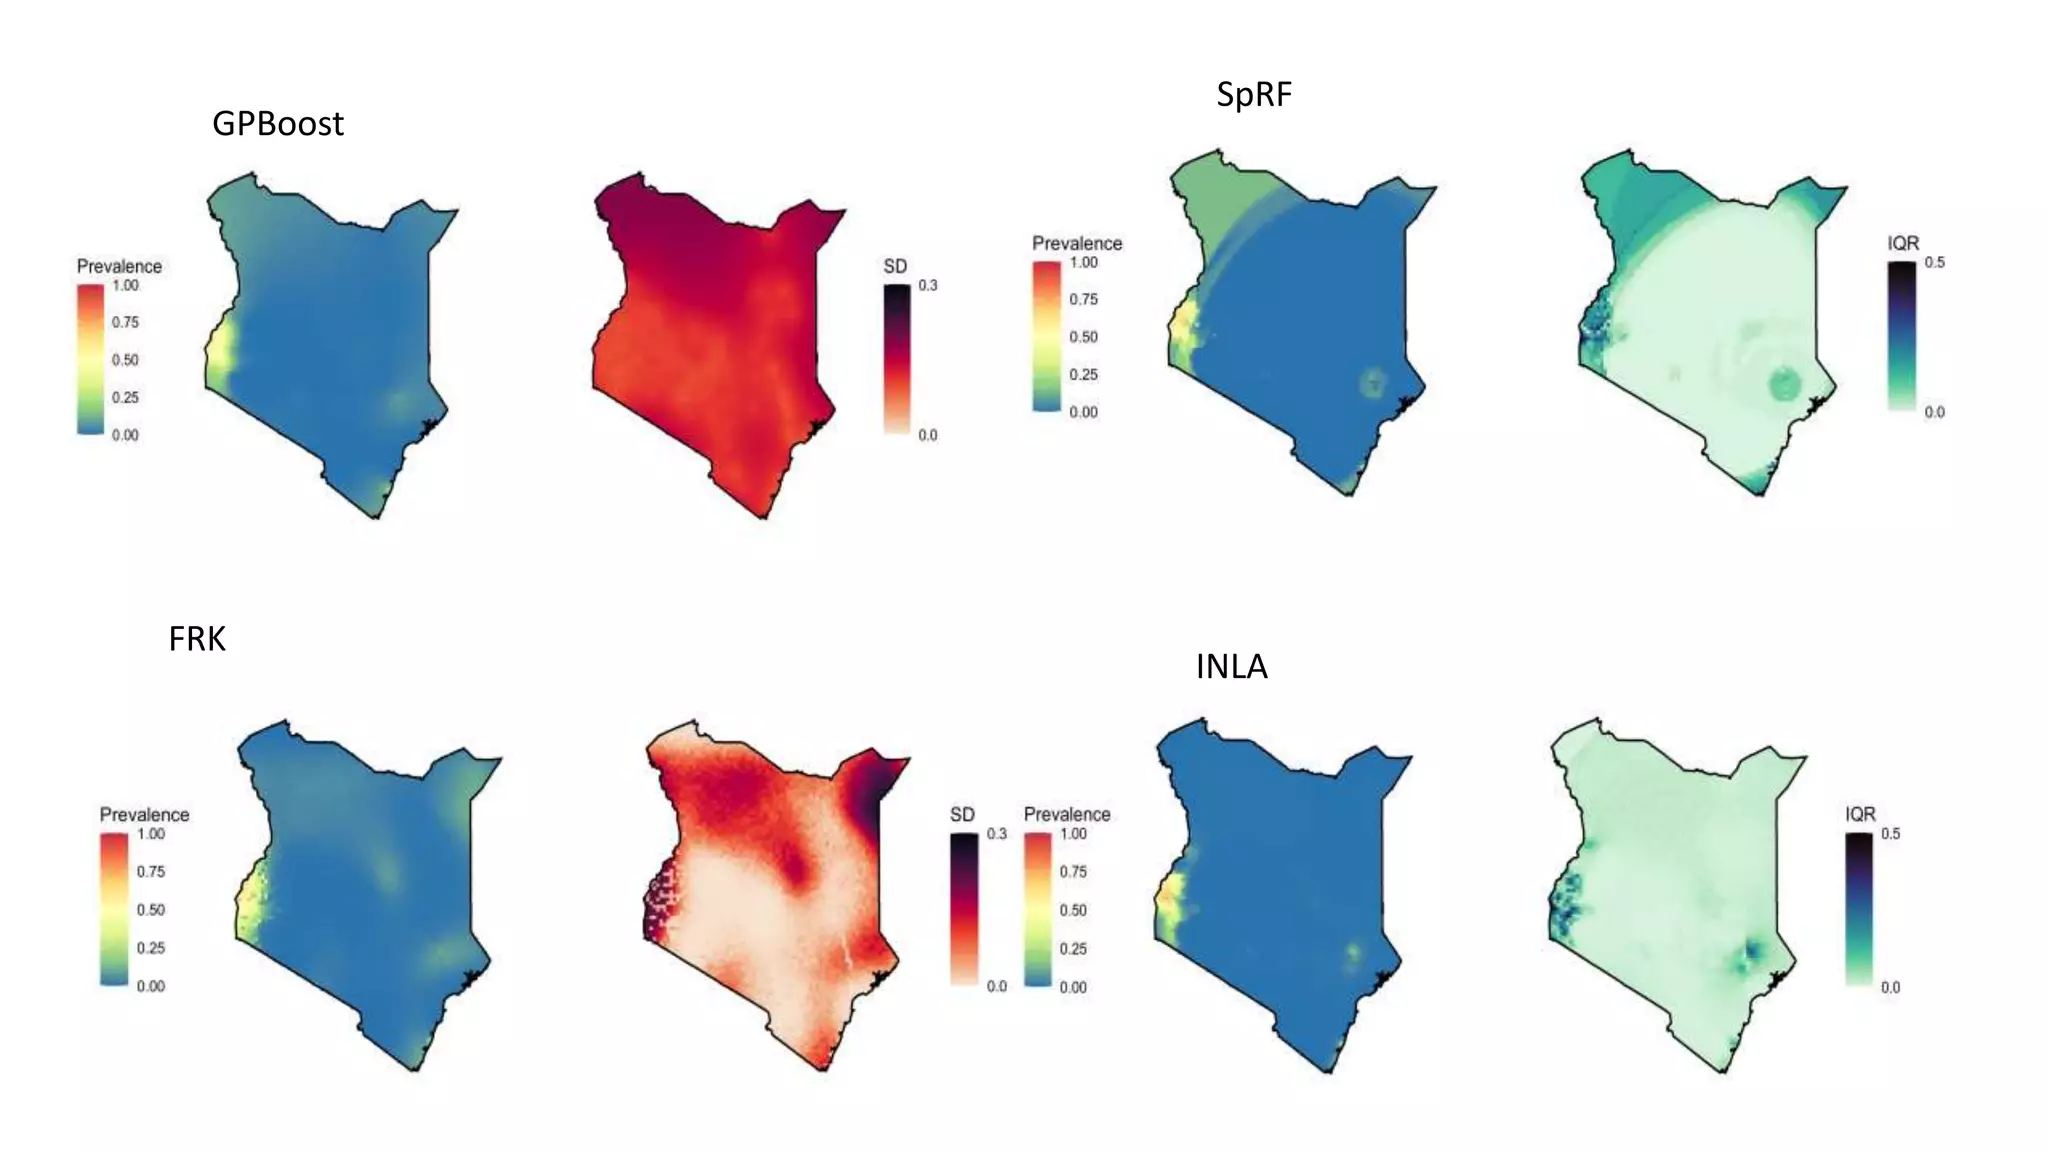
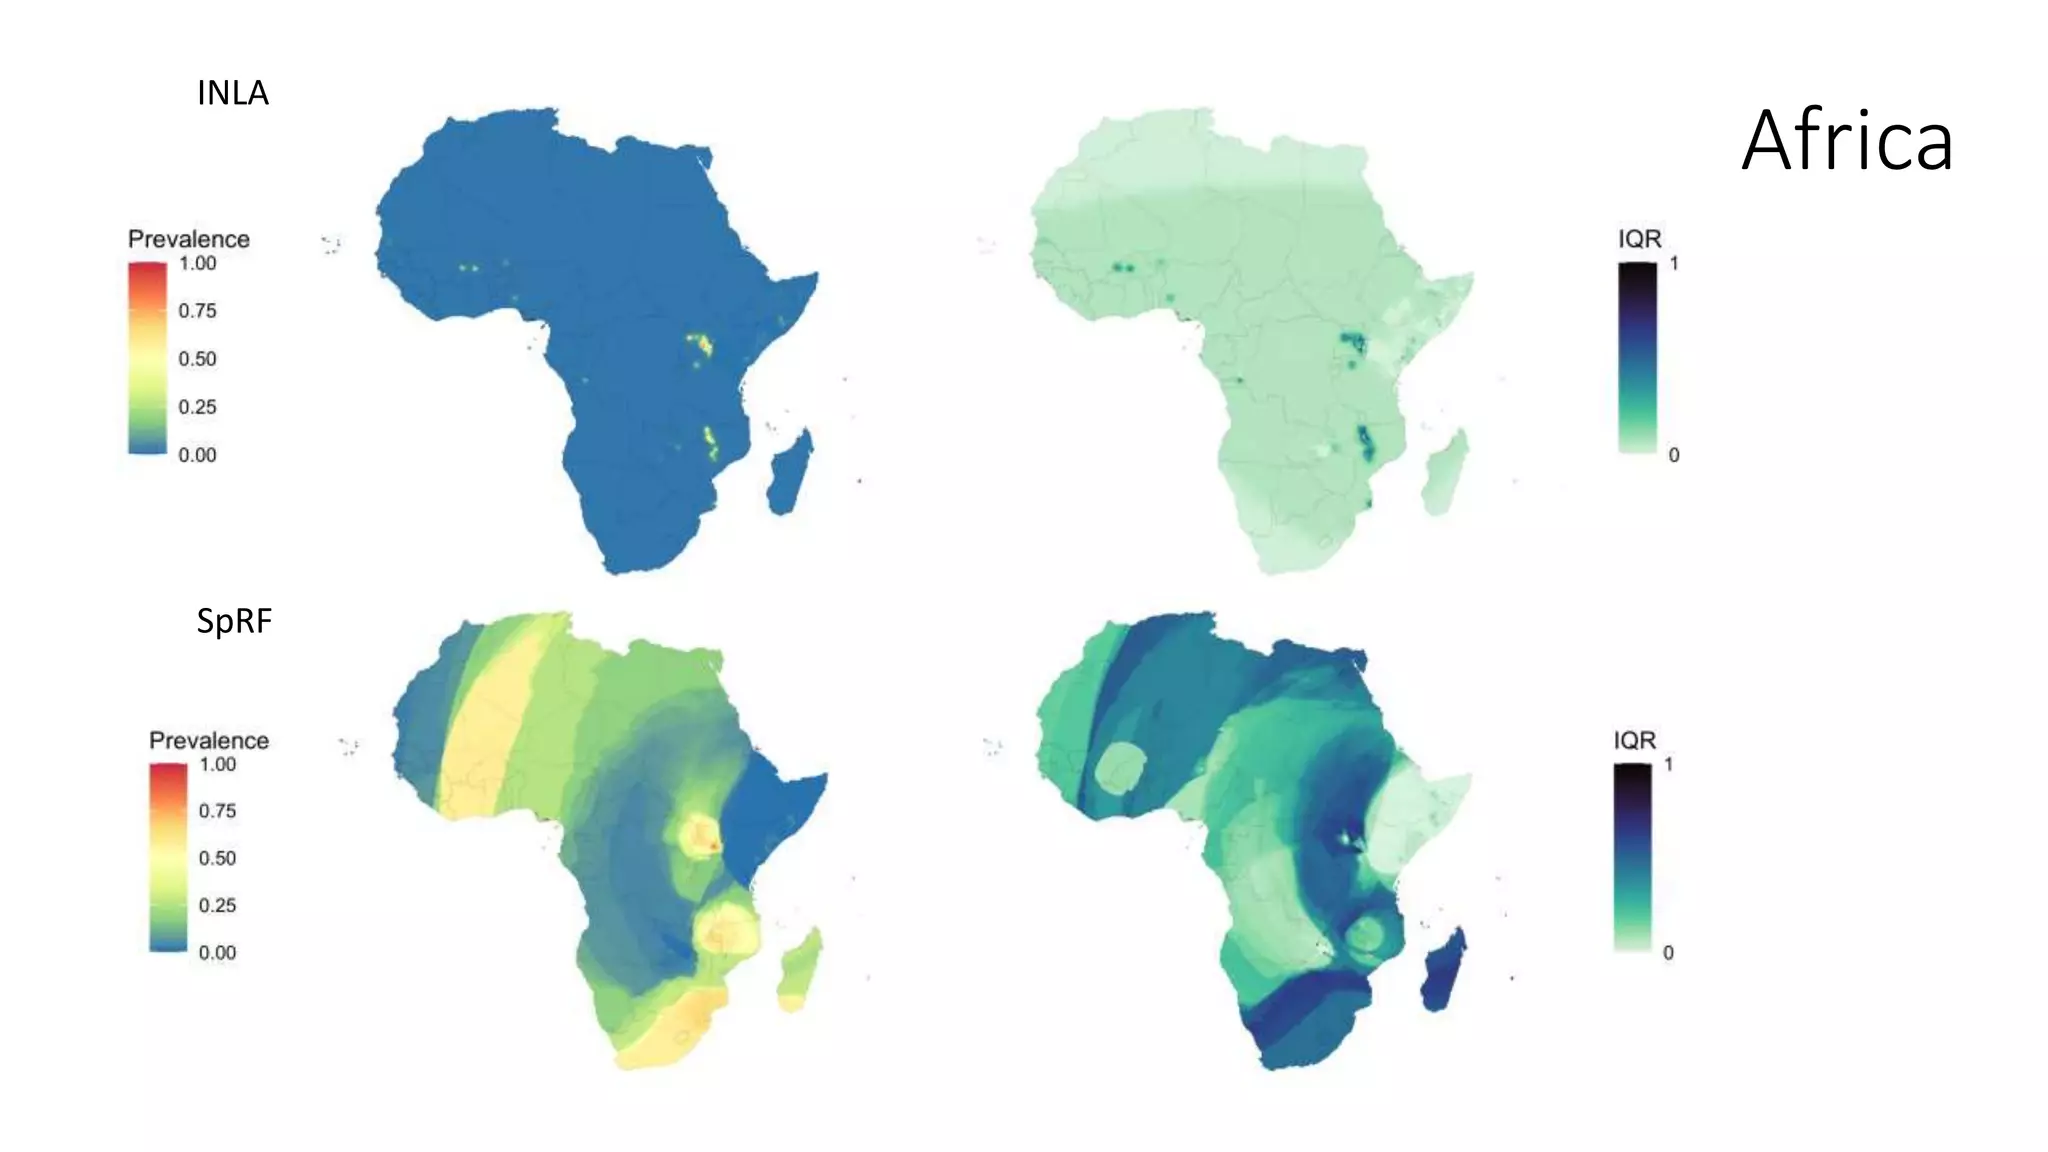
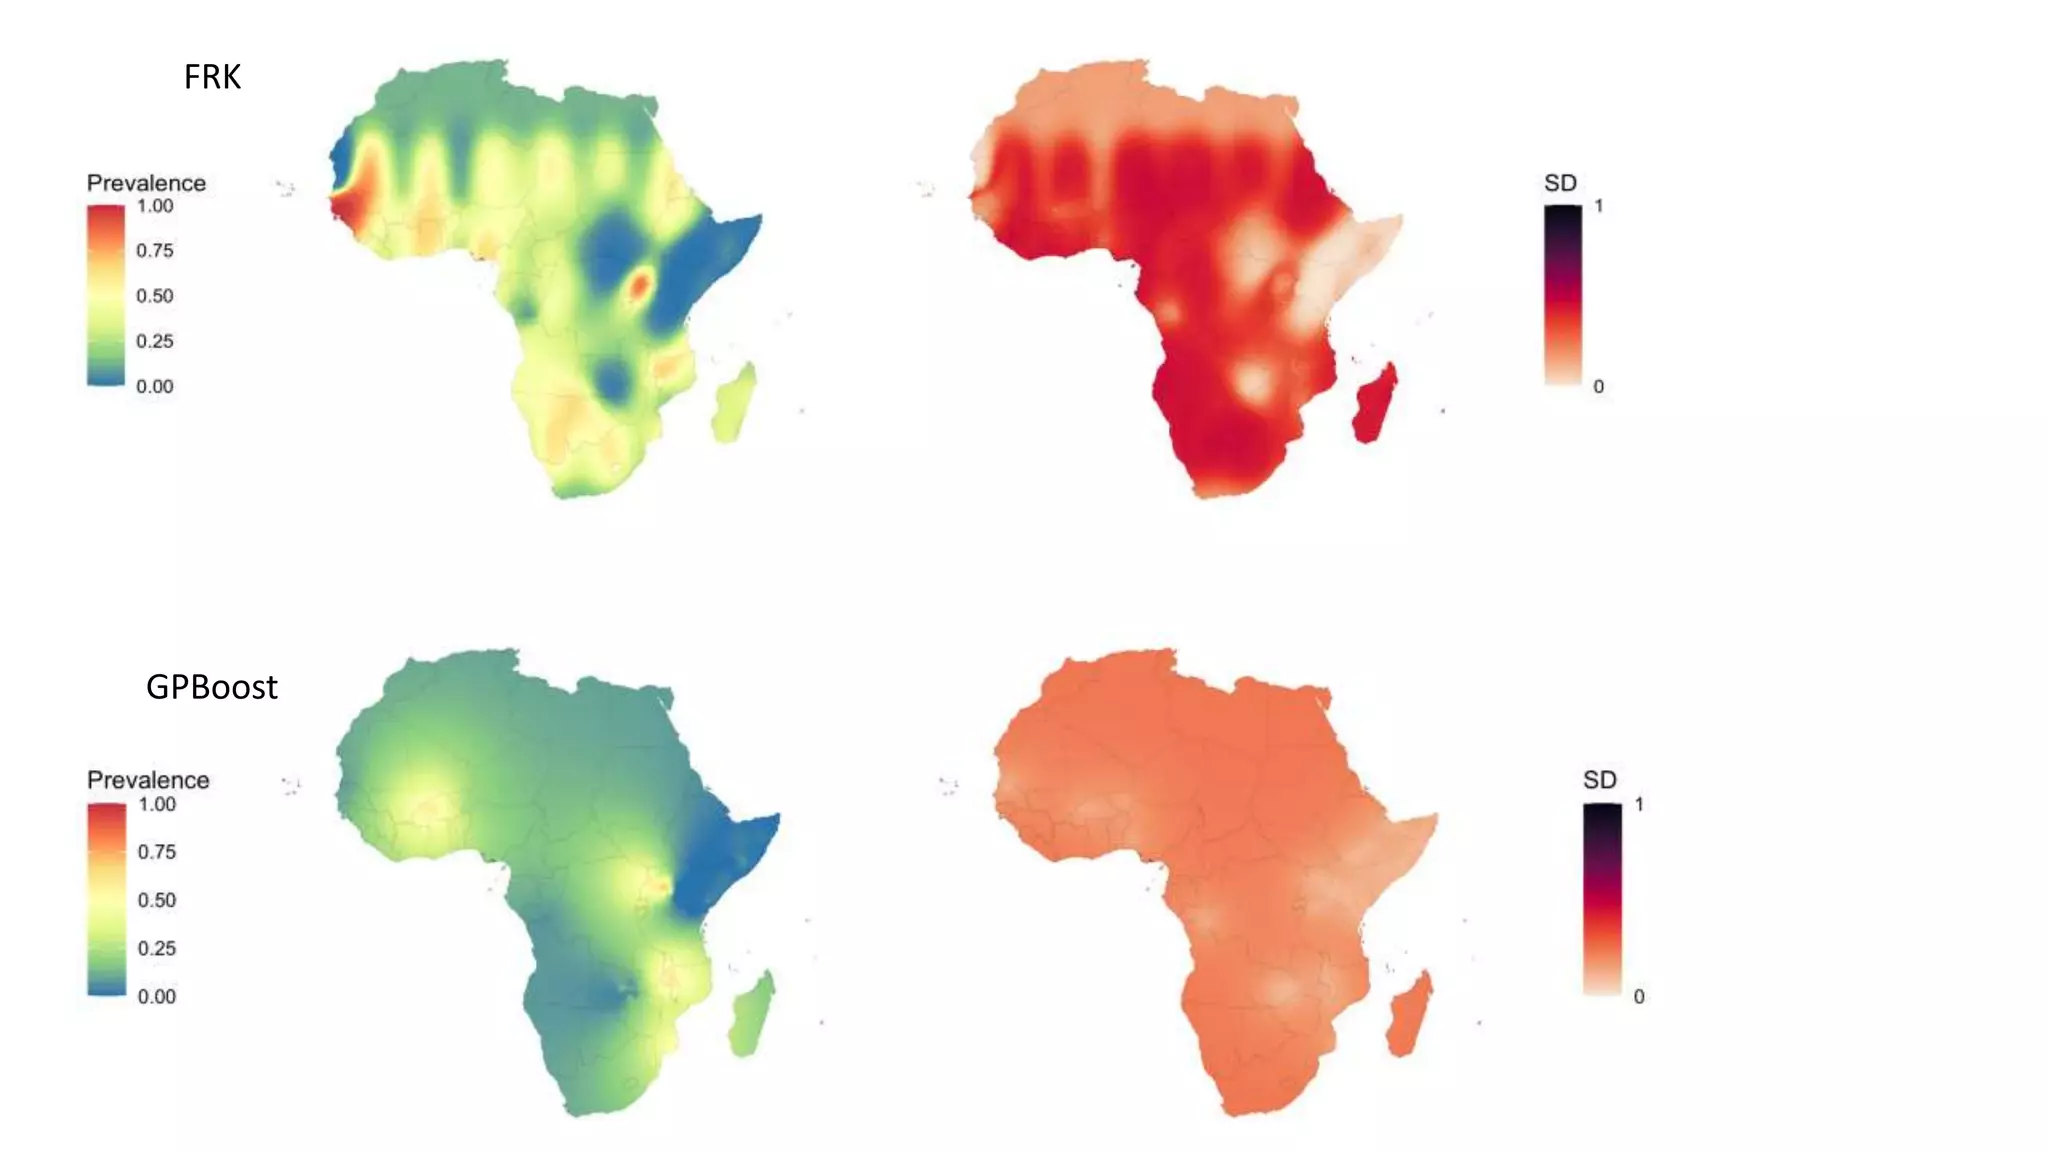


The document compares various geostatistical methods for analyzing spatial data, specifically focusing on predicting quantities like temperature and disease prevalence across different locations. It evaluates methods such as Integrated Nested Laplace Approximations (INLA), Spatial Random Forests (SPRF), Fixed Rank Kriging (FRK), and tree boosting with Gaussian processes (GPBoost) using a case study from Kenya. The findings highlight challenges with parameter tuning and data sparsity, especially when mapping larger regions, requiring users to have a deeper understanding of the methods used.