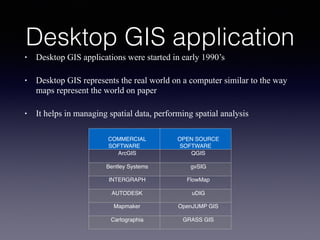
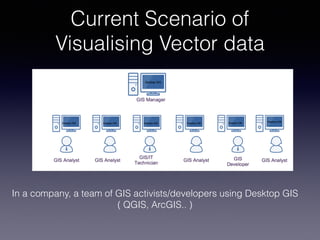
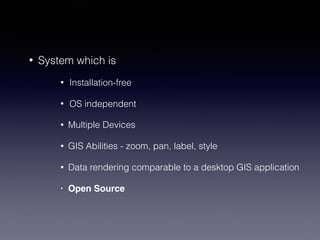
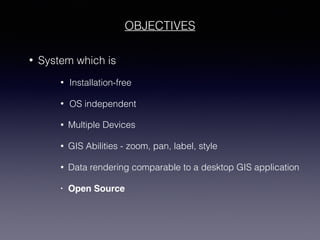
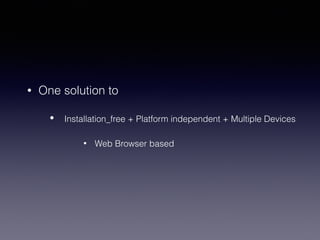
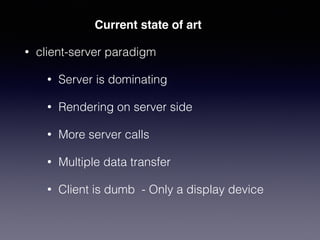
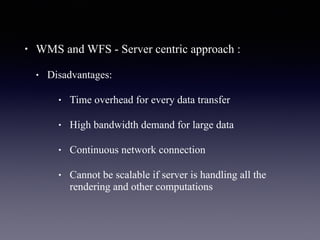
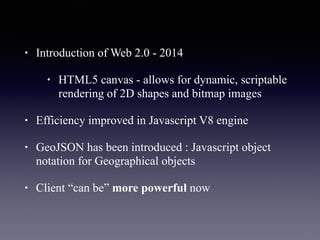
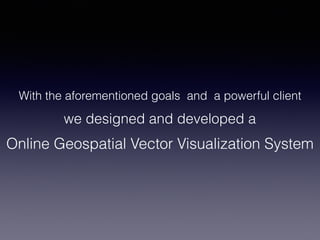
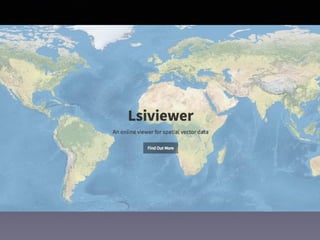
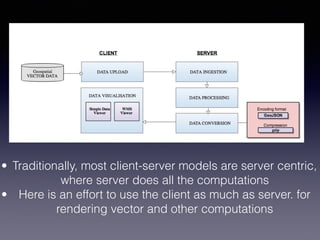
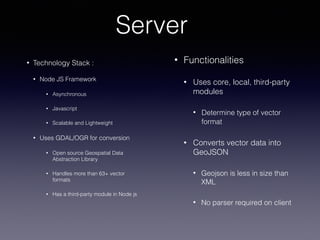
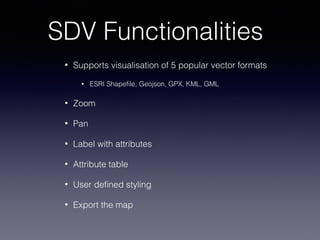
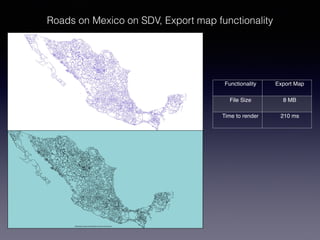
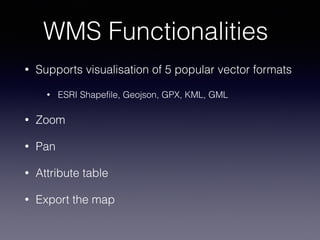
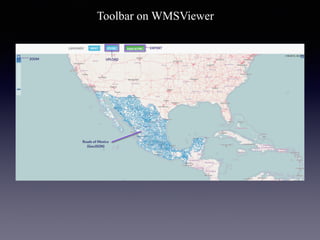
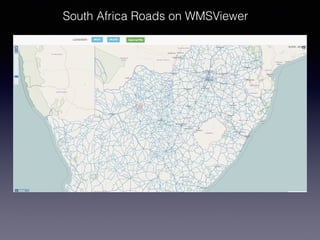
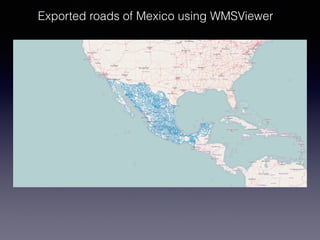
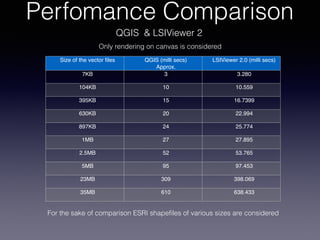
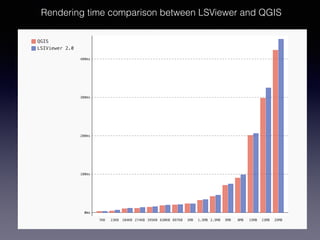
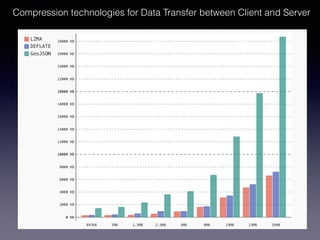
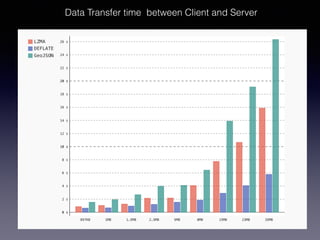
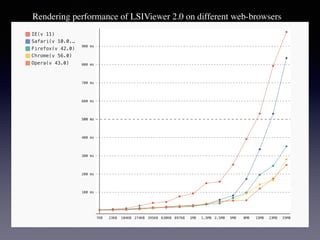
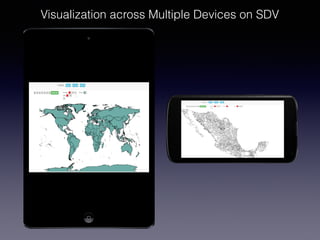
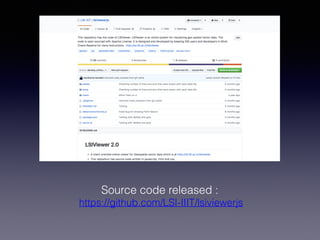
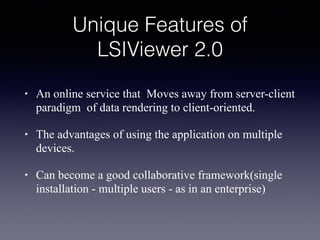
Visualize Geospatial vector data with a single click.
http://lsi.iiit.ac.in/lsiviewer
Published in ISPRS Archives: https://doi.org/10.5194/isprs-archives-XLII-2-W7-107-2017
Presented at ISPRS Geospatial Week - WebMGS 2017 held in Wuhan, China.
For more information:
Lab for Spatial Informatics
B2-213, Vindhya Building
International Institute of Information Technology(IIIT-H)
Hyderabad, India
Phone : (+91-40)2300 1967, 1969 Ext.276
Software Development Life Cycle By Team Orange (Dept. of Pharmacy)
LSIVIEWER 2.0-A CLIENT-ORIENTED ONLINE VISUALIZATION TOOL FOR GEOSPATIAL VECTOR DATA
1. LSIViewer 2.0
A Client Oriented Online Visualization
Tool for Geospatial Vector Data
September 19th , 2017
Lab for Spatial Informatics(LSI), IIIT-H
K. Manikanta, Dr K. S. Rajan
INDIA
2. Vector Data
• Points: bore wells, discrete points
• Lines: Road Network, River, etc.
• Polygons: Boundaries, Areas etc.
(Longitude, Latitude) OR (x,y)
ESRI Shapefile
GeoJSON
GML
GPX
KML
etc.., (50+ formats)
Vector File Formats
3. Working with Vector Models
• How do we perform below tasks?
• Creation
• Deletion
• Manipulation
• Finite Visualization
This gave rise to Desktop based GIS Application Software
4. Desktop GIS application
• Desktop GIS applications were started in early 1990’s
• Desktop GIS represents the real world on a computer similar to the way
maps represent the world on paper
• It helps in managing spatial data, performing spatial analysis
COMMERCIAL
SOFTWARE
OPEN SOURCE
SOFTWARE
ArcGIS QGIS
Bentley Systems gvSIG
INTERGRAPH FlowMap
AUTODESK uDIG
Mapmaker OpenJUMP GIS
Cartographia GRASS GIS
5. In a company, a team of GIS activists/developers using Desktop GIS
( QGIS, ArcGIS.. )
Current Scenario of
Visualising Vector data
6. • Disadvantages of Desktop Applications
• Sharing data
• Need to install the application
• Can not support multiple Devices
• Expensive(Commercial software)
8. • System which is
• Installation-free
• OS independent
• Multiple Devices
• GIS Abilities - zoom, pan, label, style
• Data rendering comparable to a desktop GIS application
• Open Source
9. OBJECTIVES
• System which is
• Installation-free
• OS independent
• Multiple Devices
• GIS Abilities - zoom, pan, label, style
• Data rendering comparable to a desktop GIS application
• Open Source
10. • One solution to
• Installation_free + Platform independent + Multiple Devices
• Web Browser based
12. • client-server paradigm
• Server is dominating
• Rendering on server side
• More server calls
• Multiple data transfer
• Client is dumb - Only a display device
Current state of art
13. OGC Standards
• To support images in web…
• WMS was introduced (1999)
• Client requests the server for a geographical layers
• Server responds with one or more geo-registered images(JPEG, PNG etc)
• To edit the map..
• WFS was introduced (2005)
• An interface allowing requests for geographical features across the web using
platform-independent calls
• Feature can be thought as a source code behind the map
• Both WMS and WFS follows a client-server paradigm
14. • WMS and WFS - Server centric approach :
• Disadvantages:
• Time overhead for every data transfer
• High bandwidth demand for large data
• Continuous network connection
• Cannot be scalable if server is handling all the
rendering and other computations
15. • Introduction of Web 2.0 - 2014
• HTML5 canvas - allows for dynamic, scriptable
rendering of 2D shapes and bitmap images
• Efficiency improved in Javascript V8 engine
• GeoJSON has been introduced : Javascript object
notation for Geographical objects
• Client “can be” more powerful now
16. With the aforementioned goals and a powerful client
we designed and developed a
Online Geospatial Vector Visualization System
19. • Traditionally, most client-server models are server centric,
where server does all the computations
• Here is an effort to use the client as much as server. for
rendering vector and other computations
22. Server
• Functionalities
• Uses core, local, third-party
modules
• Determine type of vector
format
• Converts vector data into
GeoJSON
• Geojson is less in size than
XML
• No parser required on client
• Technology Stack :
• Node JS Framework
• Asynchronous
• Javascript
• Scalable and Lightweight
• Uses GDAL/OGR for conversion
• Open source Geospatial Data
Abstraction Library
• Handles more than 63+ vector
formats
• Has a third-party module in Node js
23. GeoJSON
(in JS environment)
GML
(in JS environment)
De-serialization of GeoJSON
is very fast
De-serialization of GML is
slow
It has simple API in JavaScript An External parser is needed
to parse the GML data
Key-value pair representation
in GeoJSON makes it simple
and human readable)
GML is very lengthy due to
tags and namespaces
25. Client
Data Visualisation
• Simple data viewer (SDV)
• Uses HTML5 Canvas methods
• Javascript library for color palette
• User Defined styling
• Export the map
• WMS viewer (WMS)
• Uses Openlayers : Open source JS lib
• Openstreet map, Google Maps or Bing Maps
• Useful for validation for user owned data
• Export the map
26. LSIViewer 2.0
An online viewer for Geospatial vector data using javascript and canvas
lsi.iiit.ac.in/lsiviewer
27. SDV Functionalities
• Supports visualisation of 5 popular vector formats
• ESRI Shapefile, Geojson, GPX, KML, GML
• Zoom
• Pan
• Label with attributes
• Attribute table
• User defined styling
• Export the map
29. List of Shapefile datasets used for testing
Downloaded from US Census and DIVA GIS websites
Rhode island Secondary school 7 KB
Kentucky Secondary school 23 KB
Connecticu Secondary school 104 KB
Arizona Secondary school 274 KB
Massachusett Secondary school 395 KB
Rhode Islan County subdivisio 630 KB
Vigin islands of the U. Estate 897KB
Michiga S L D 1 MB
Rhode Islan Road 1.5 MB
Hawai Road 2.5 MB
South Afric Road 5 MB
Mexic Road 8 MB
India Road 15 MB
46. Unique Features of
LSIViewer 2.0
• An online service that Moves away from server-client
paradigm of data rendering to client-oriented.
• The advantages of using the application on multiple
devices.
• Can become a good collaborative framework(single
installation - multiple users - as in an enterprise)
48. Future work
• To Support other Geospatial Vector formats
• To build Enterprise level collaboration tool like
Google docs
• Support Multiple Vector Layers
• Adding Projection