Download as PDF, PPTX
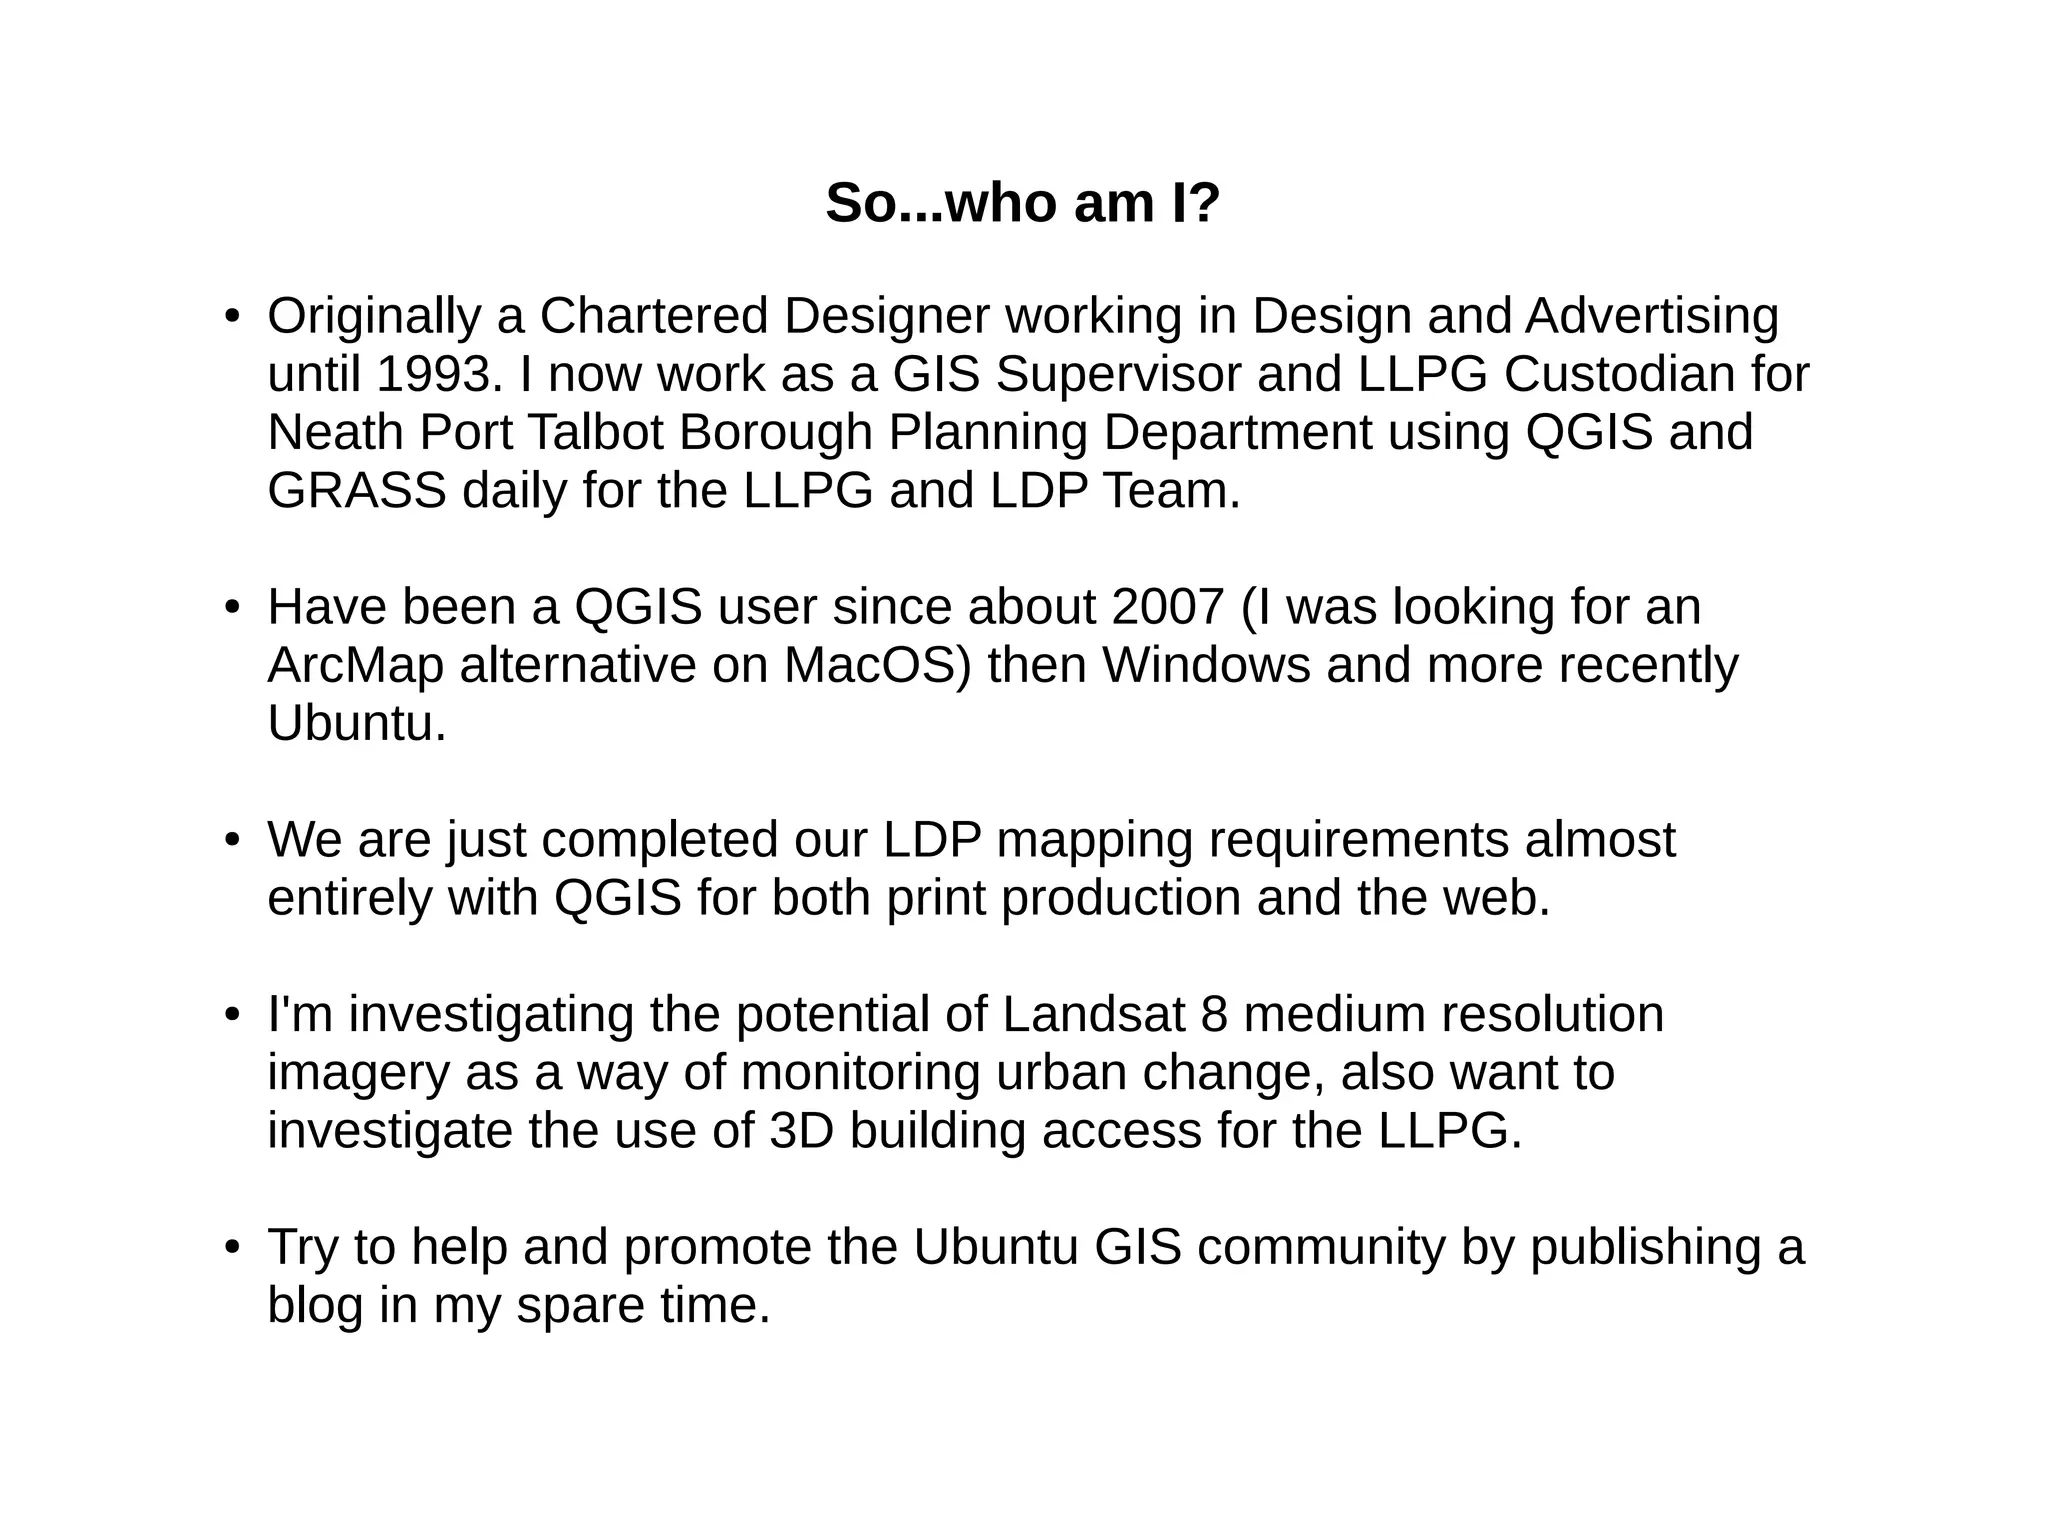
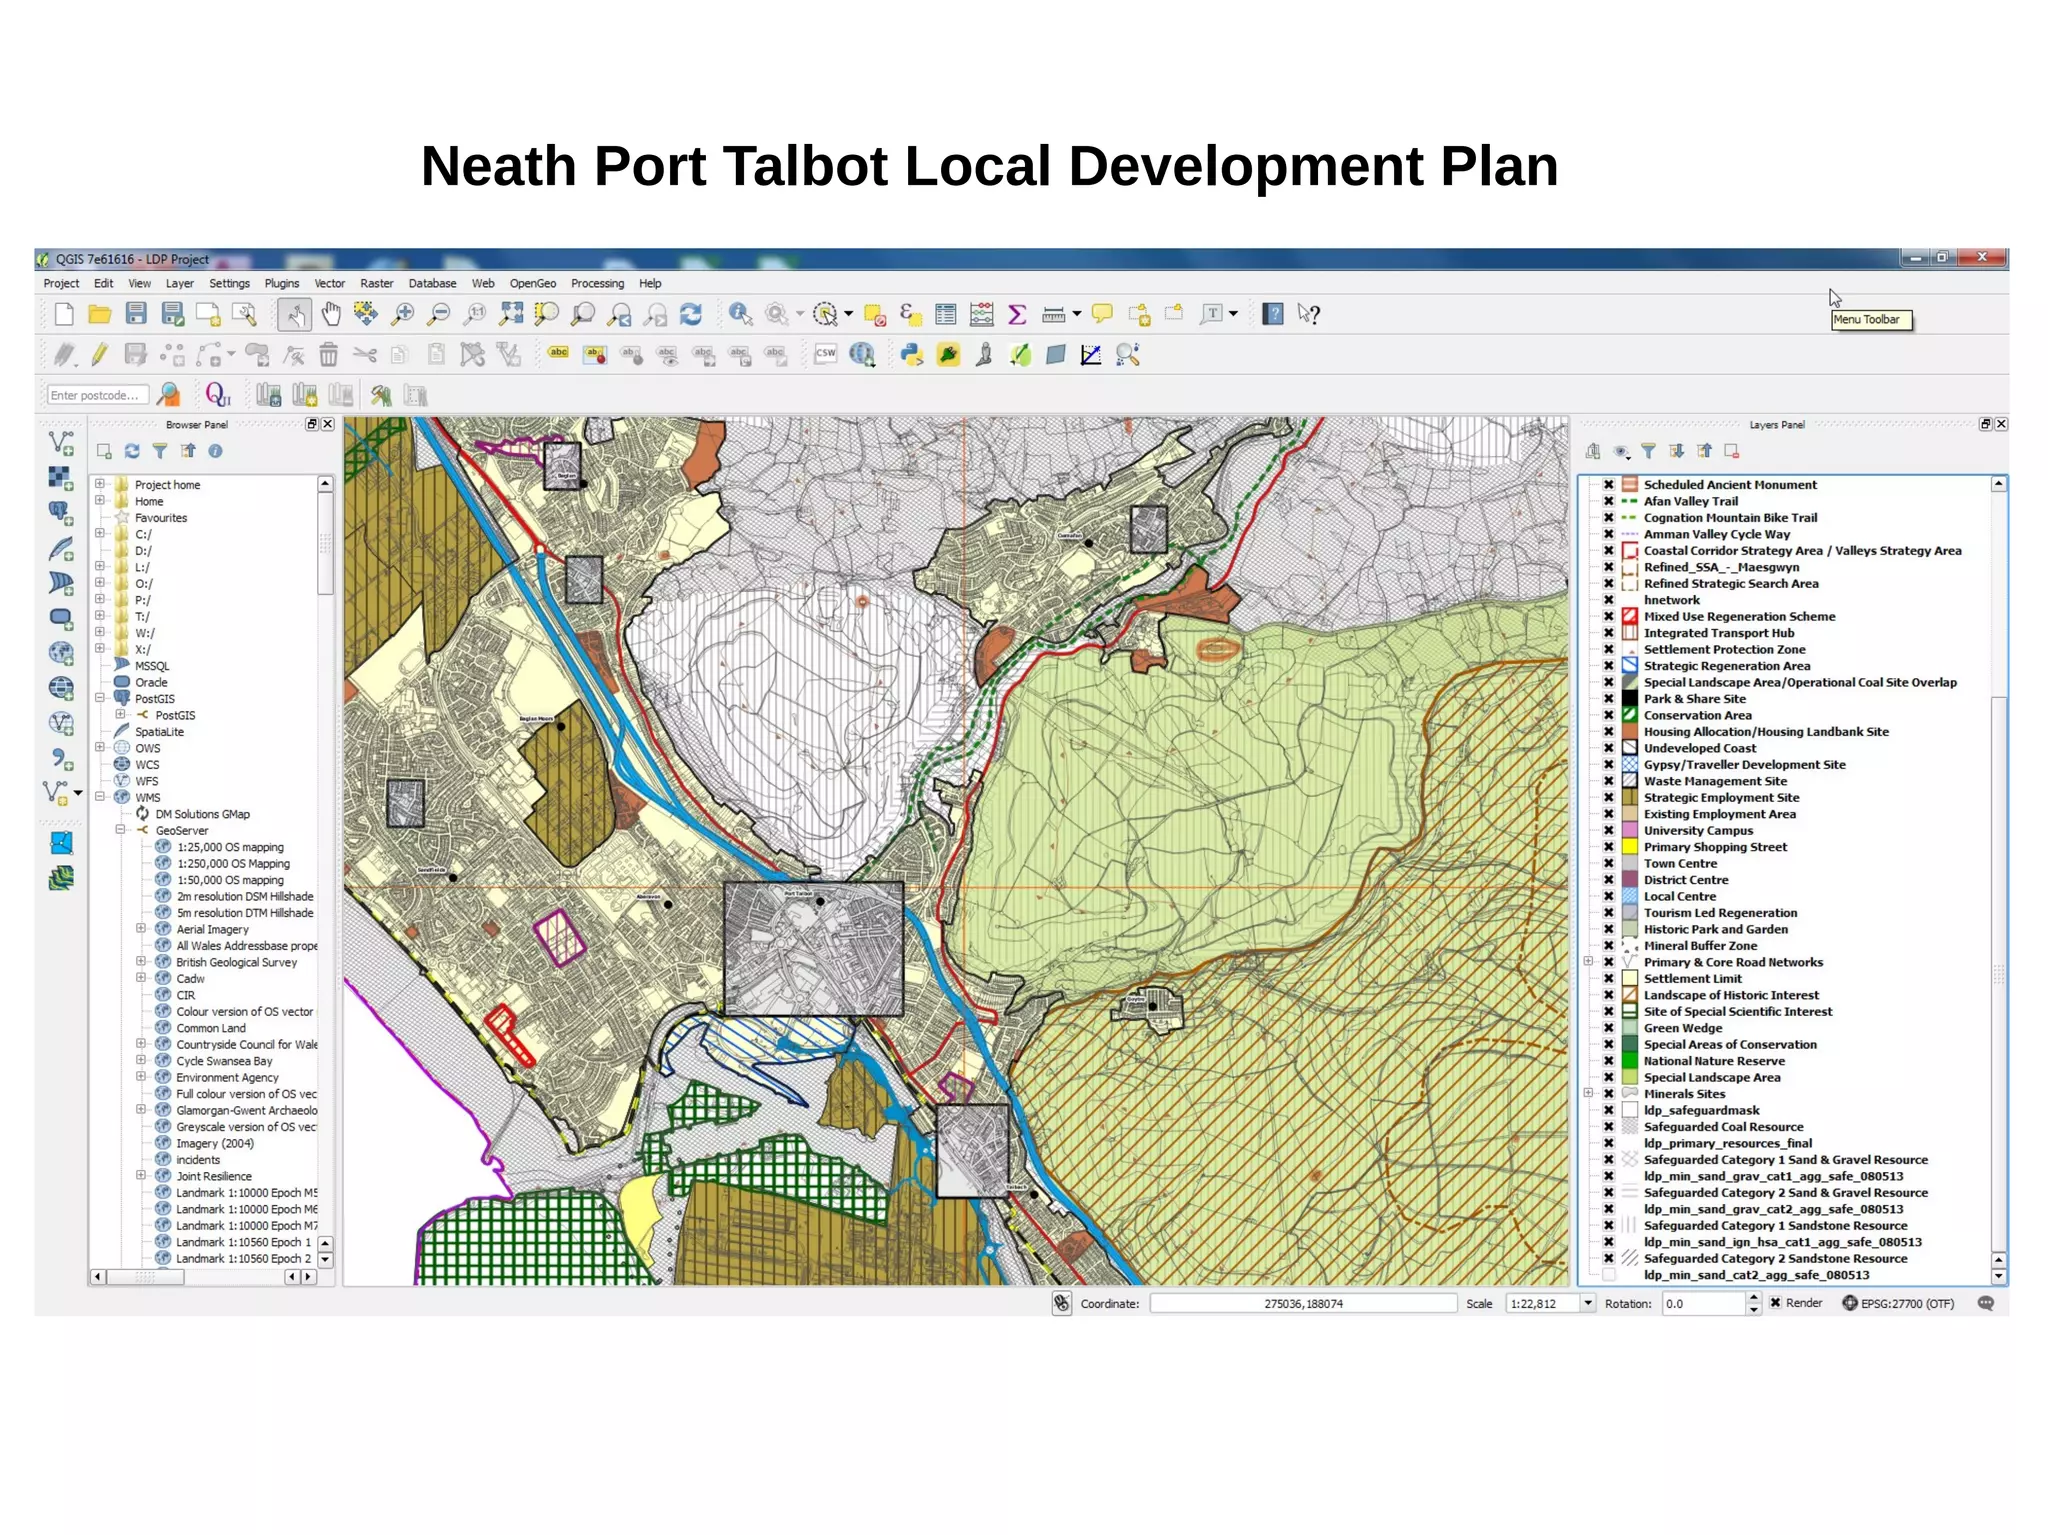
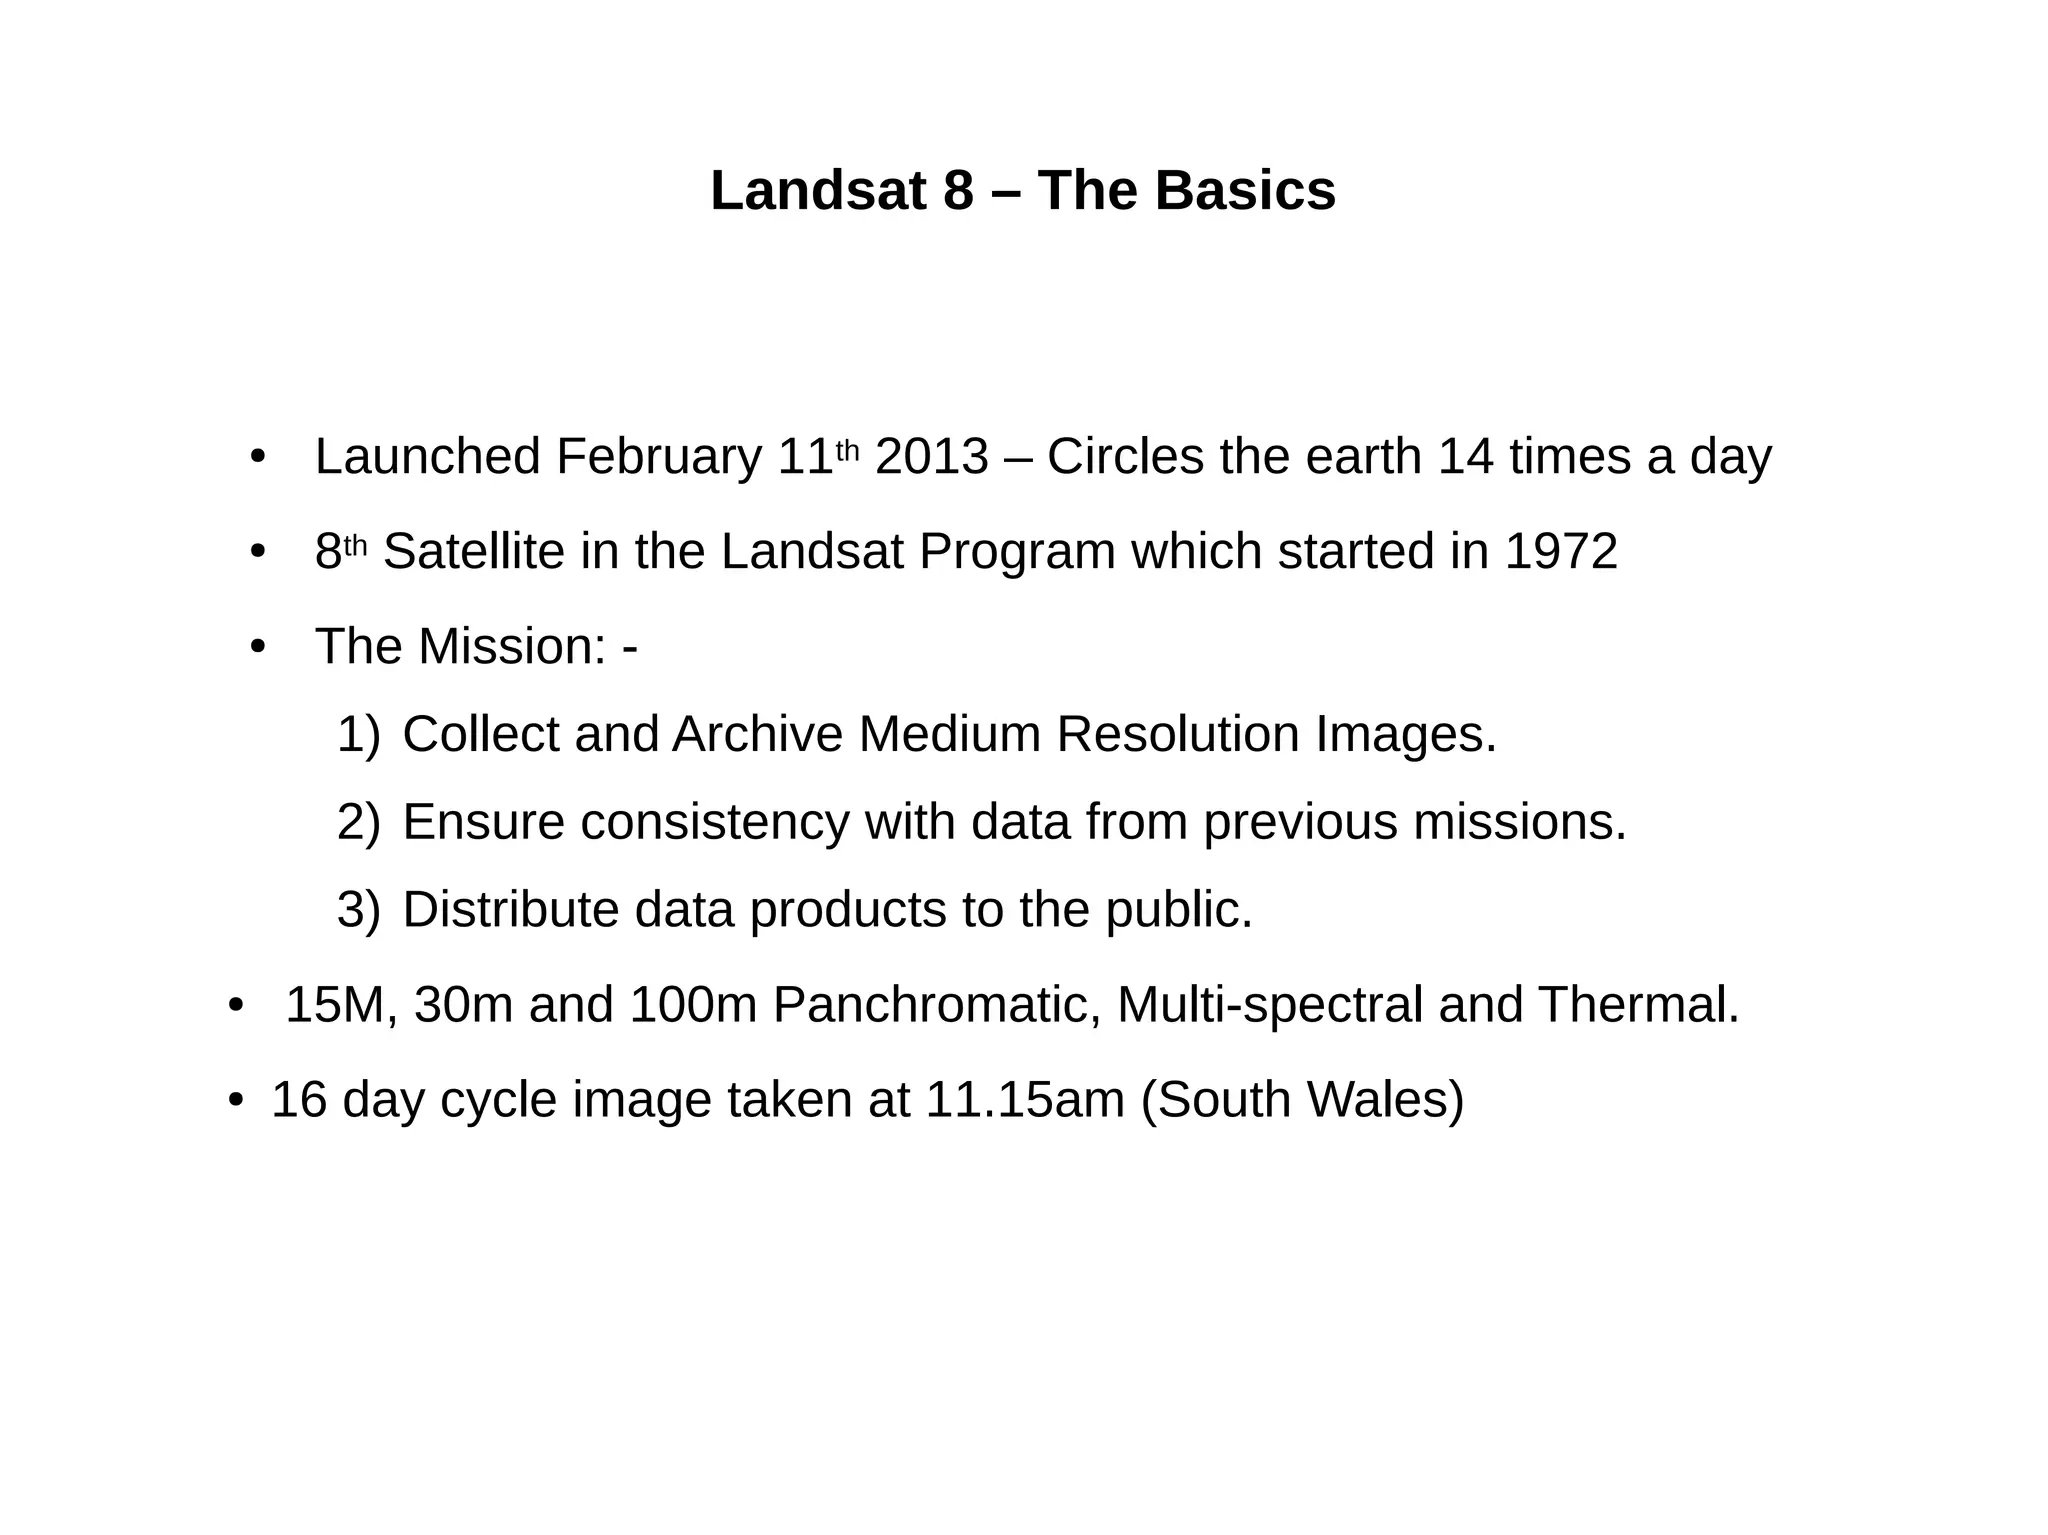
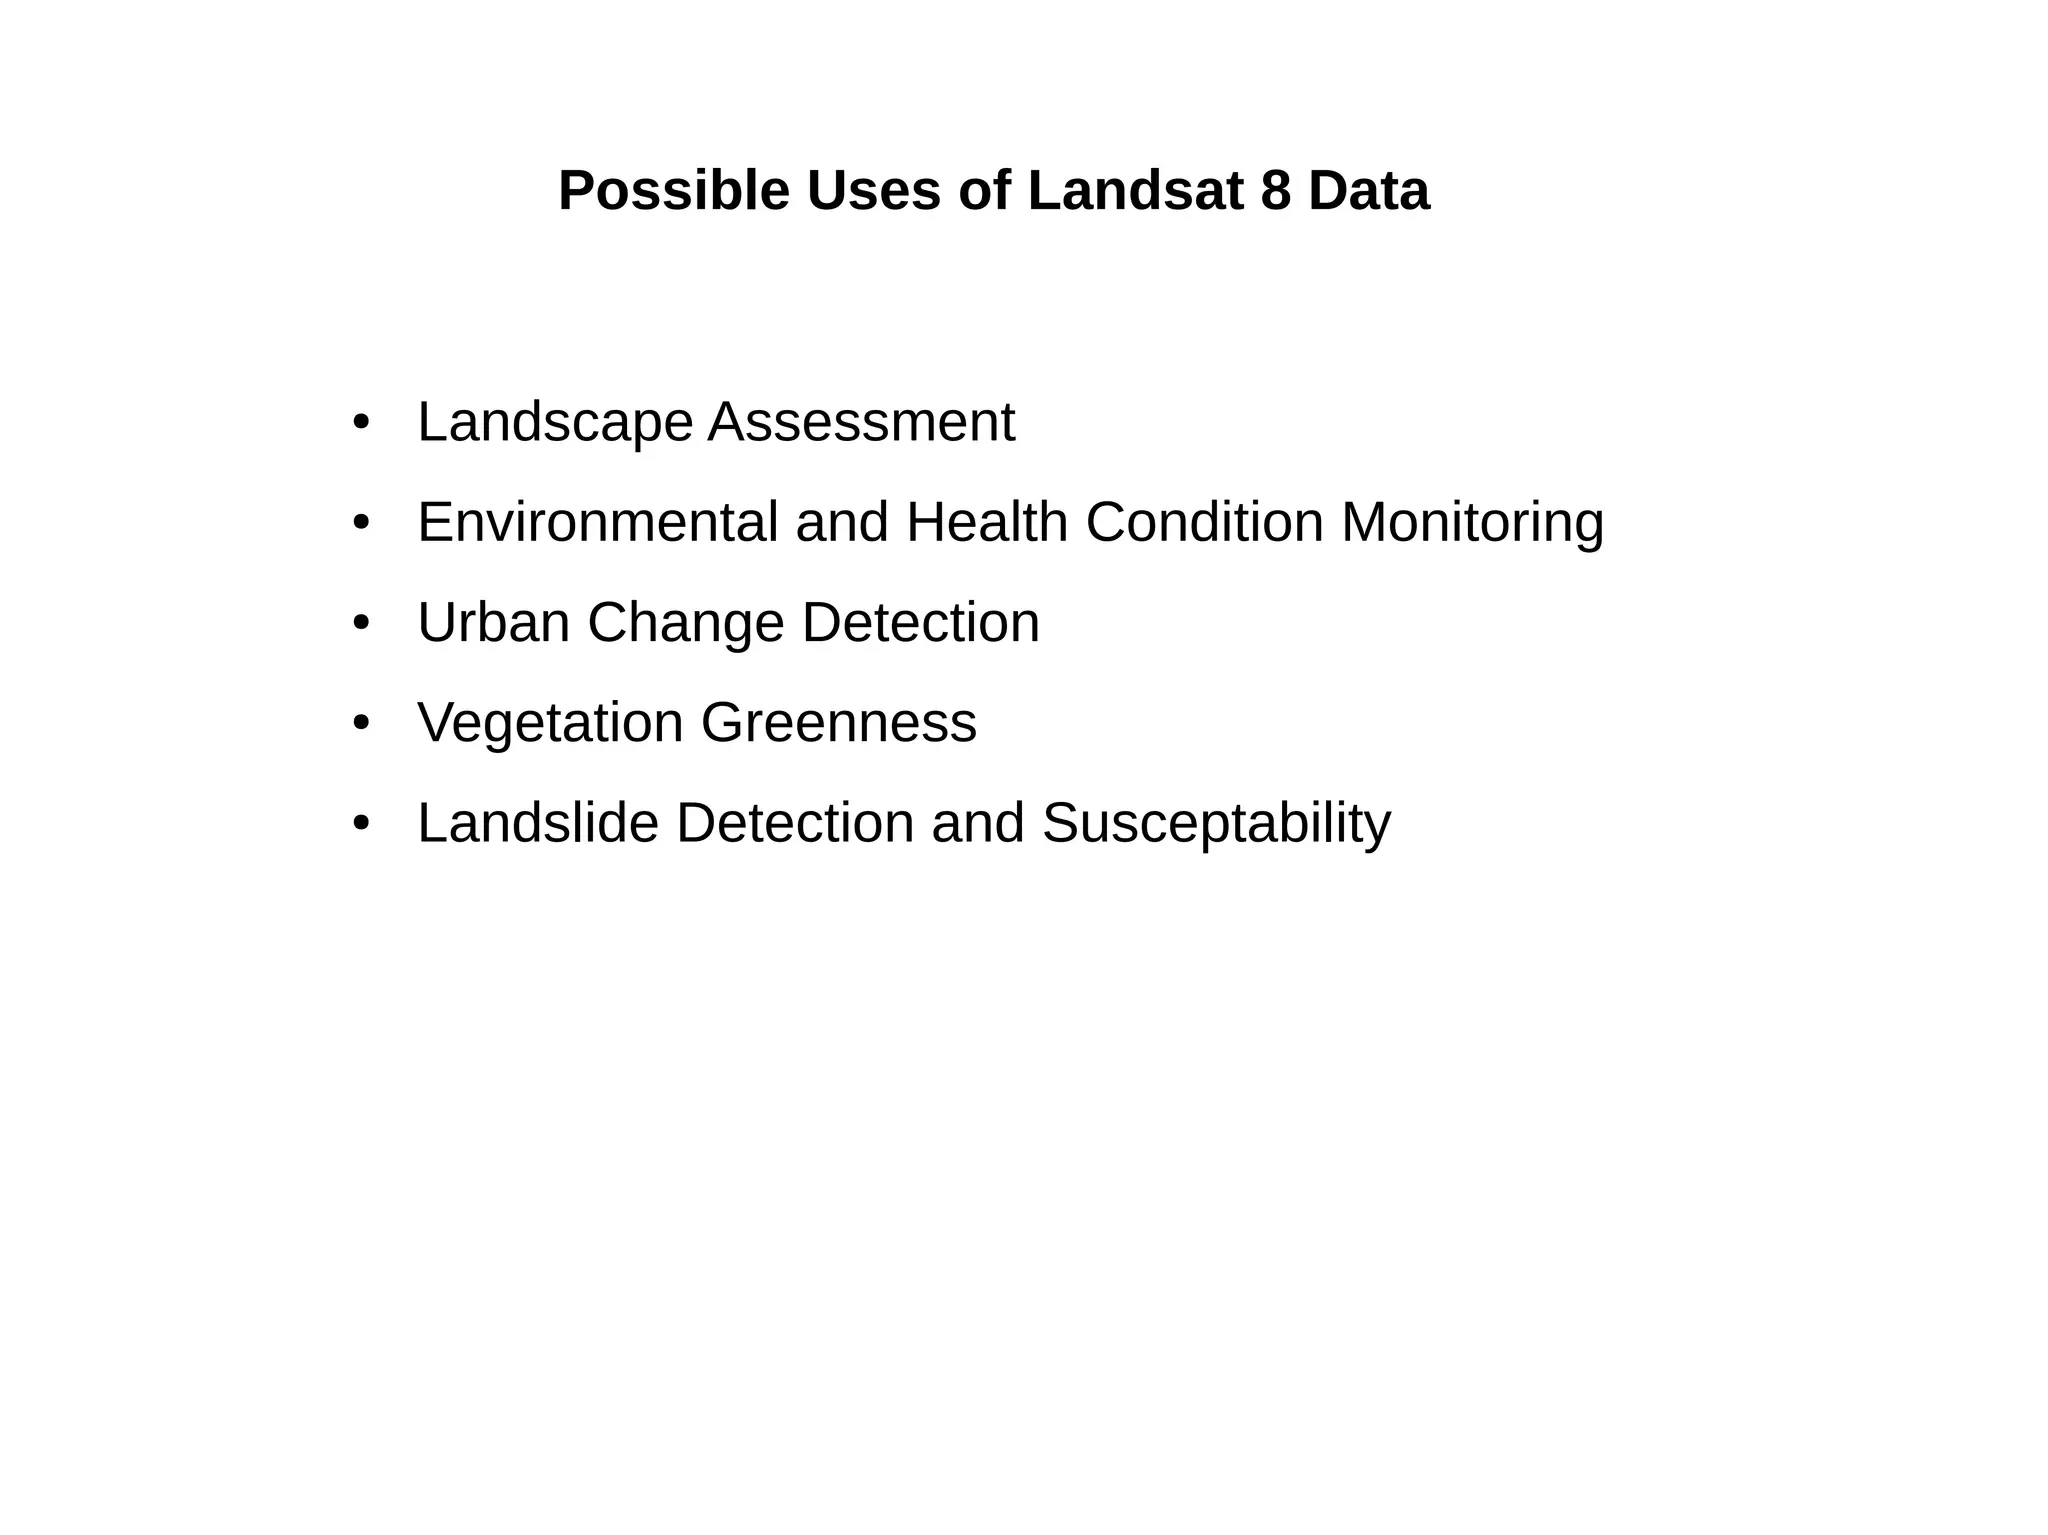


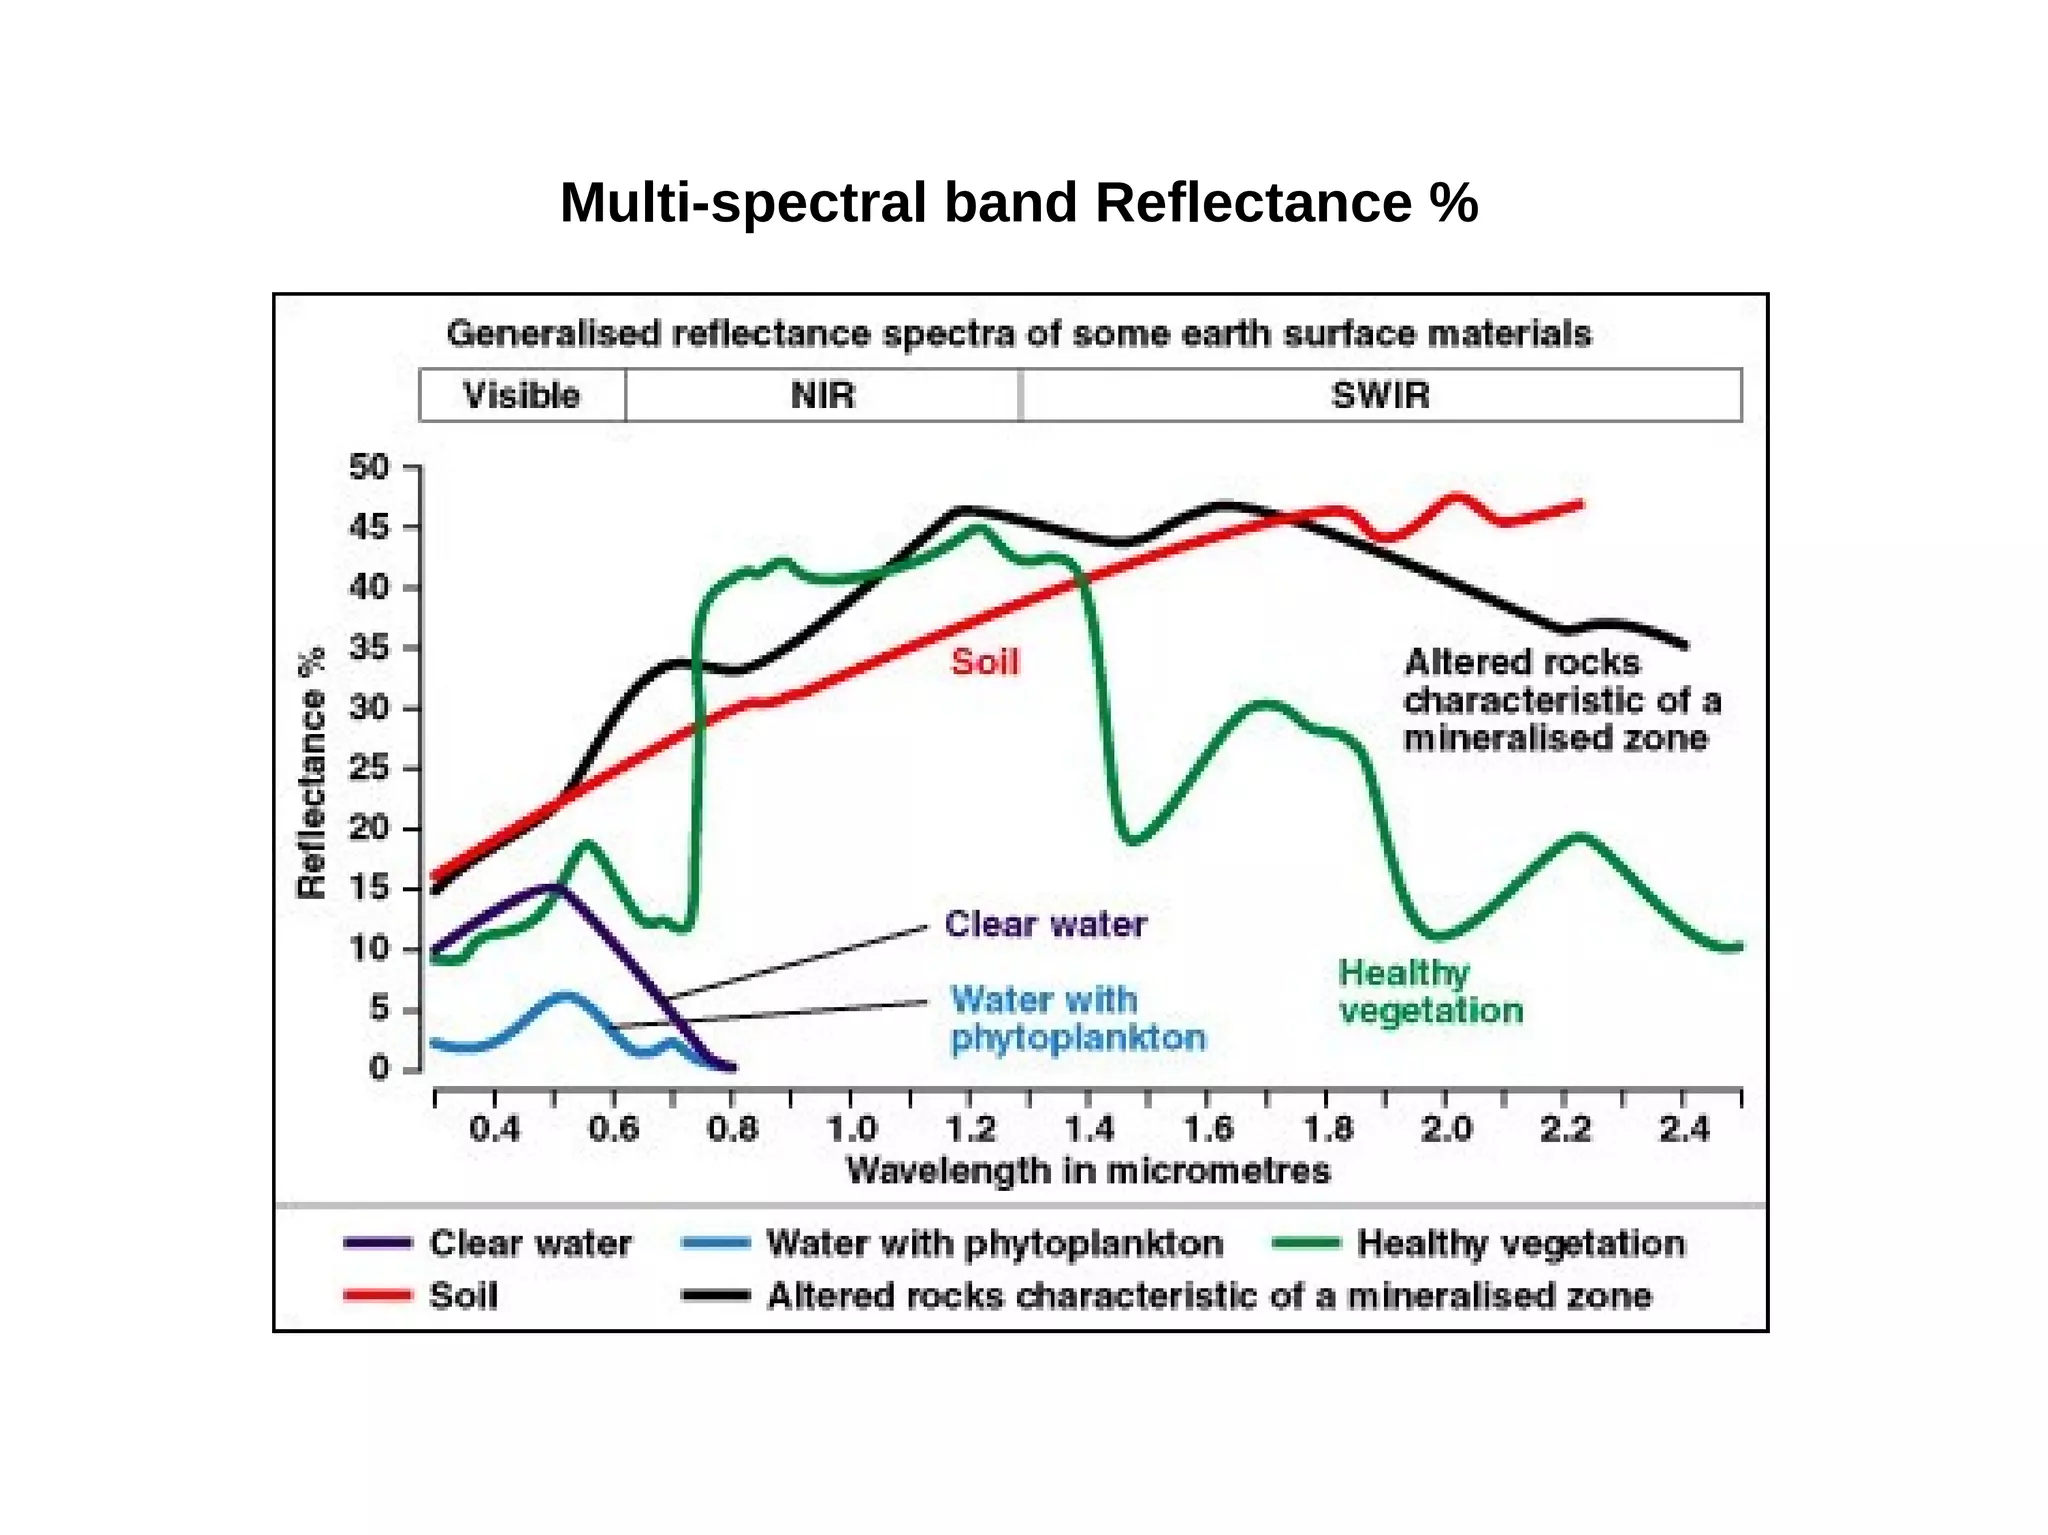


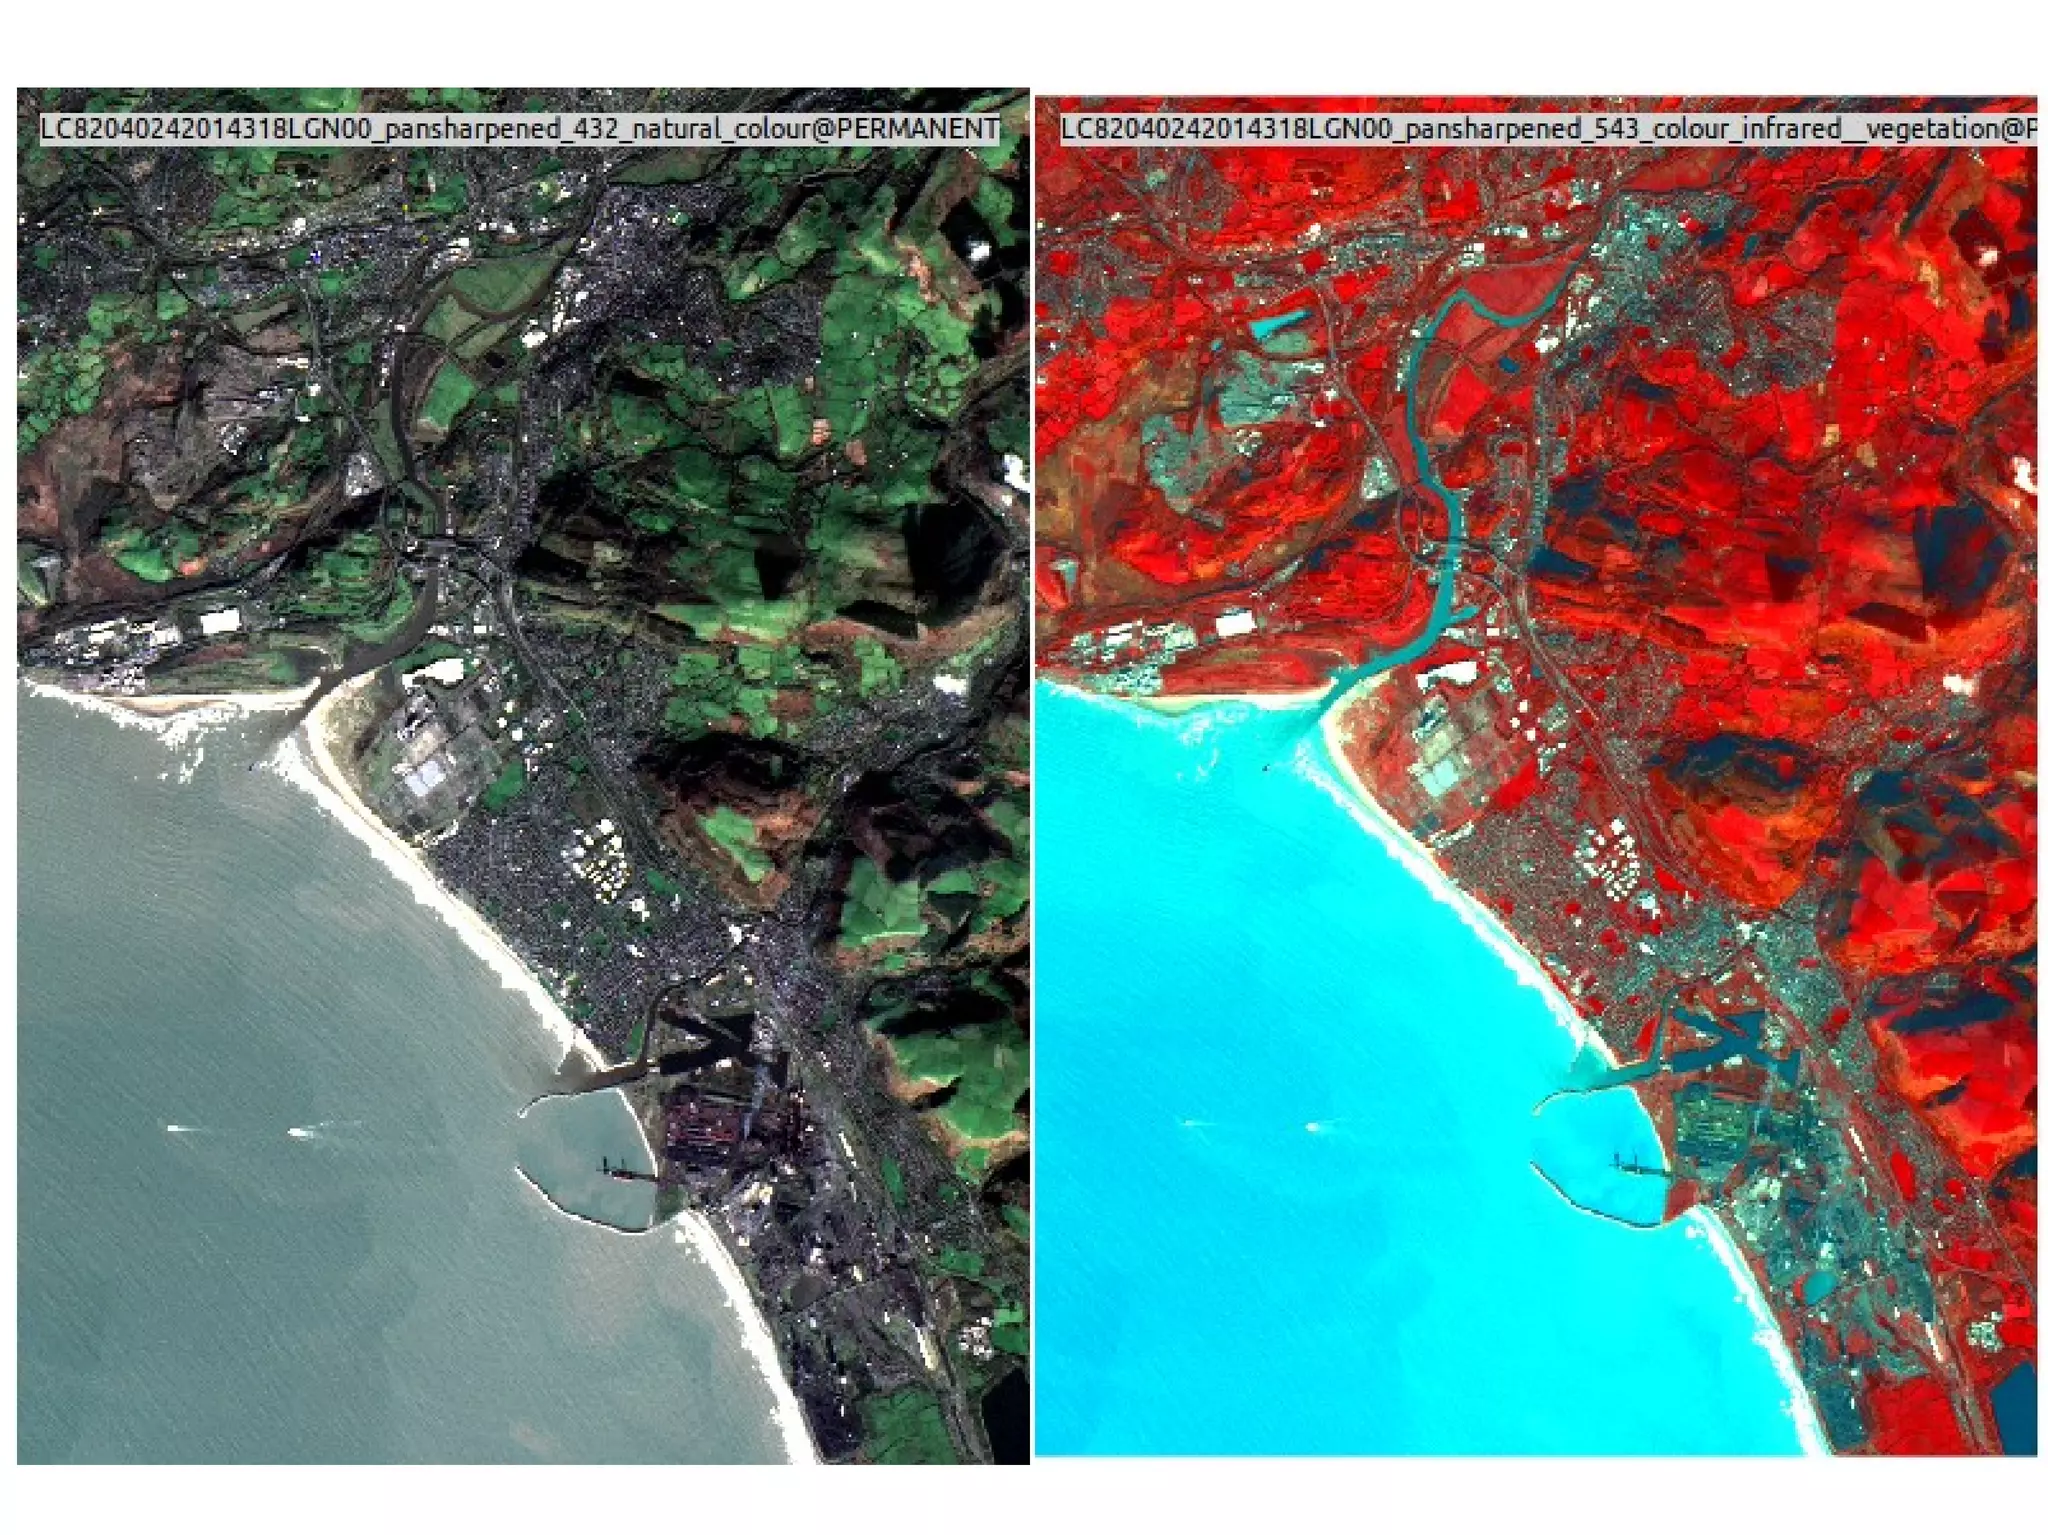


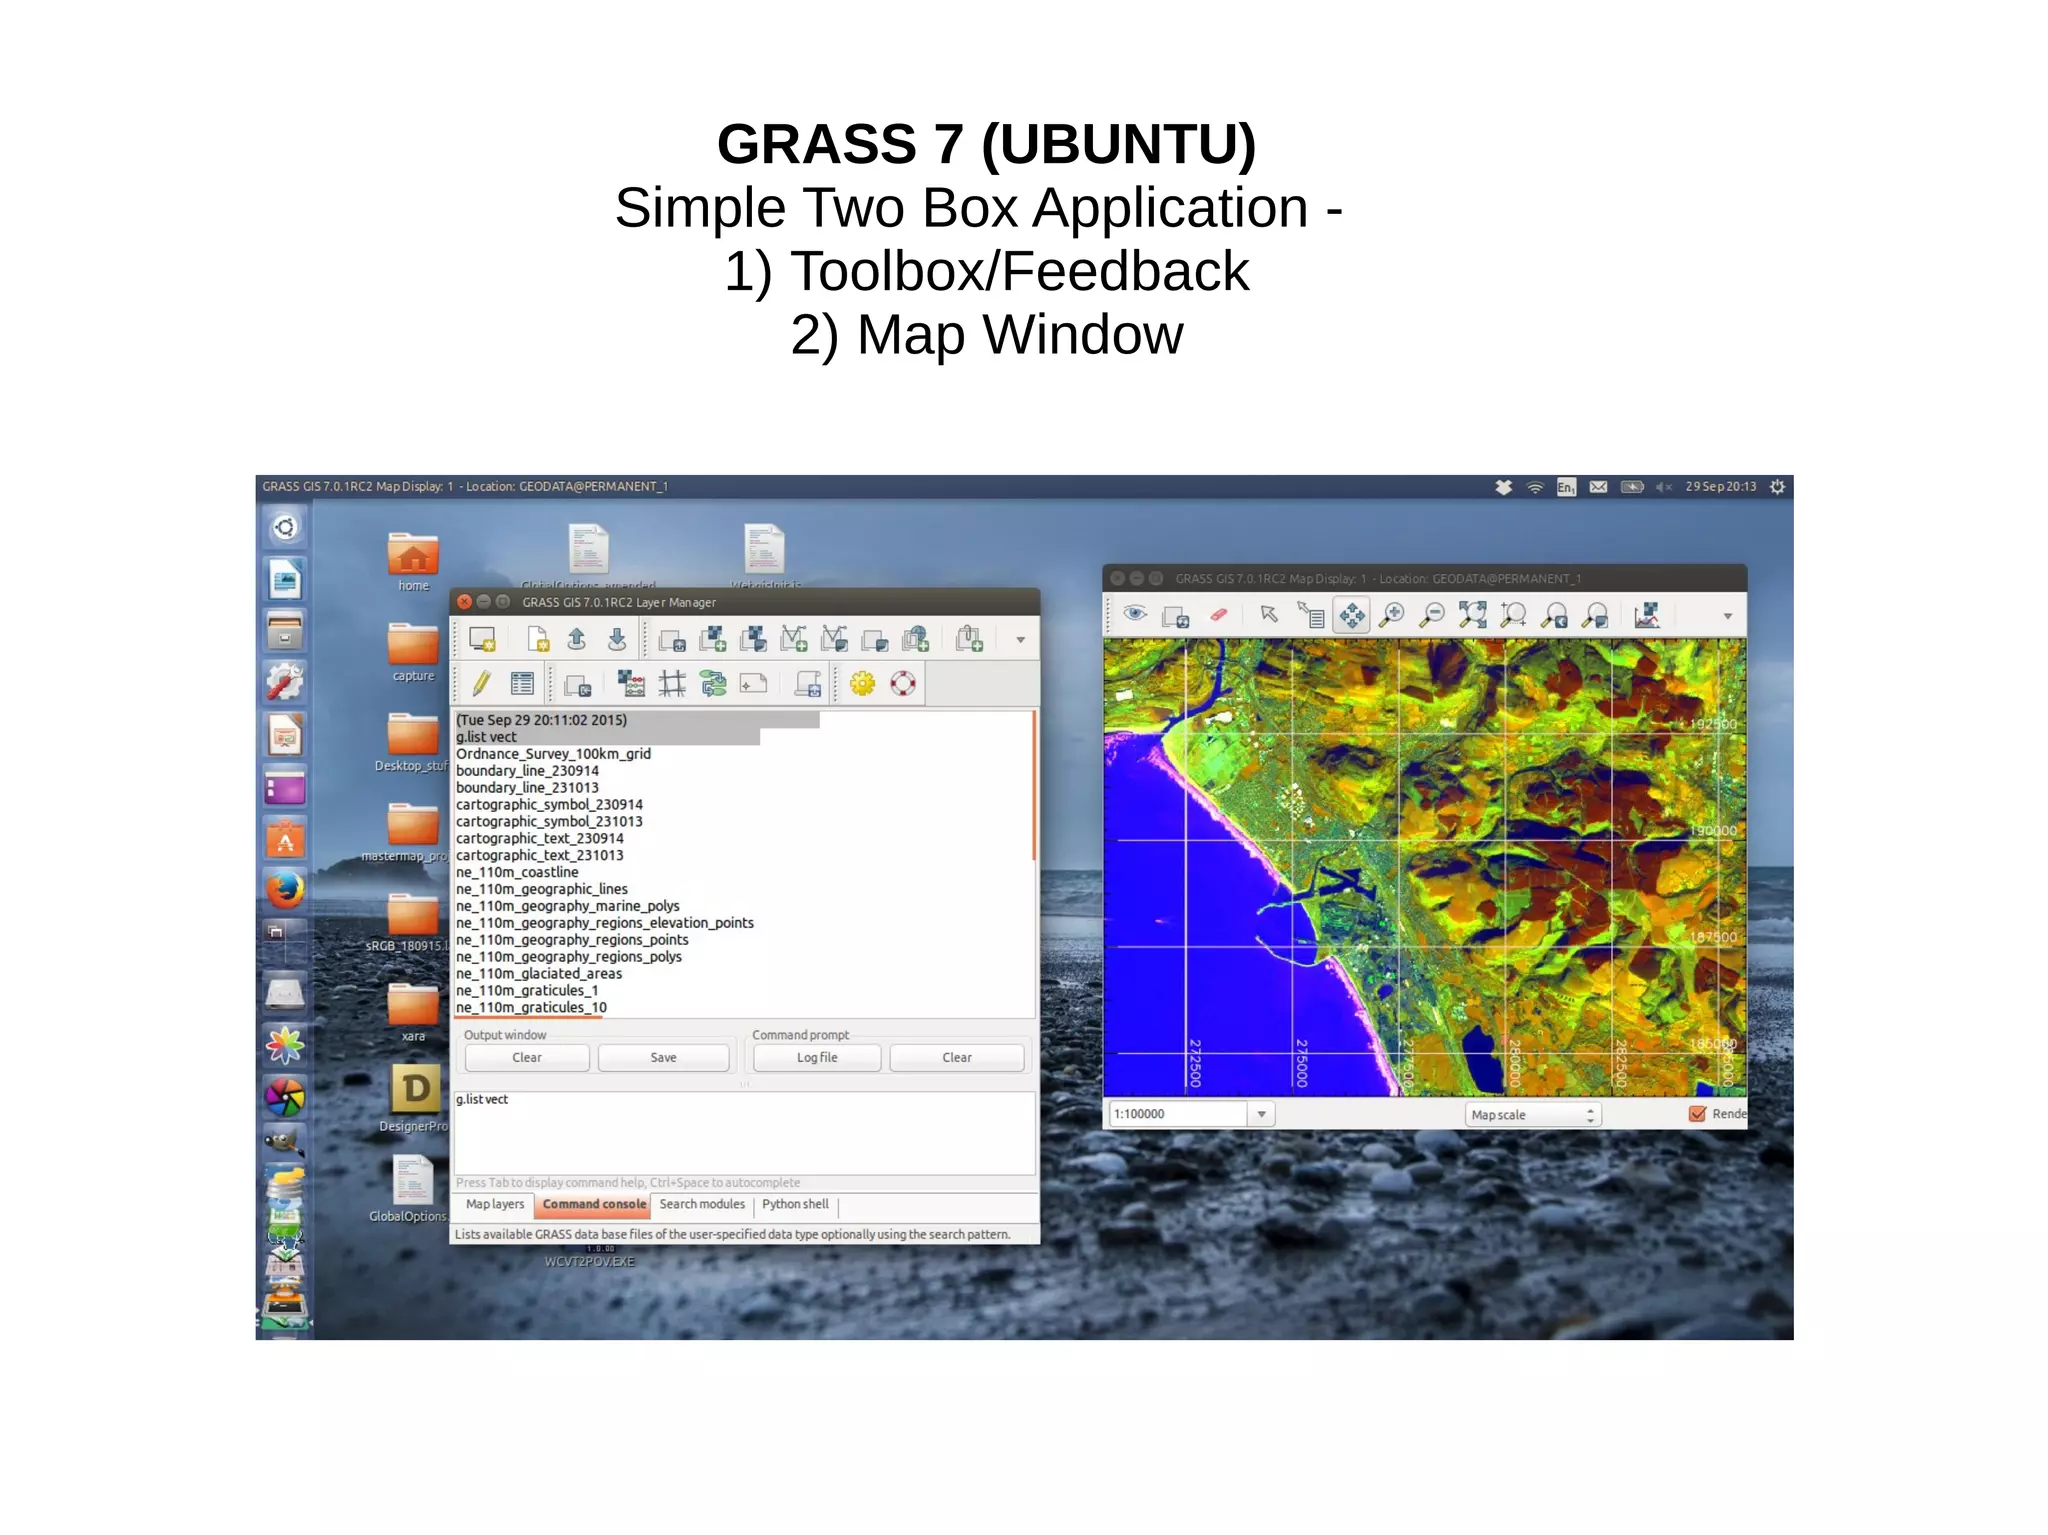


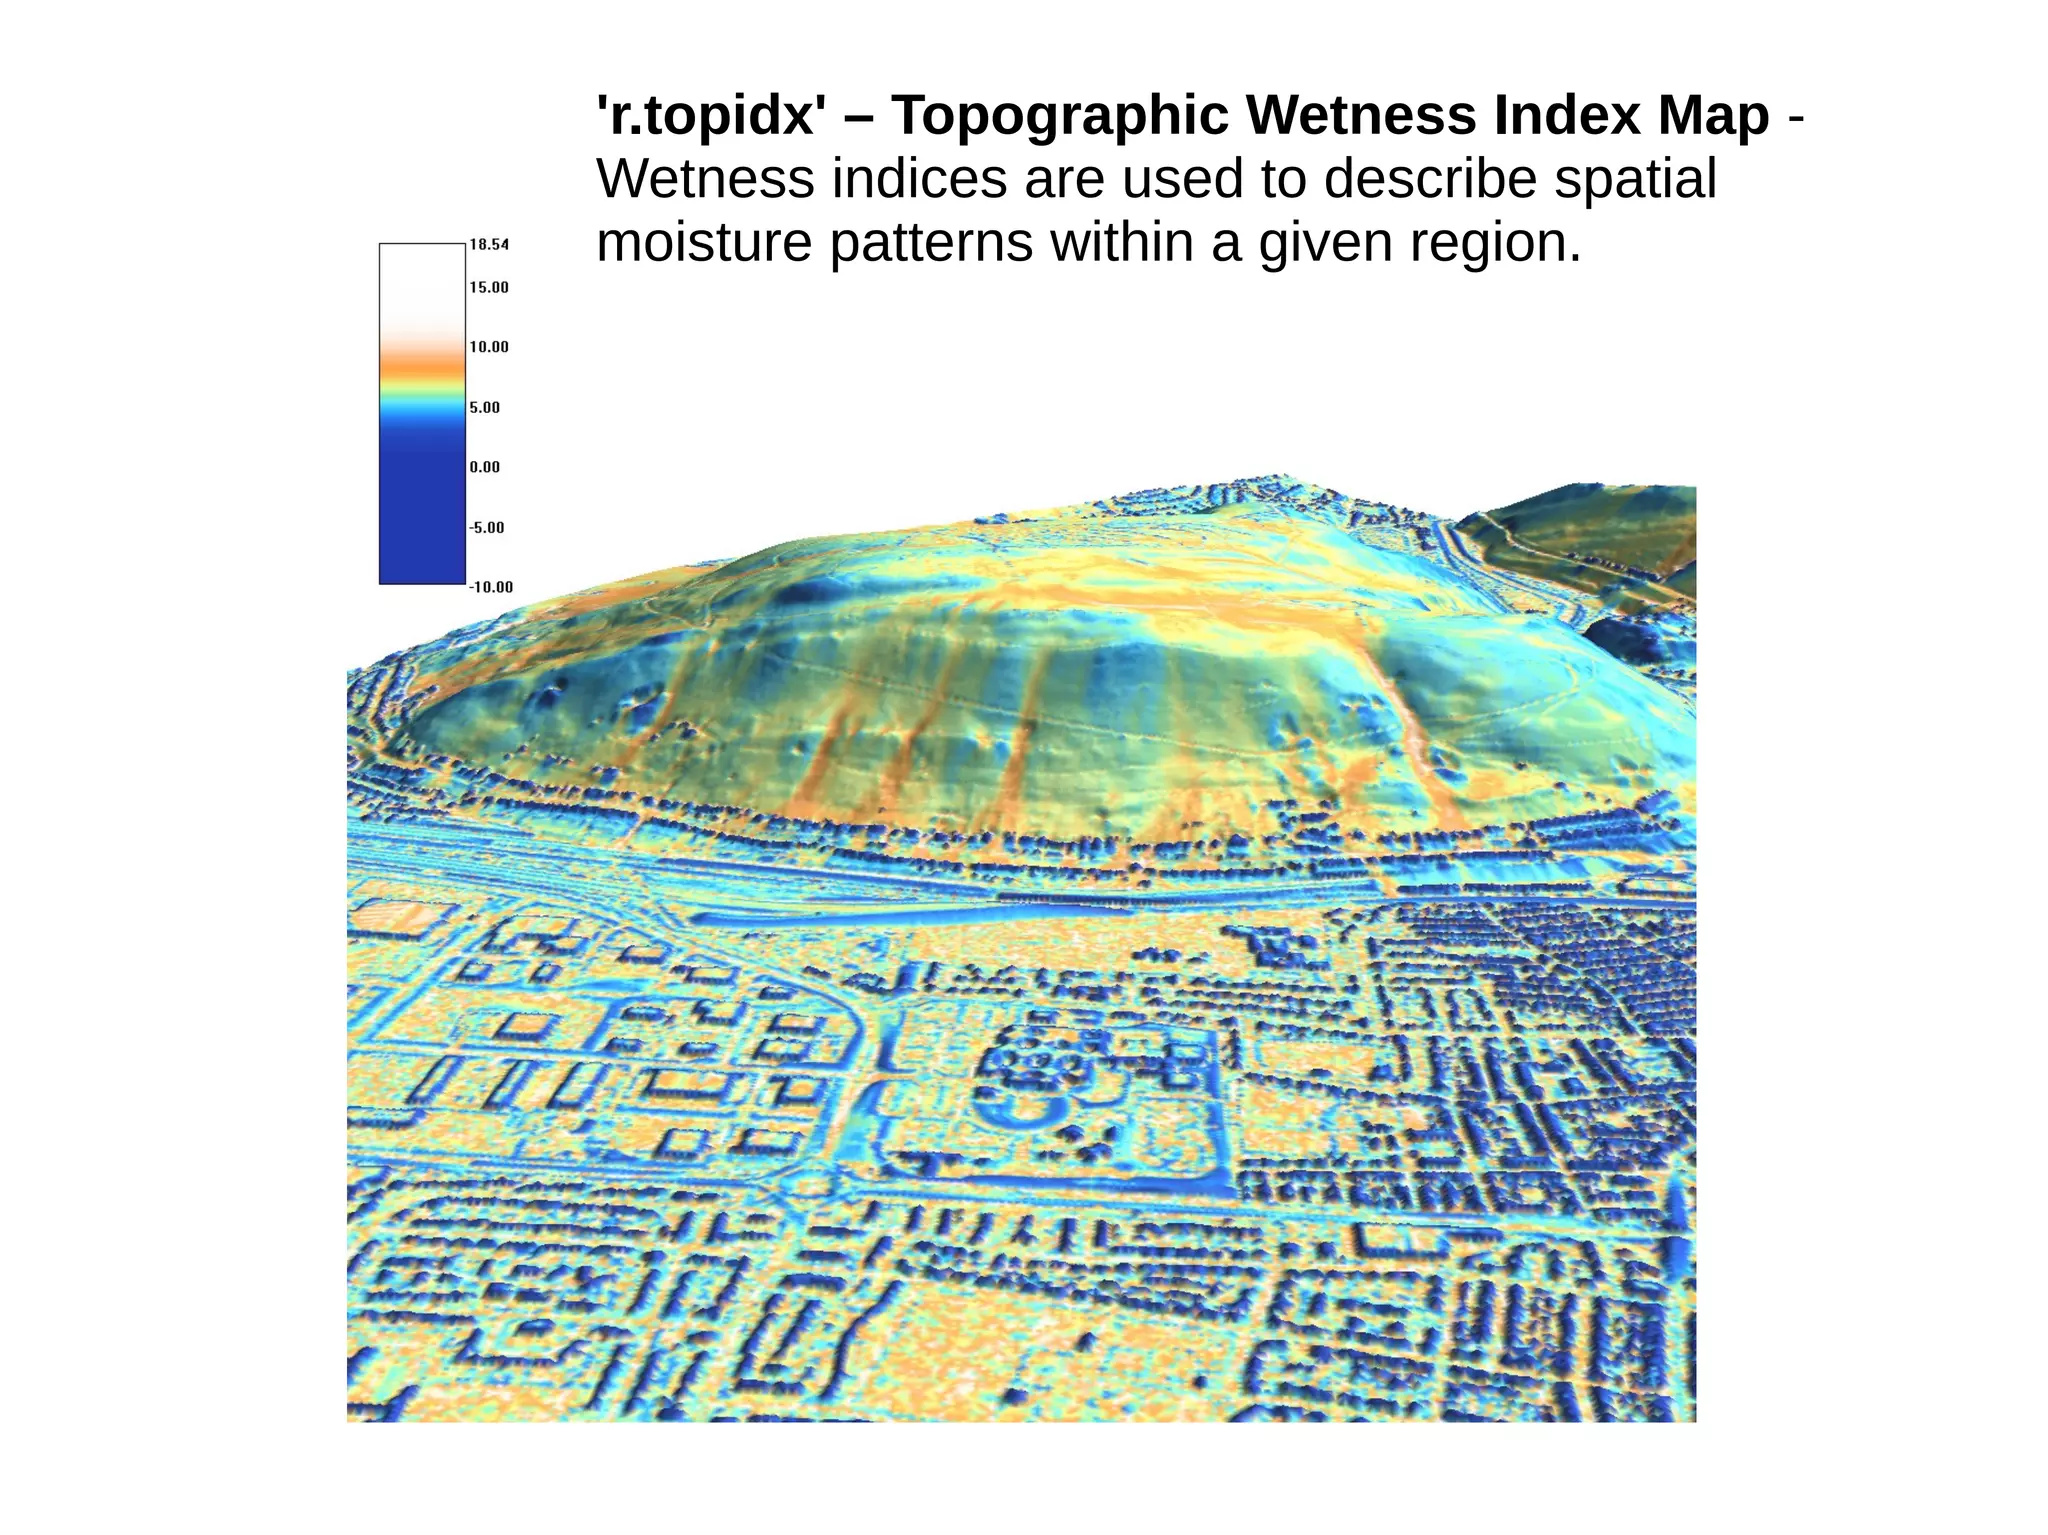

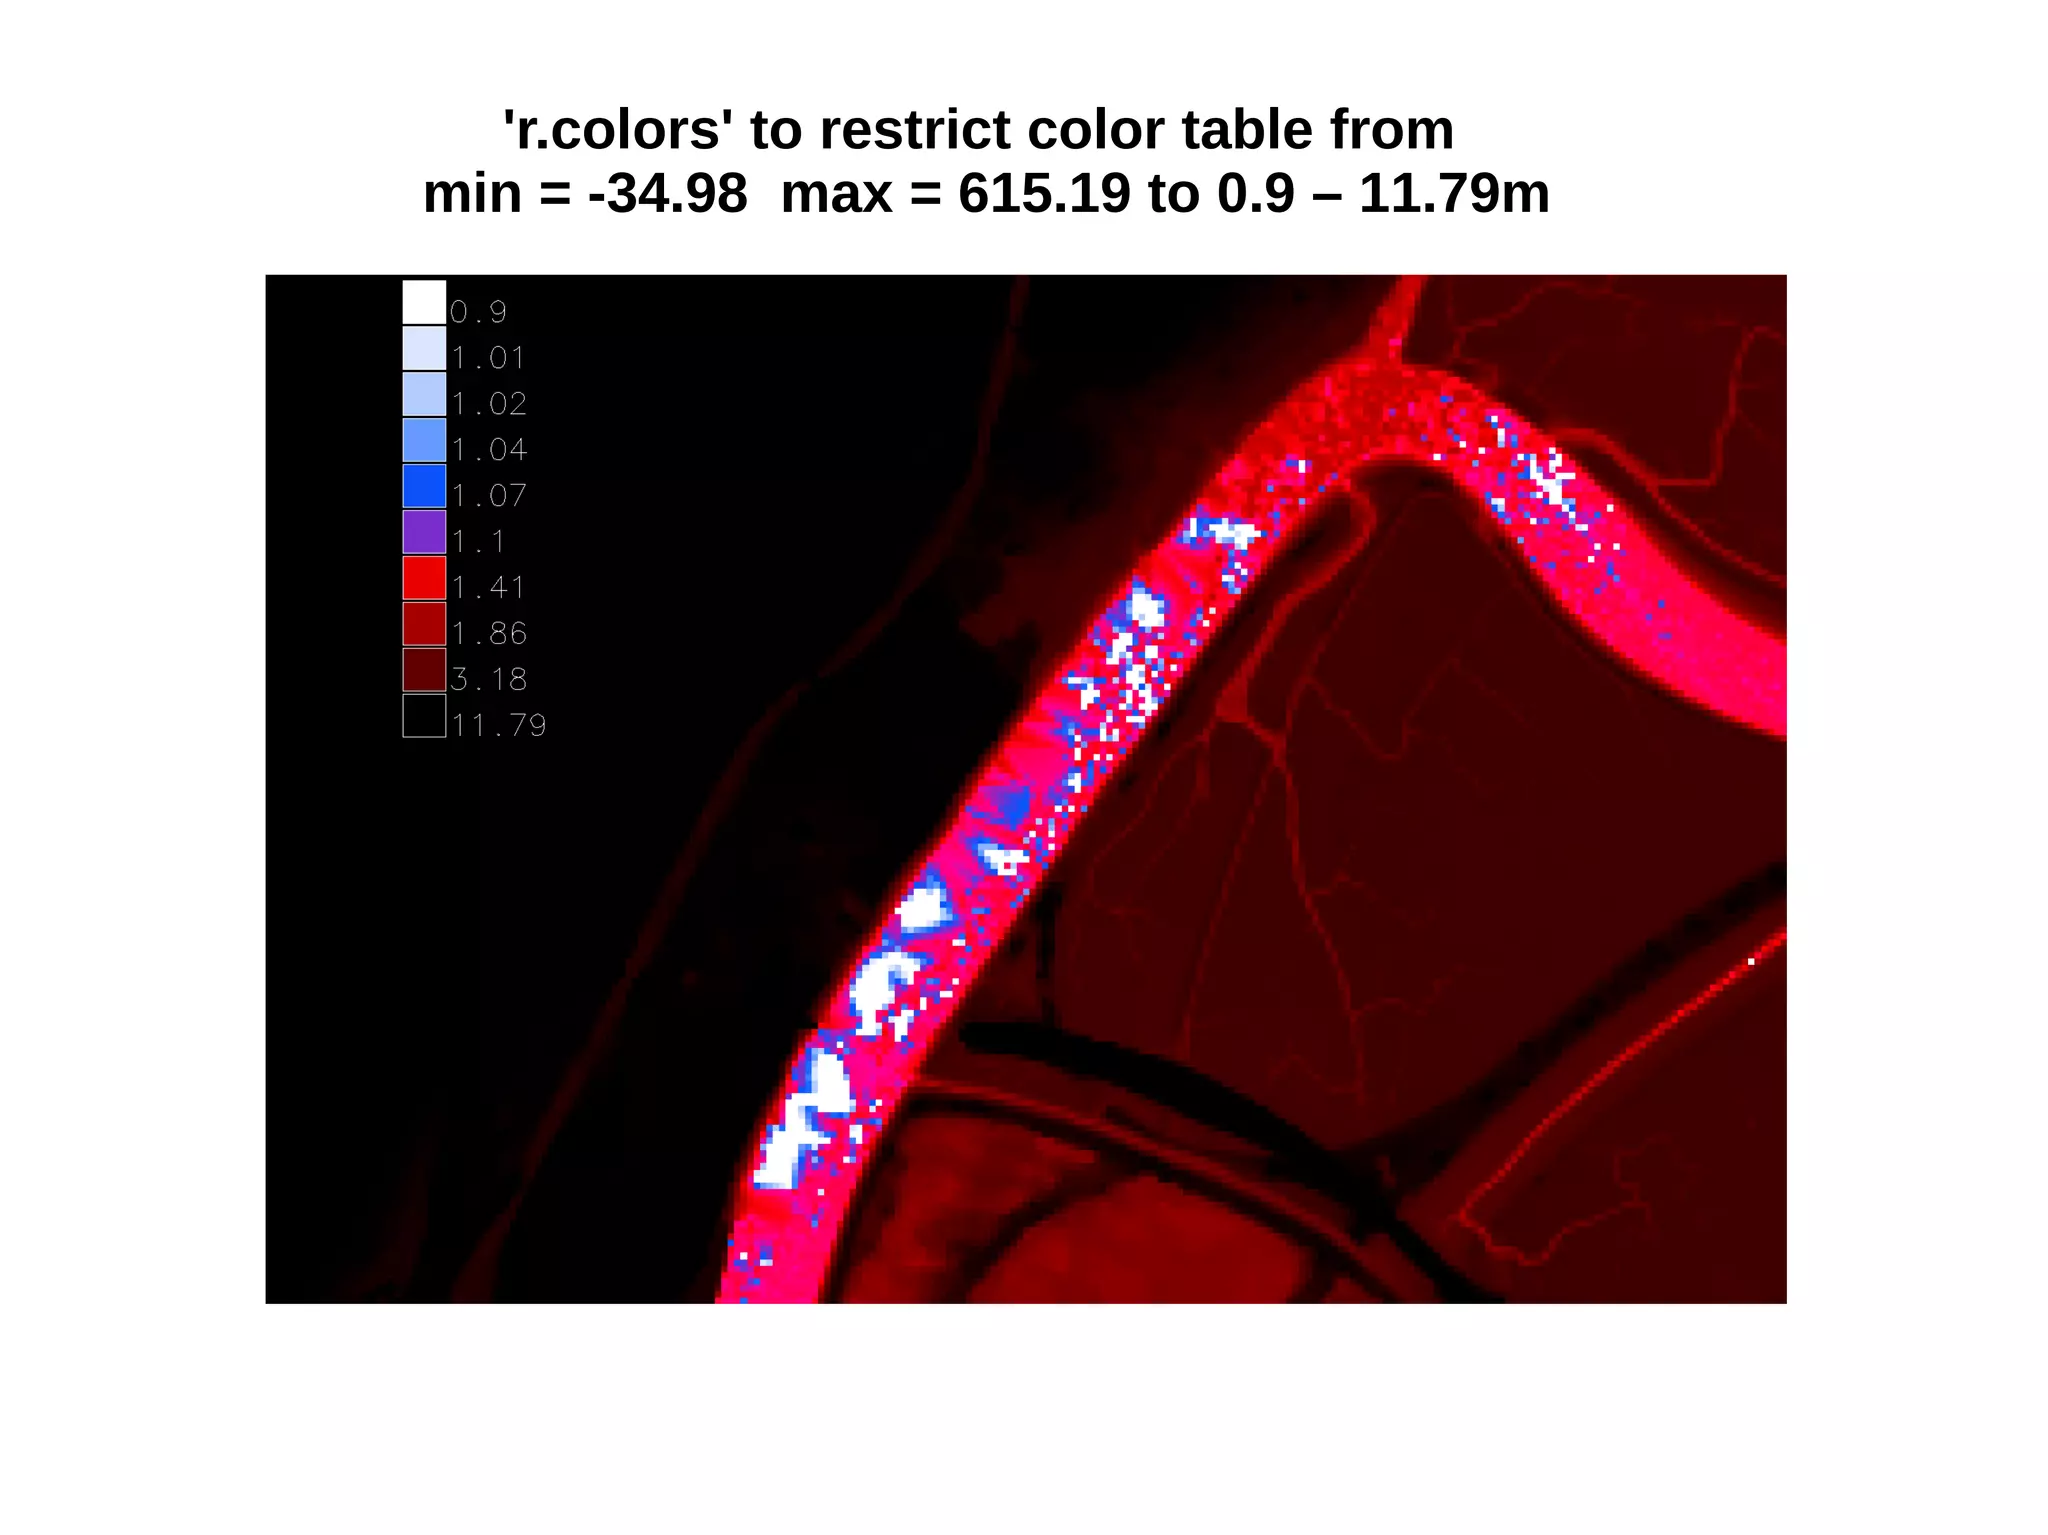
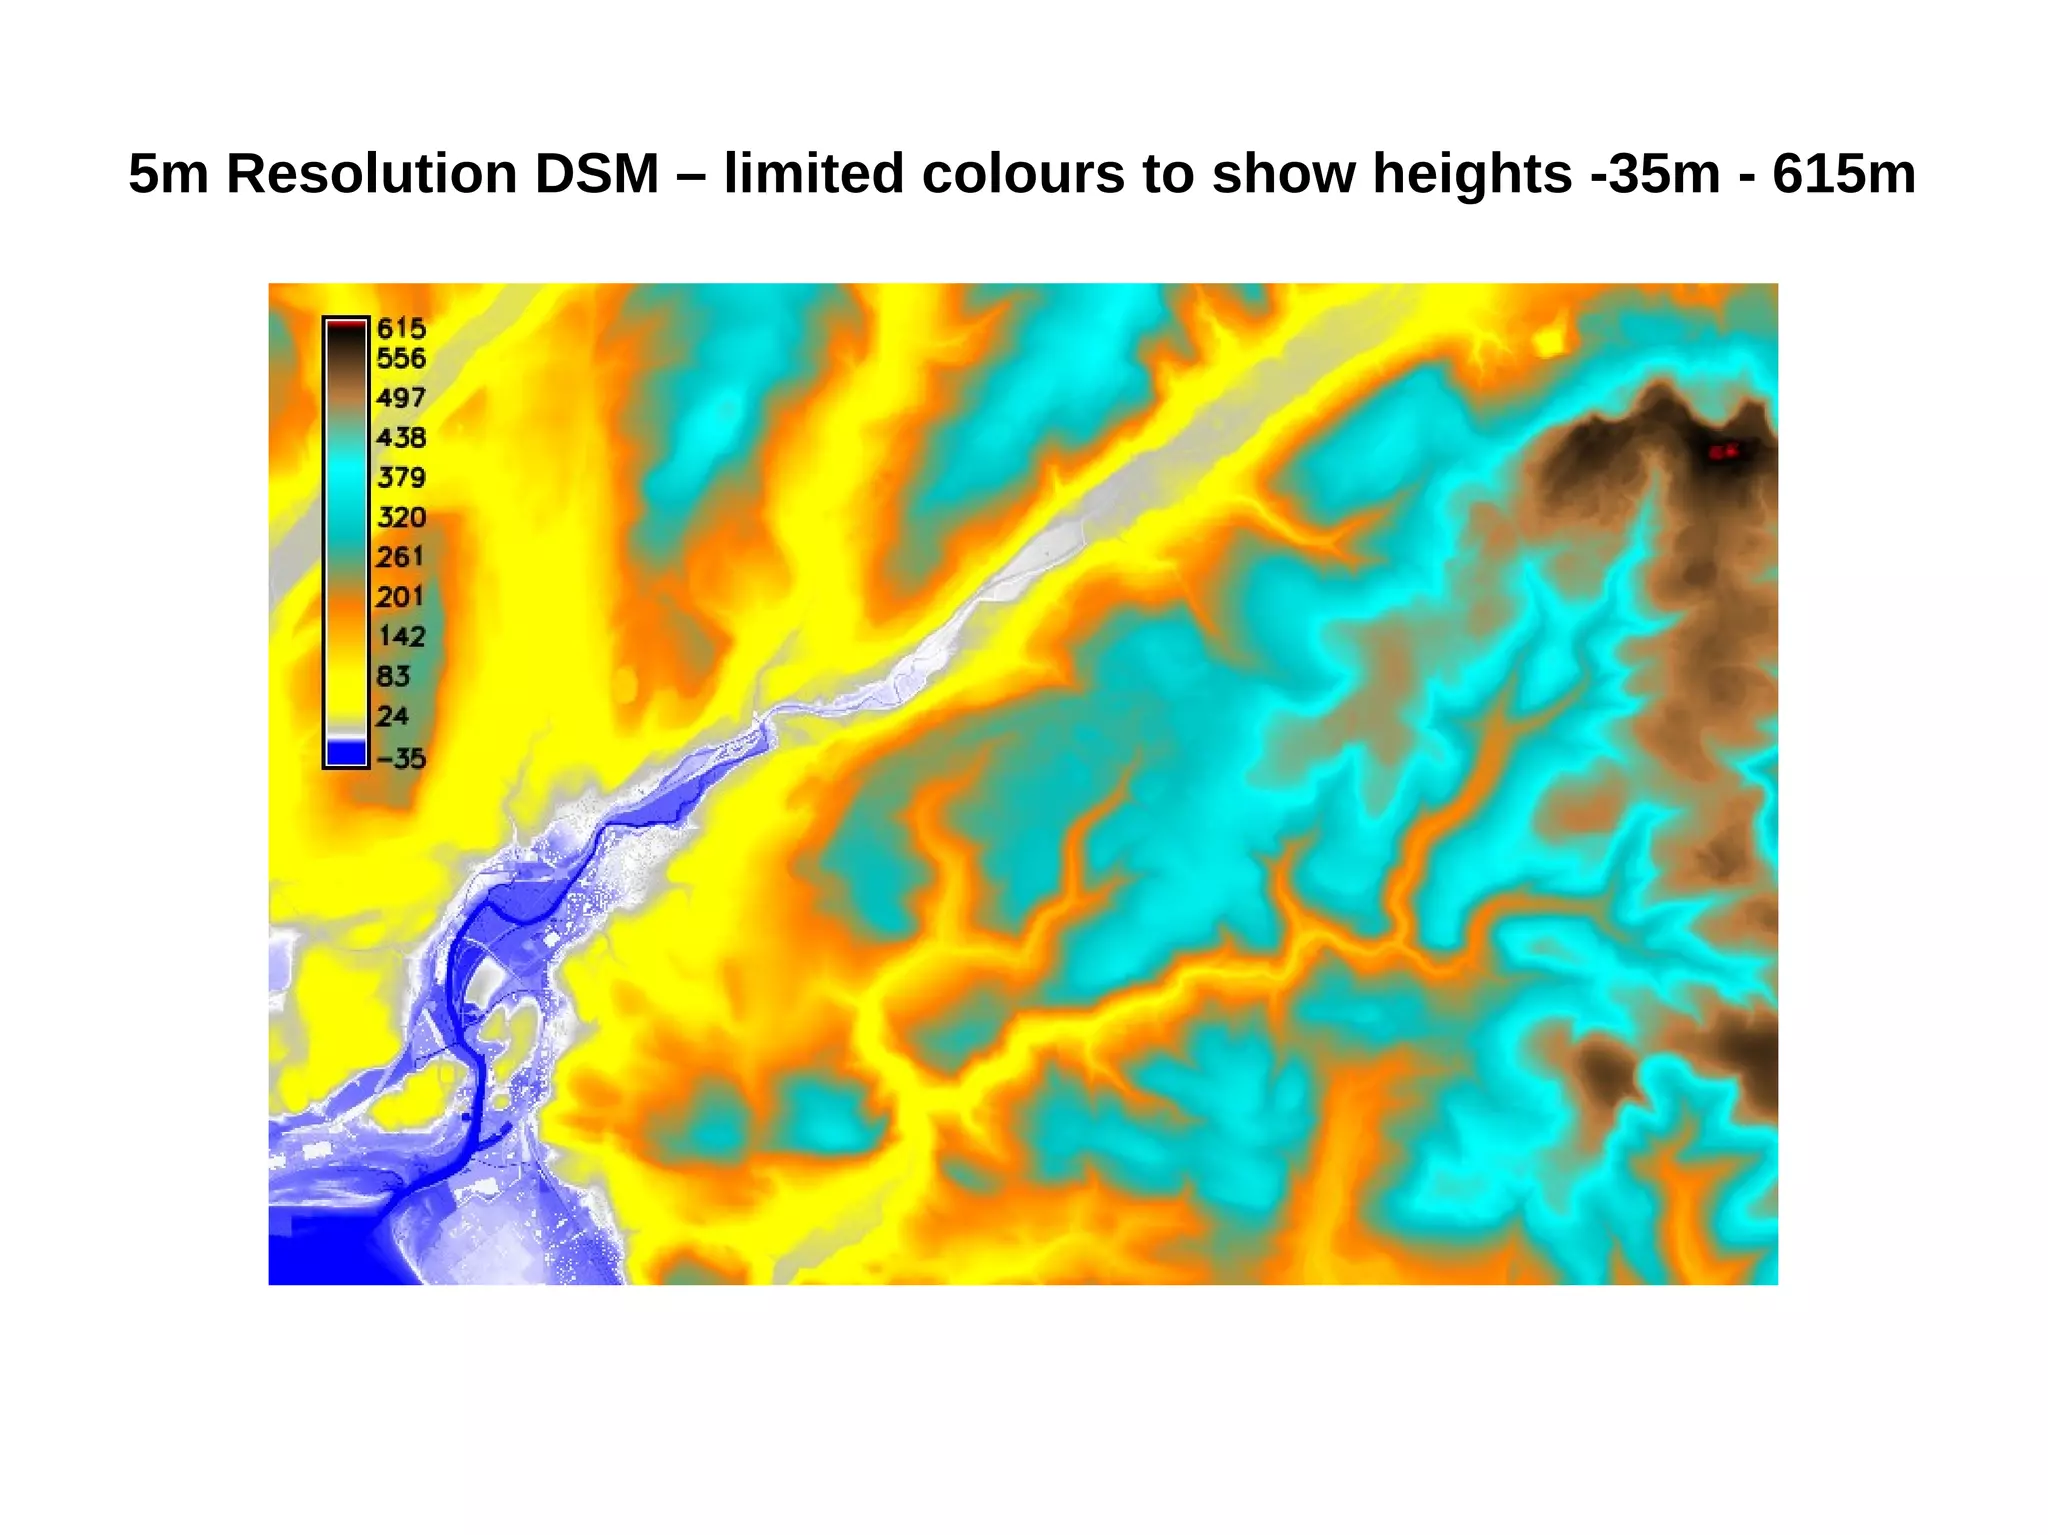
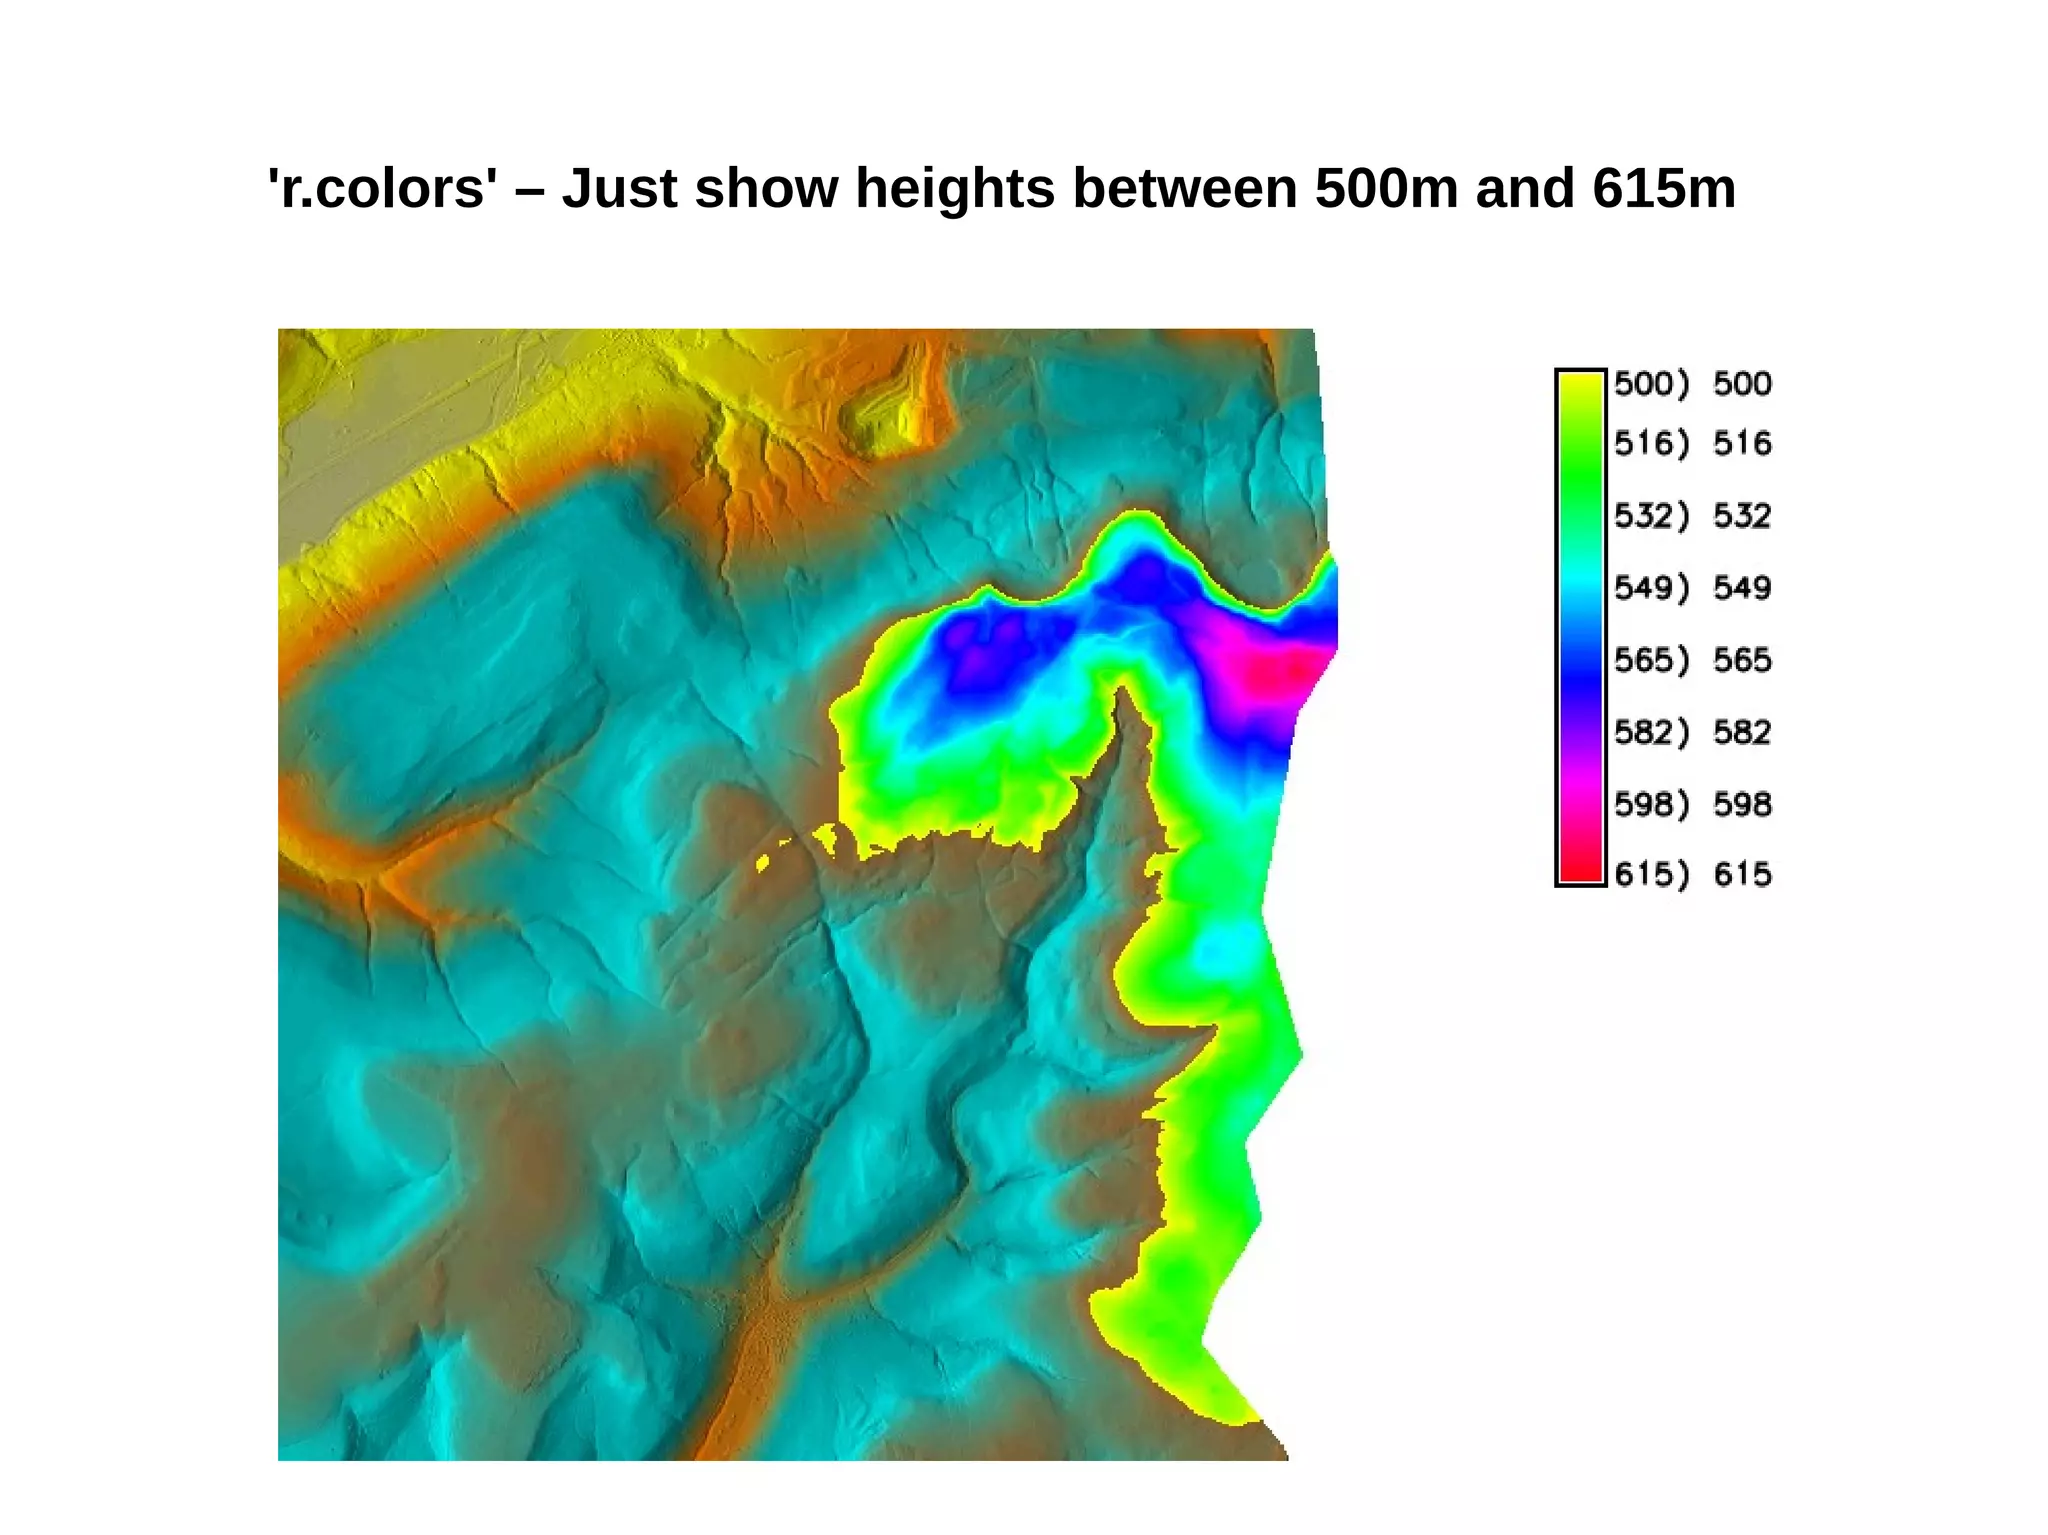
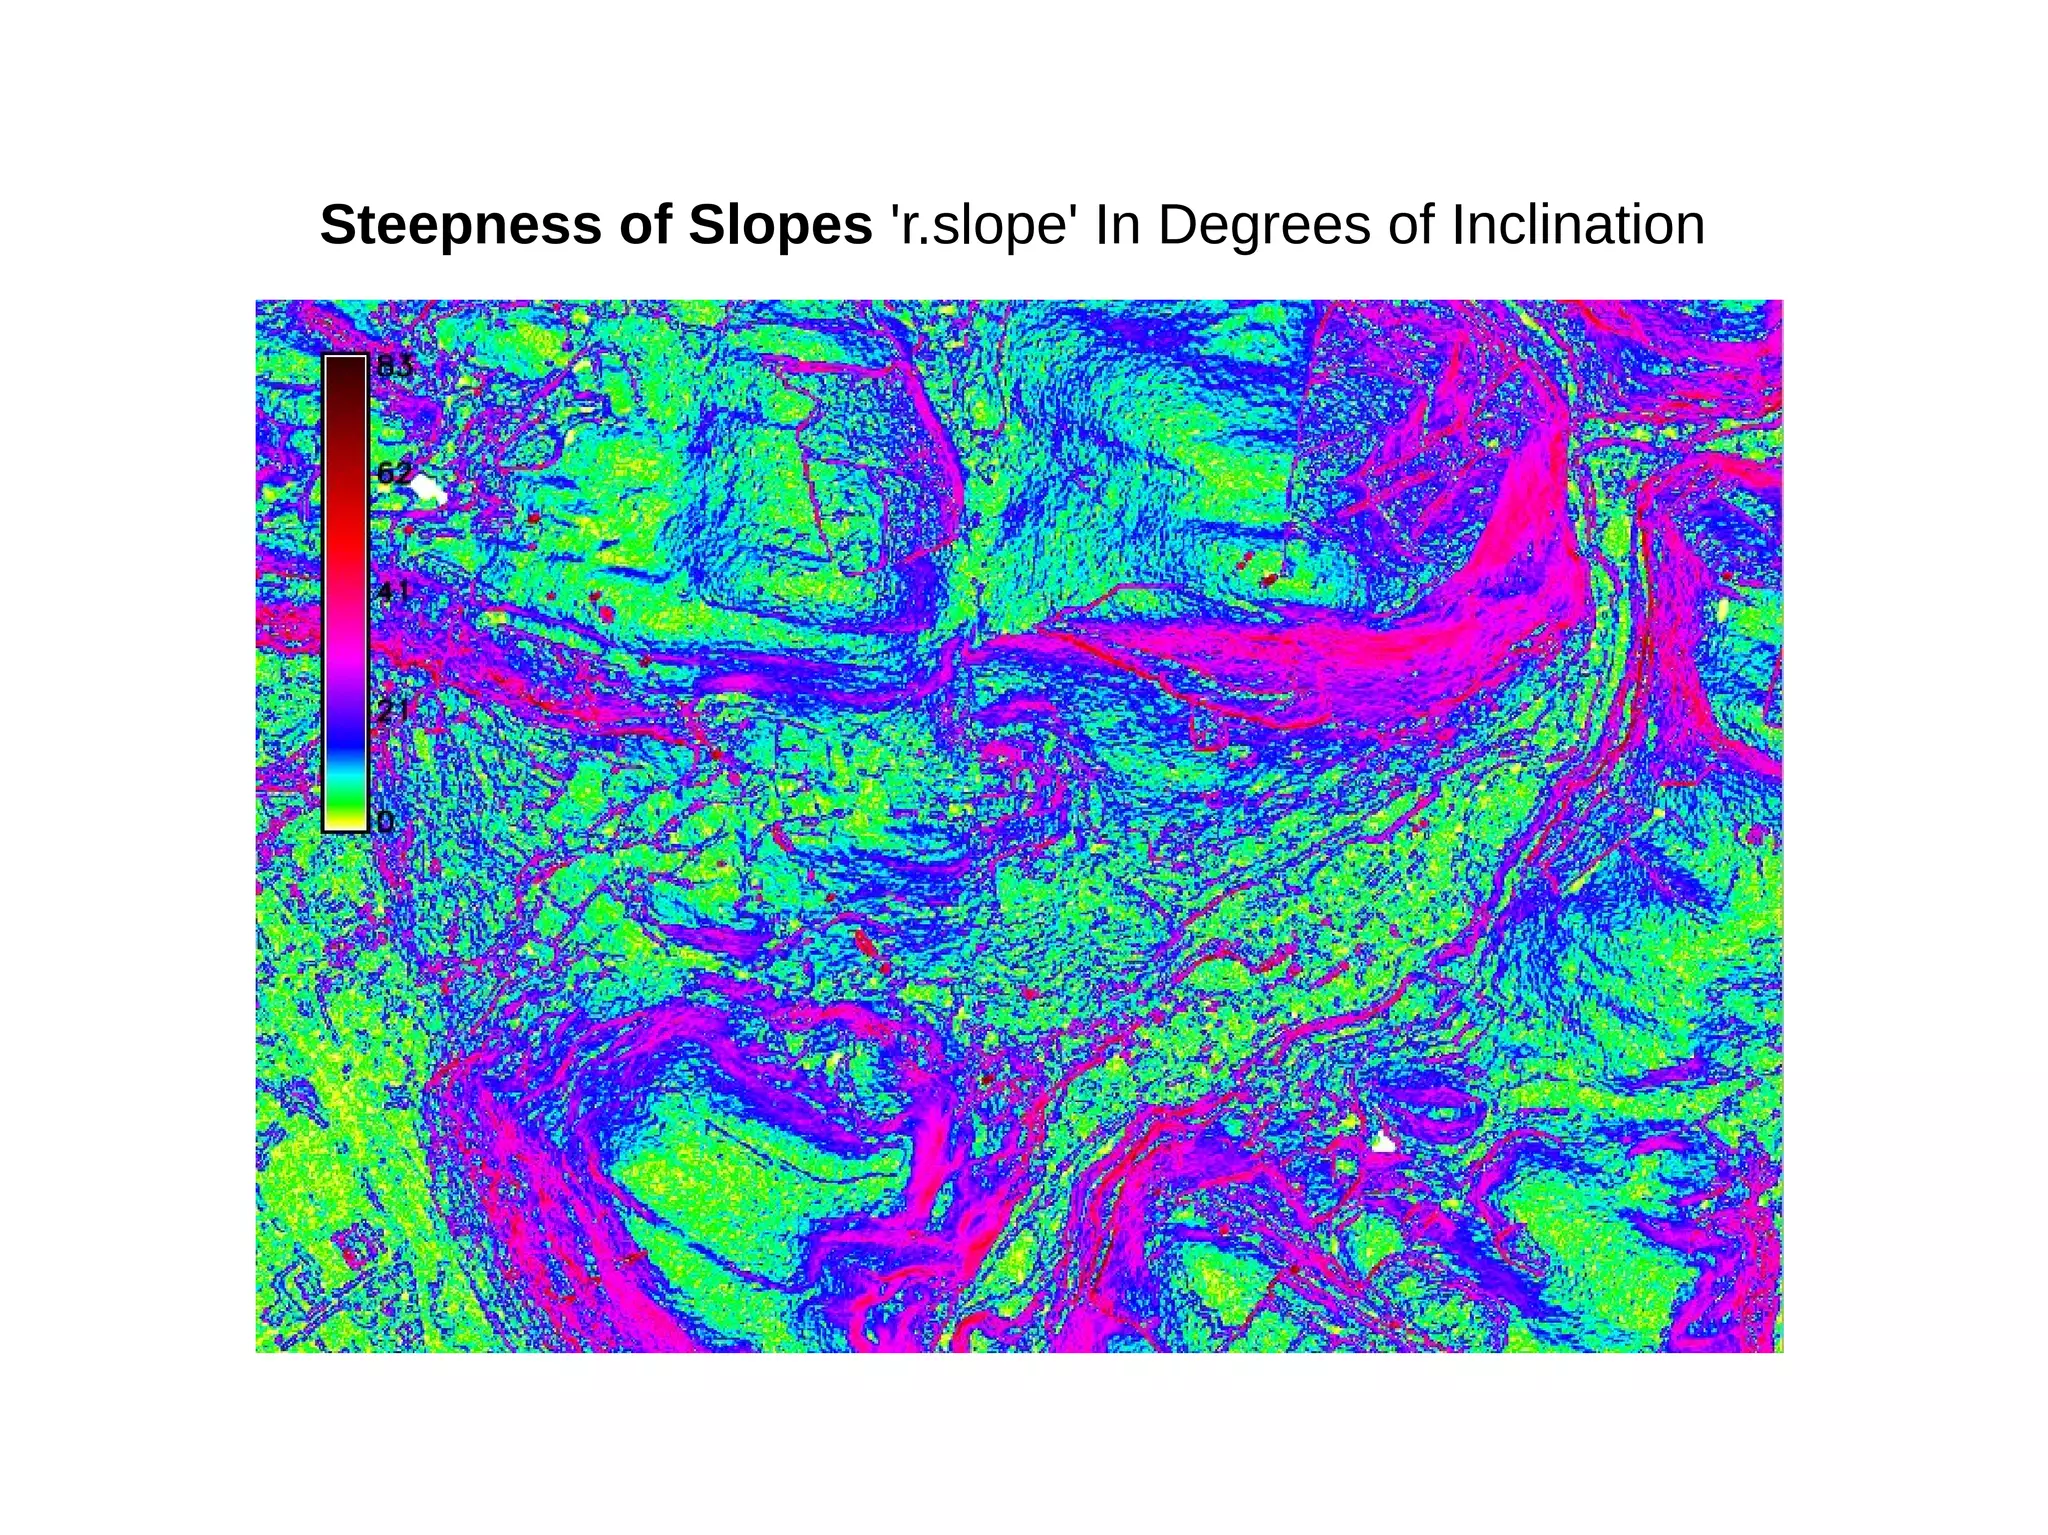
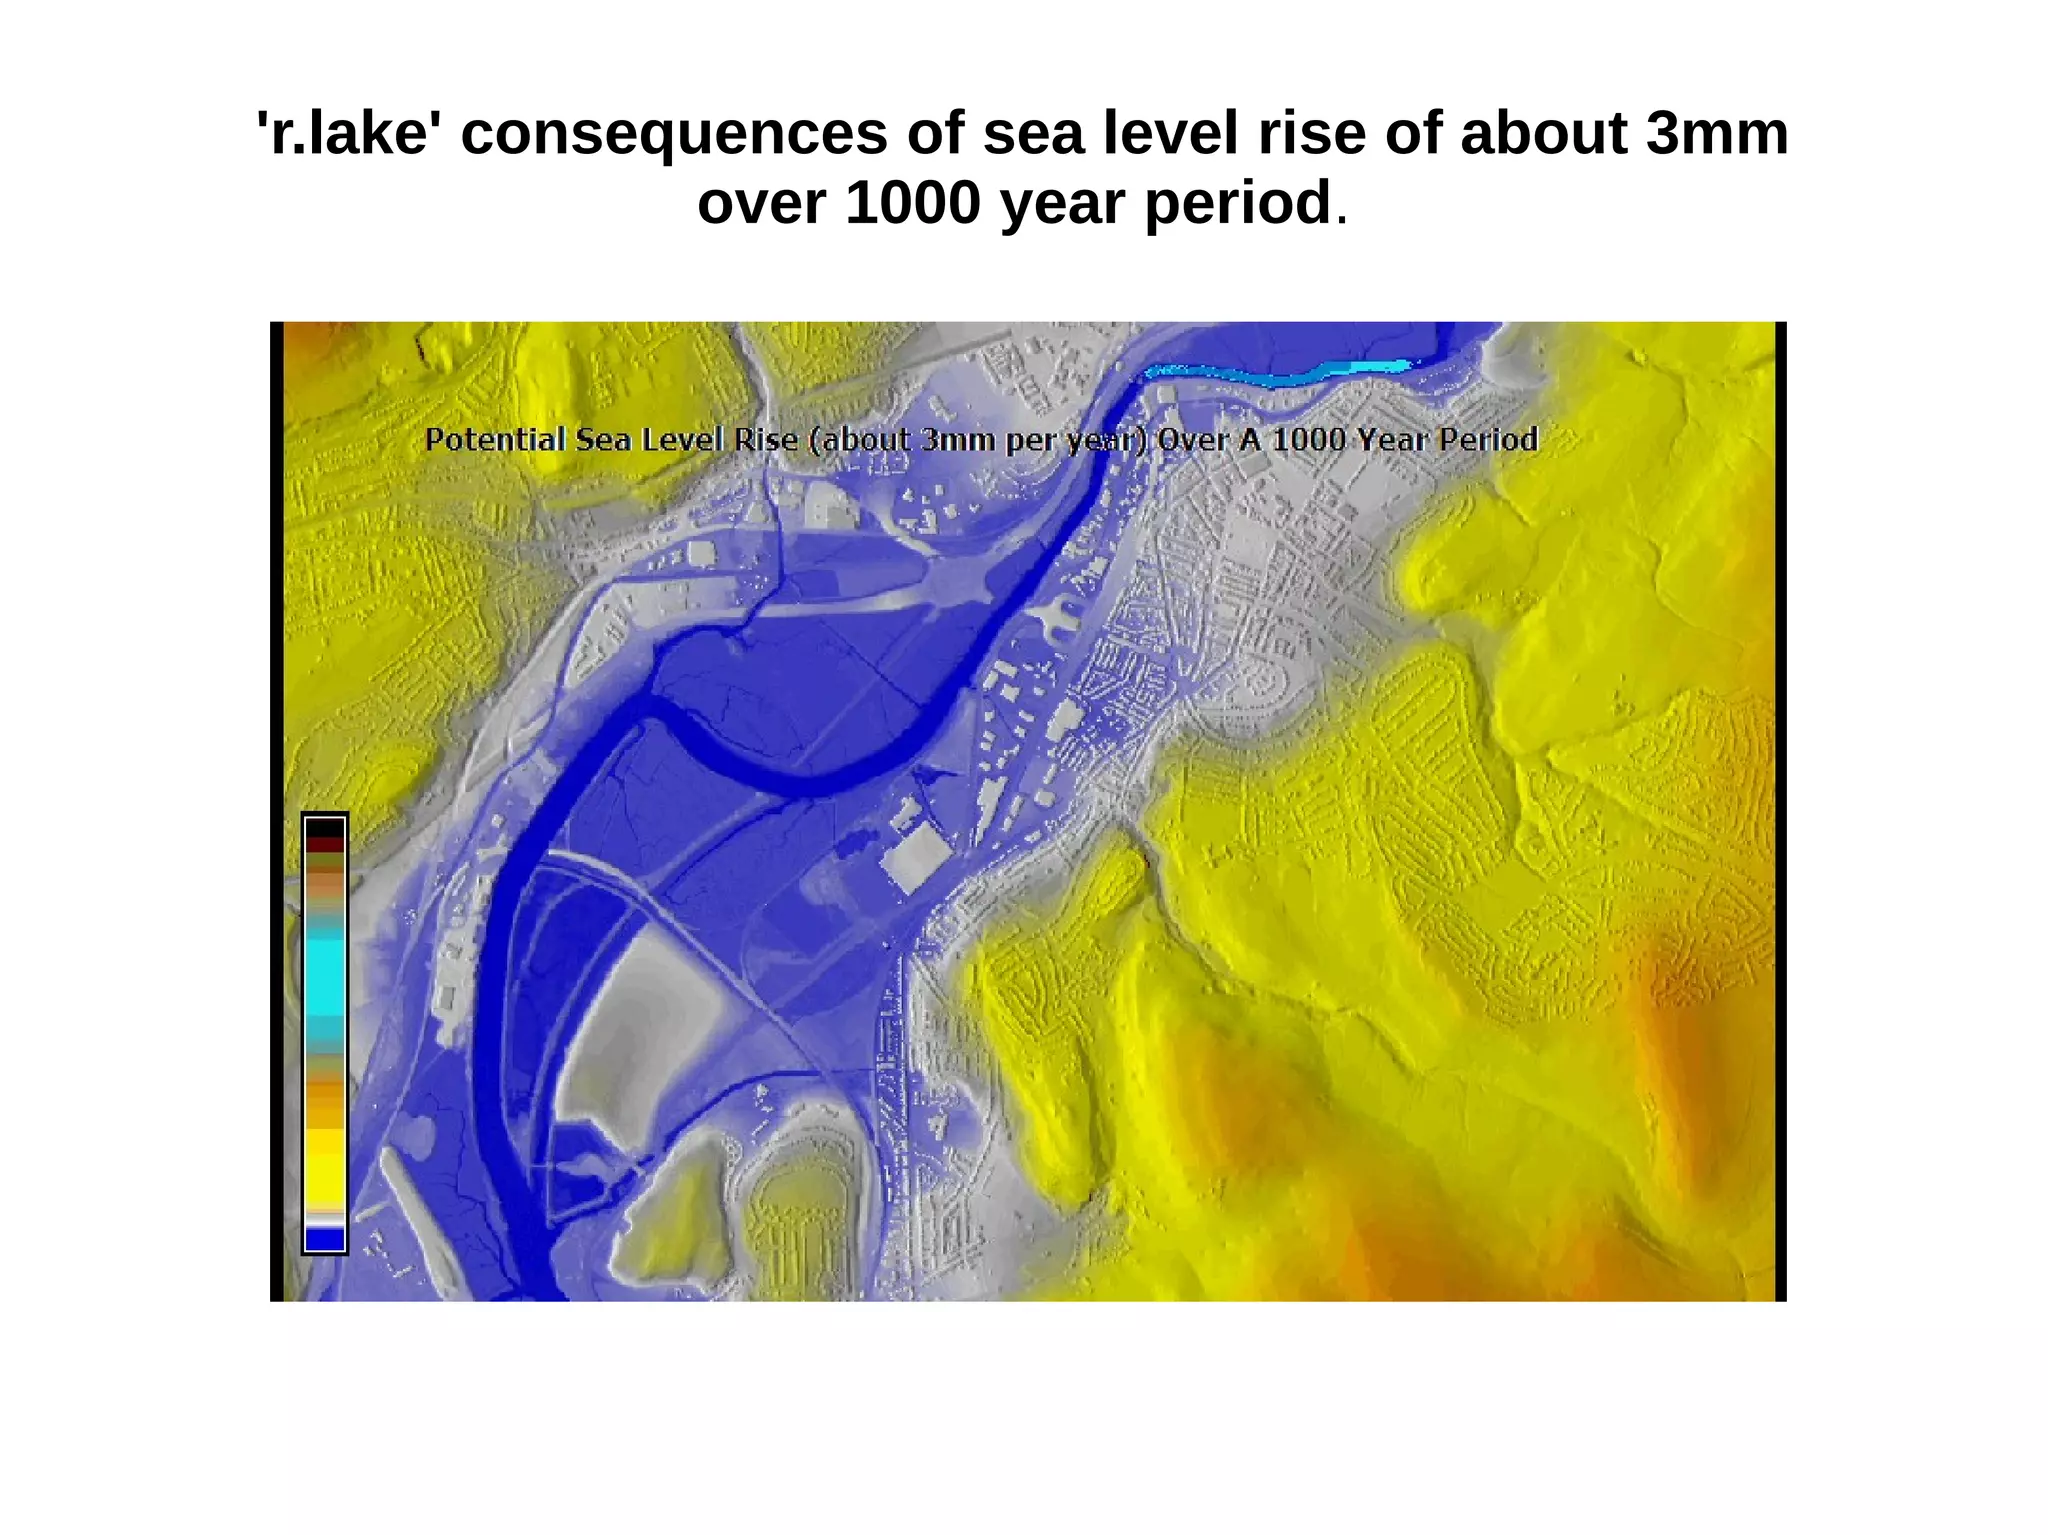
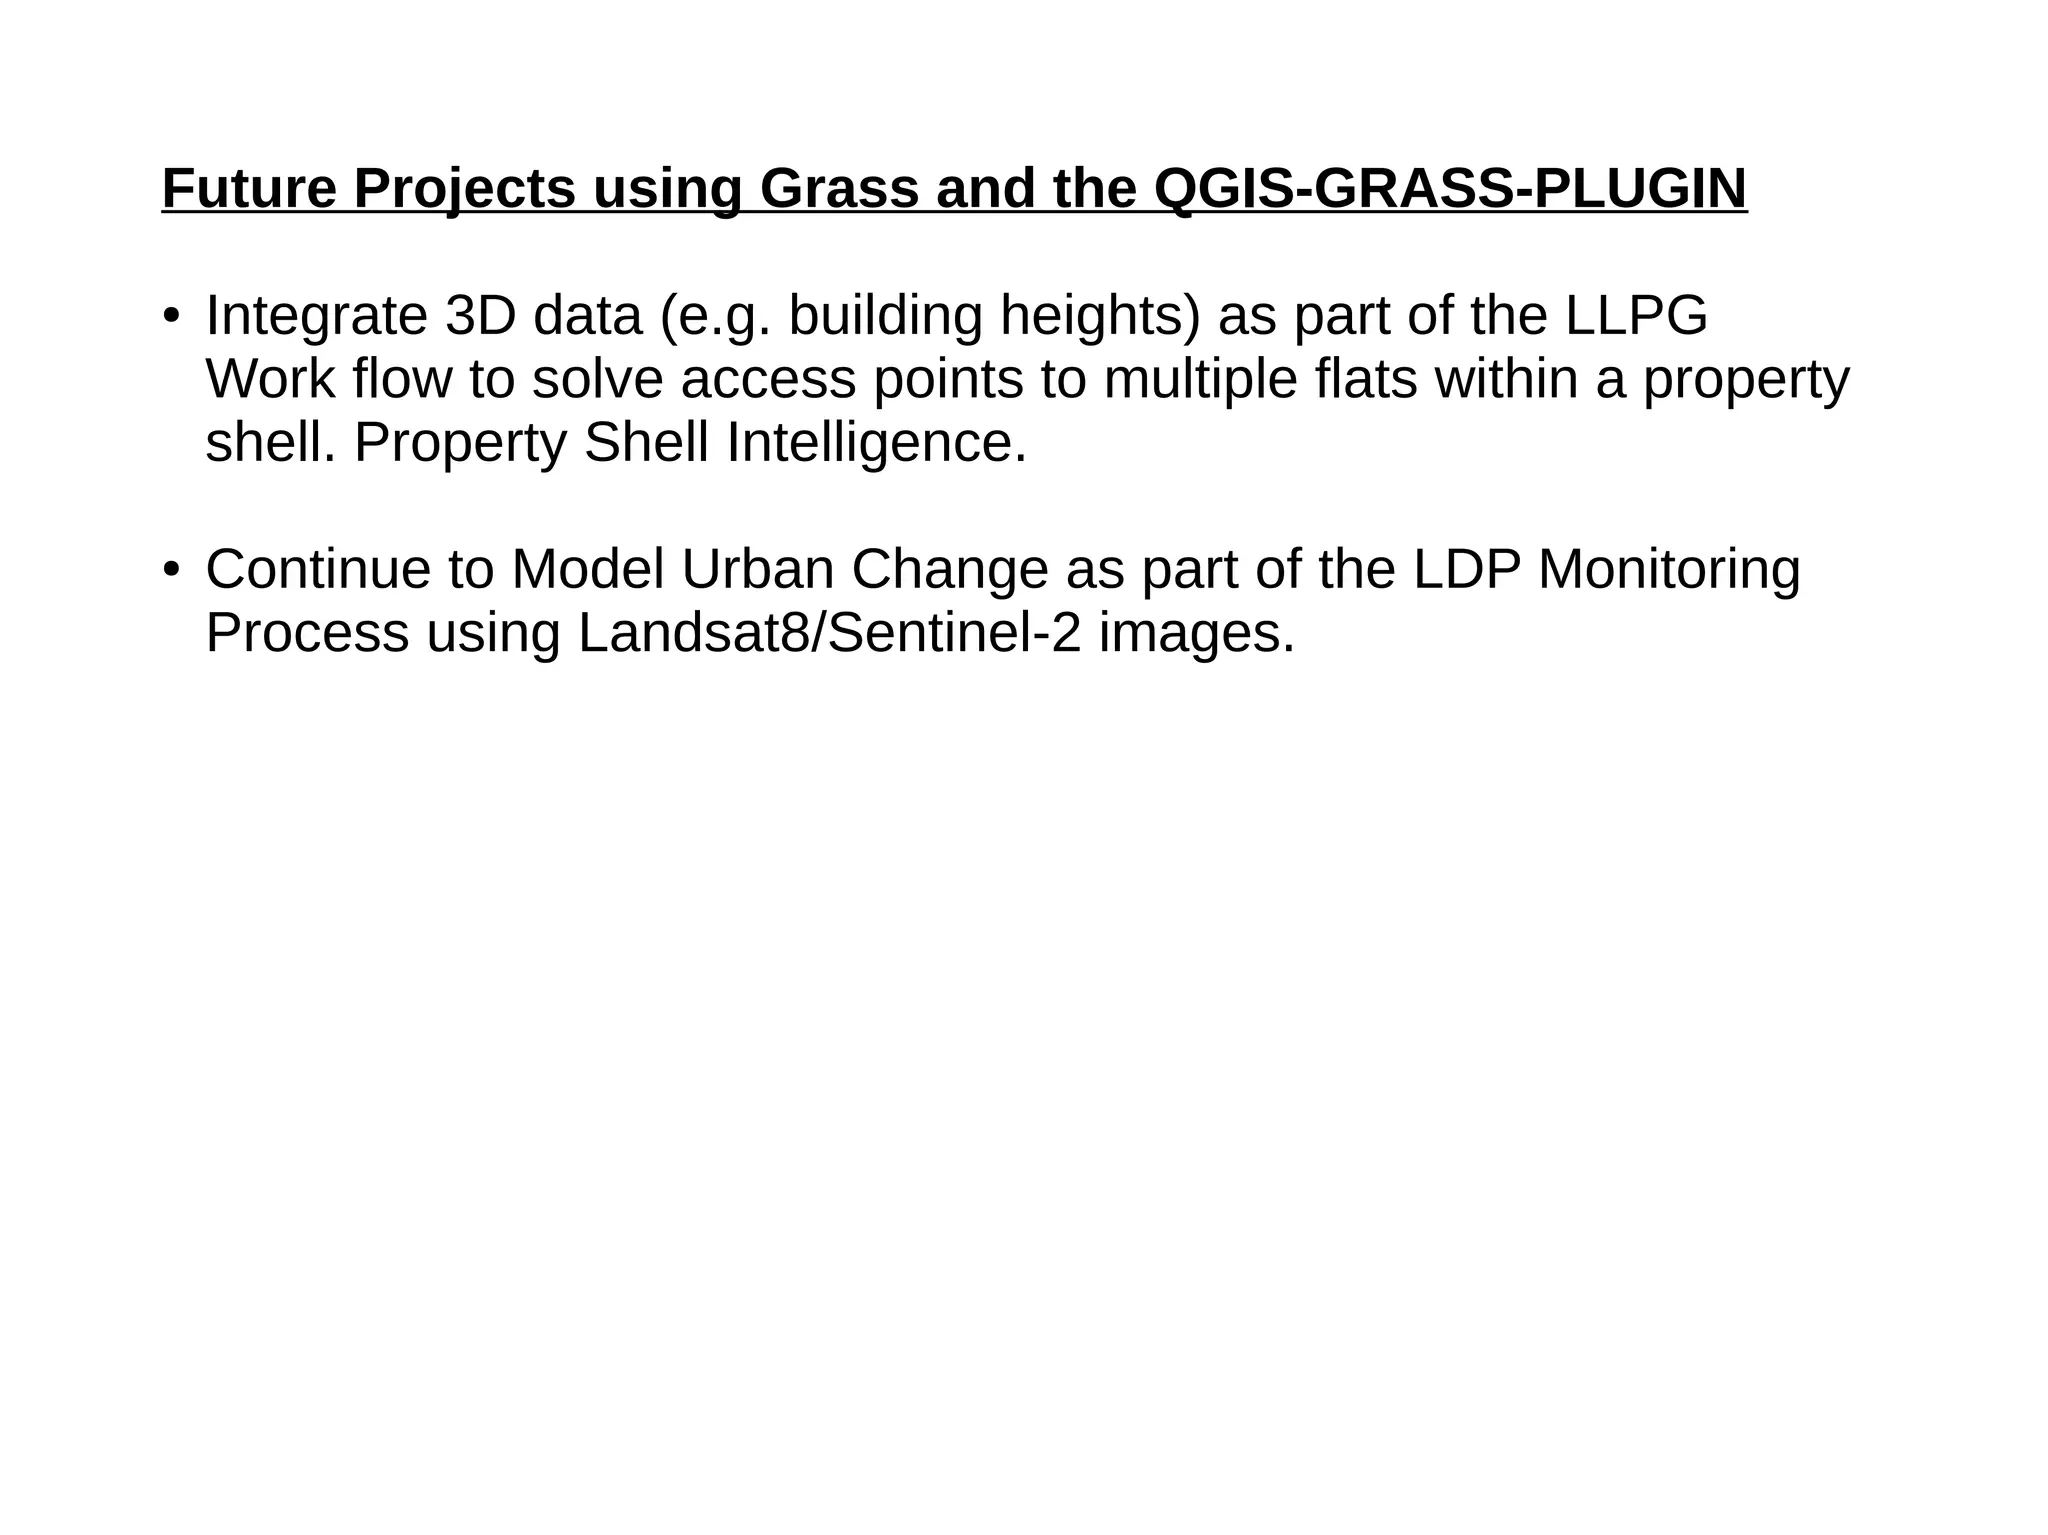


Paul Shapley gave a presentation on processing Landsat 8 multi-spectral images with GRASS tools and the potential of the QGIS-GRASS plugin. He discussed his background and work with QGIS and GRASS for mapping at Neath Port Talbot Borough Planning Department. He provided an overview of Landsat 8 data and demonstrated using GRASS modules to classify Landsat images and analyze changes over time. Shapley also discussed advantages and updates to the QGIS-GRASS plugin, and future projects using GRASS and 3D data for his local development plan monitoring and property mapping.