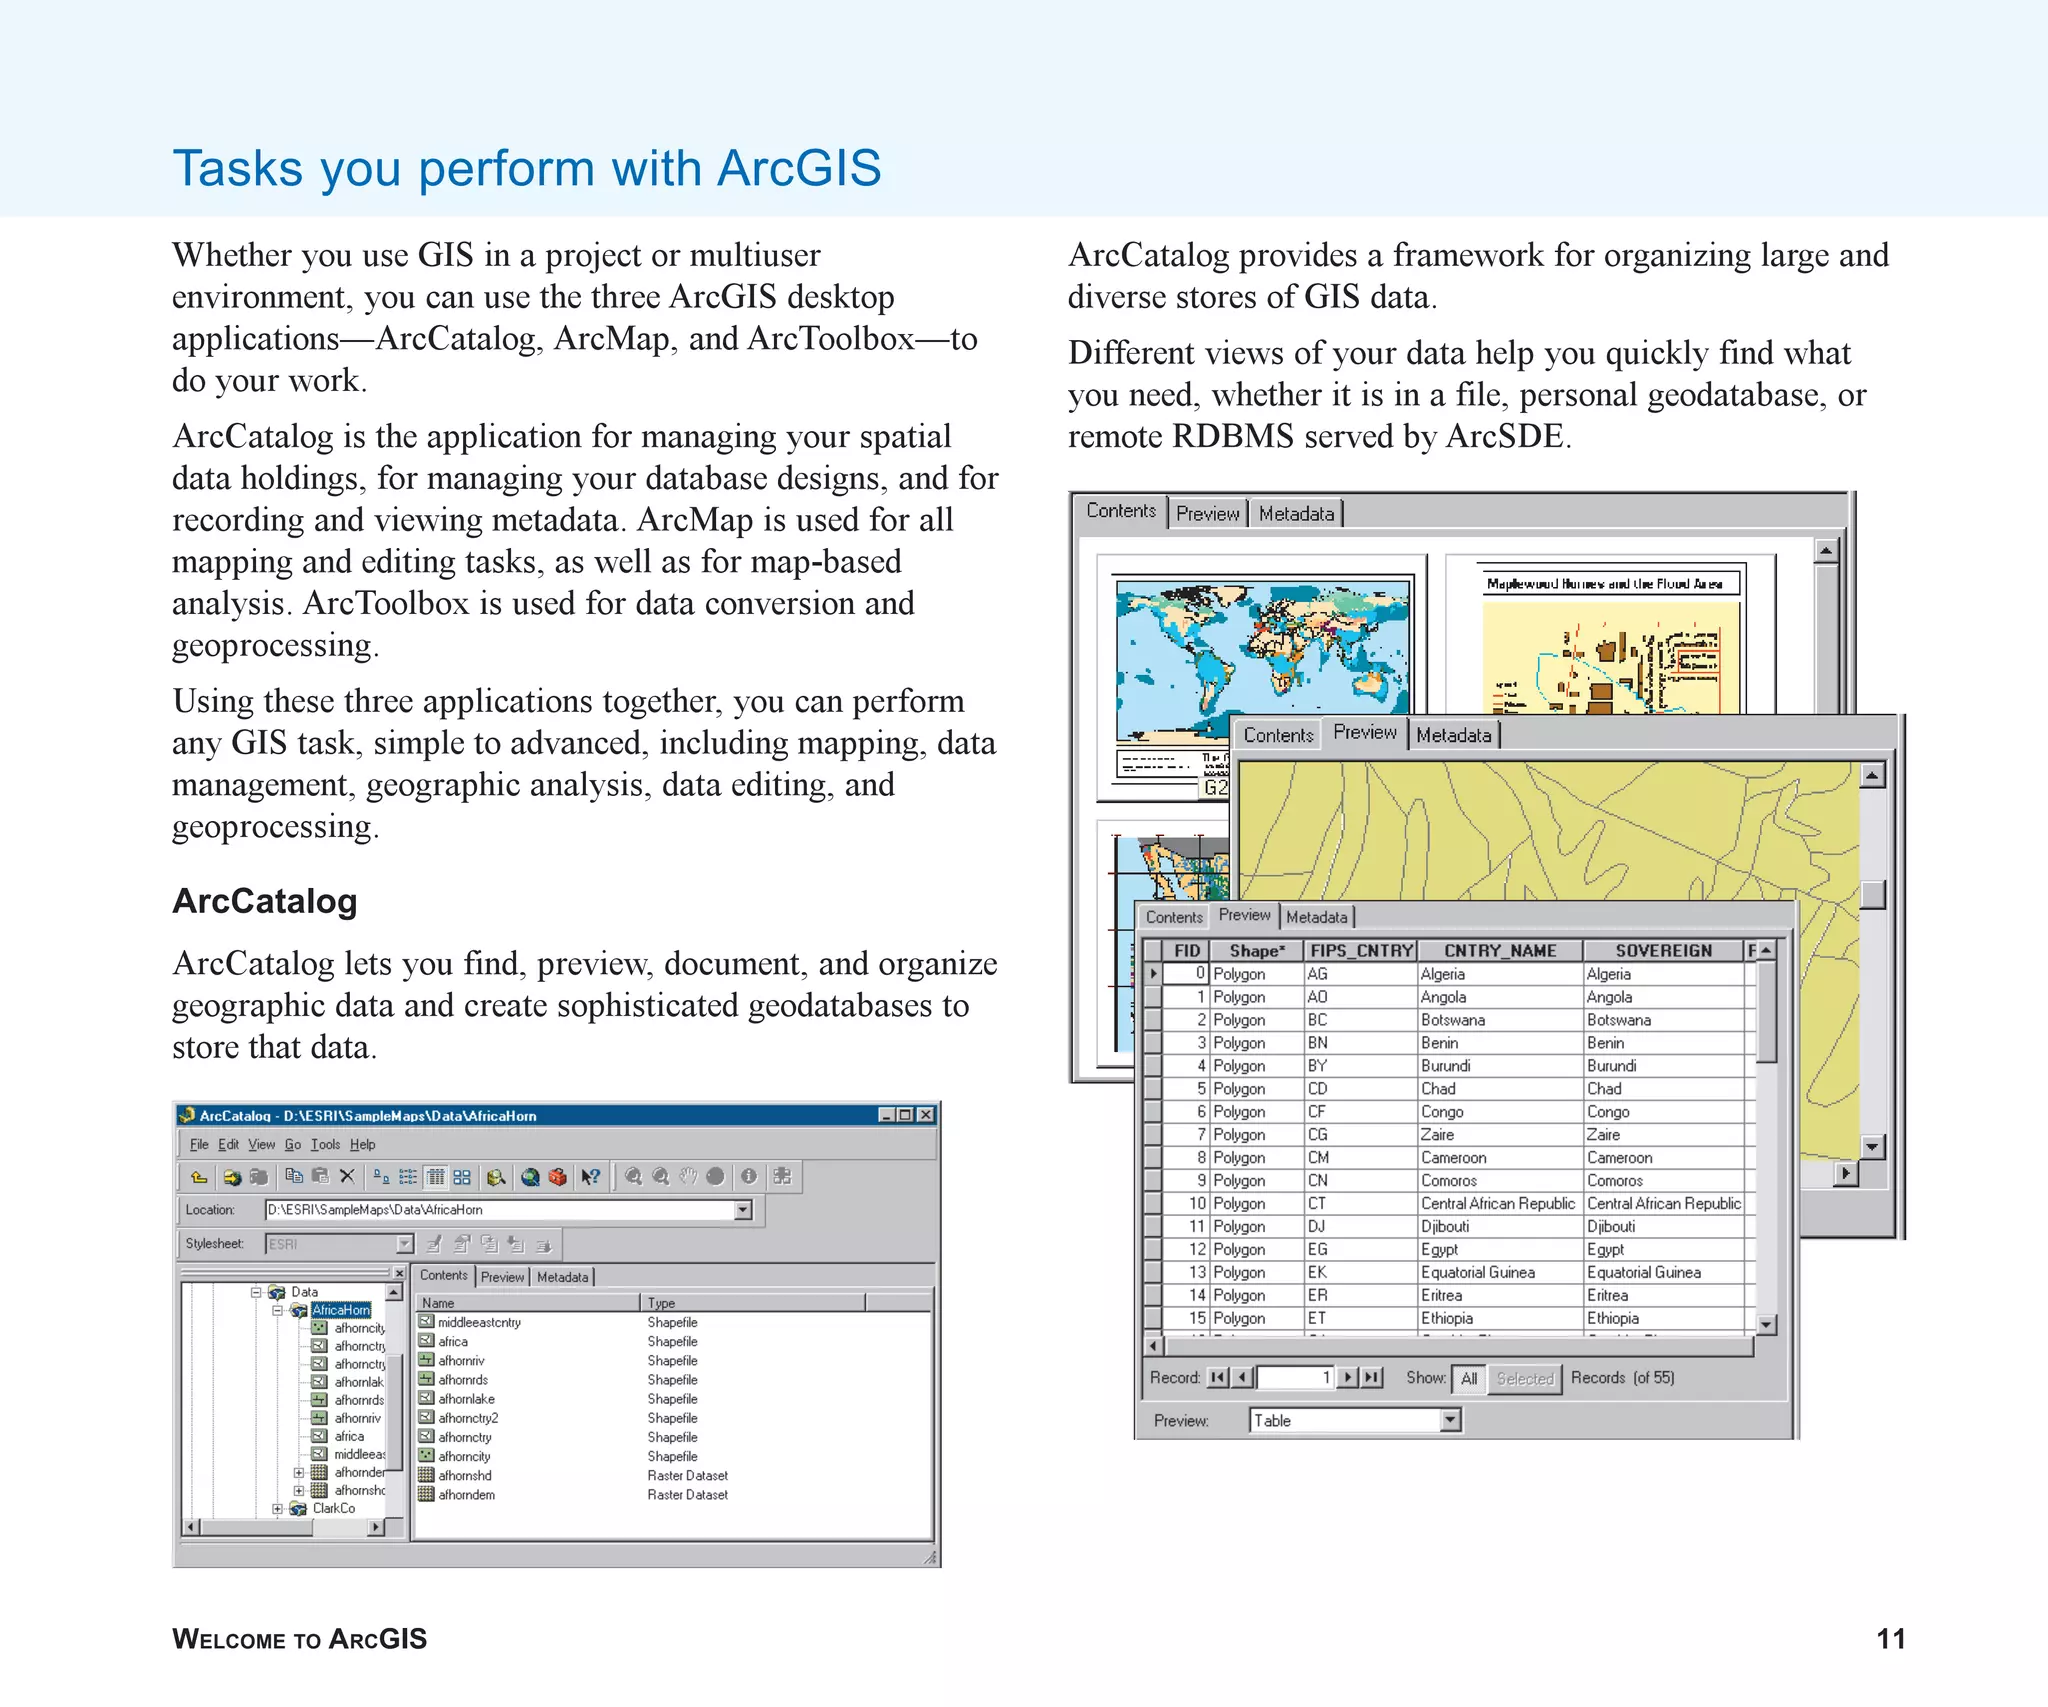
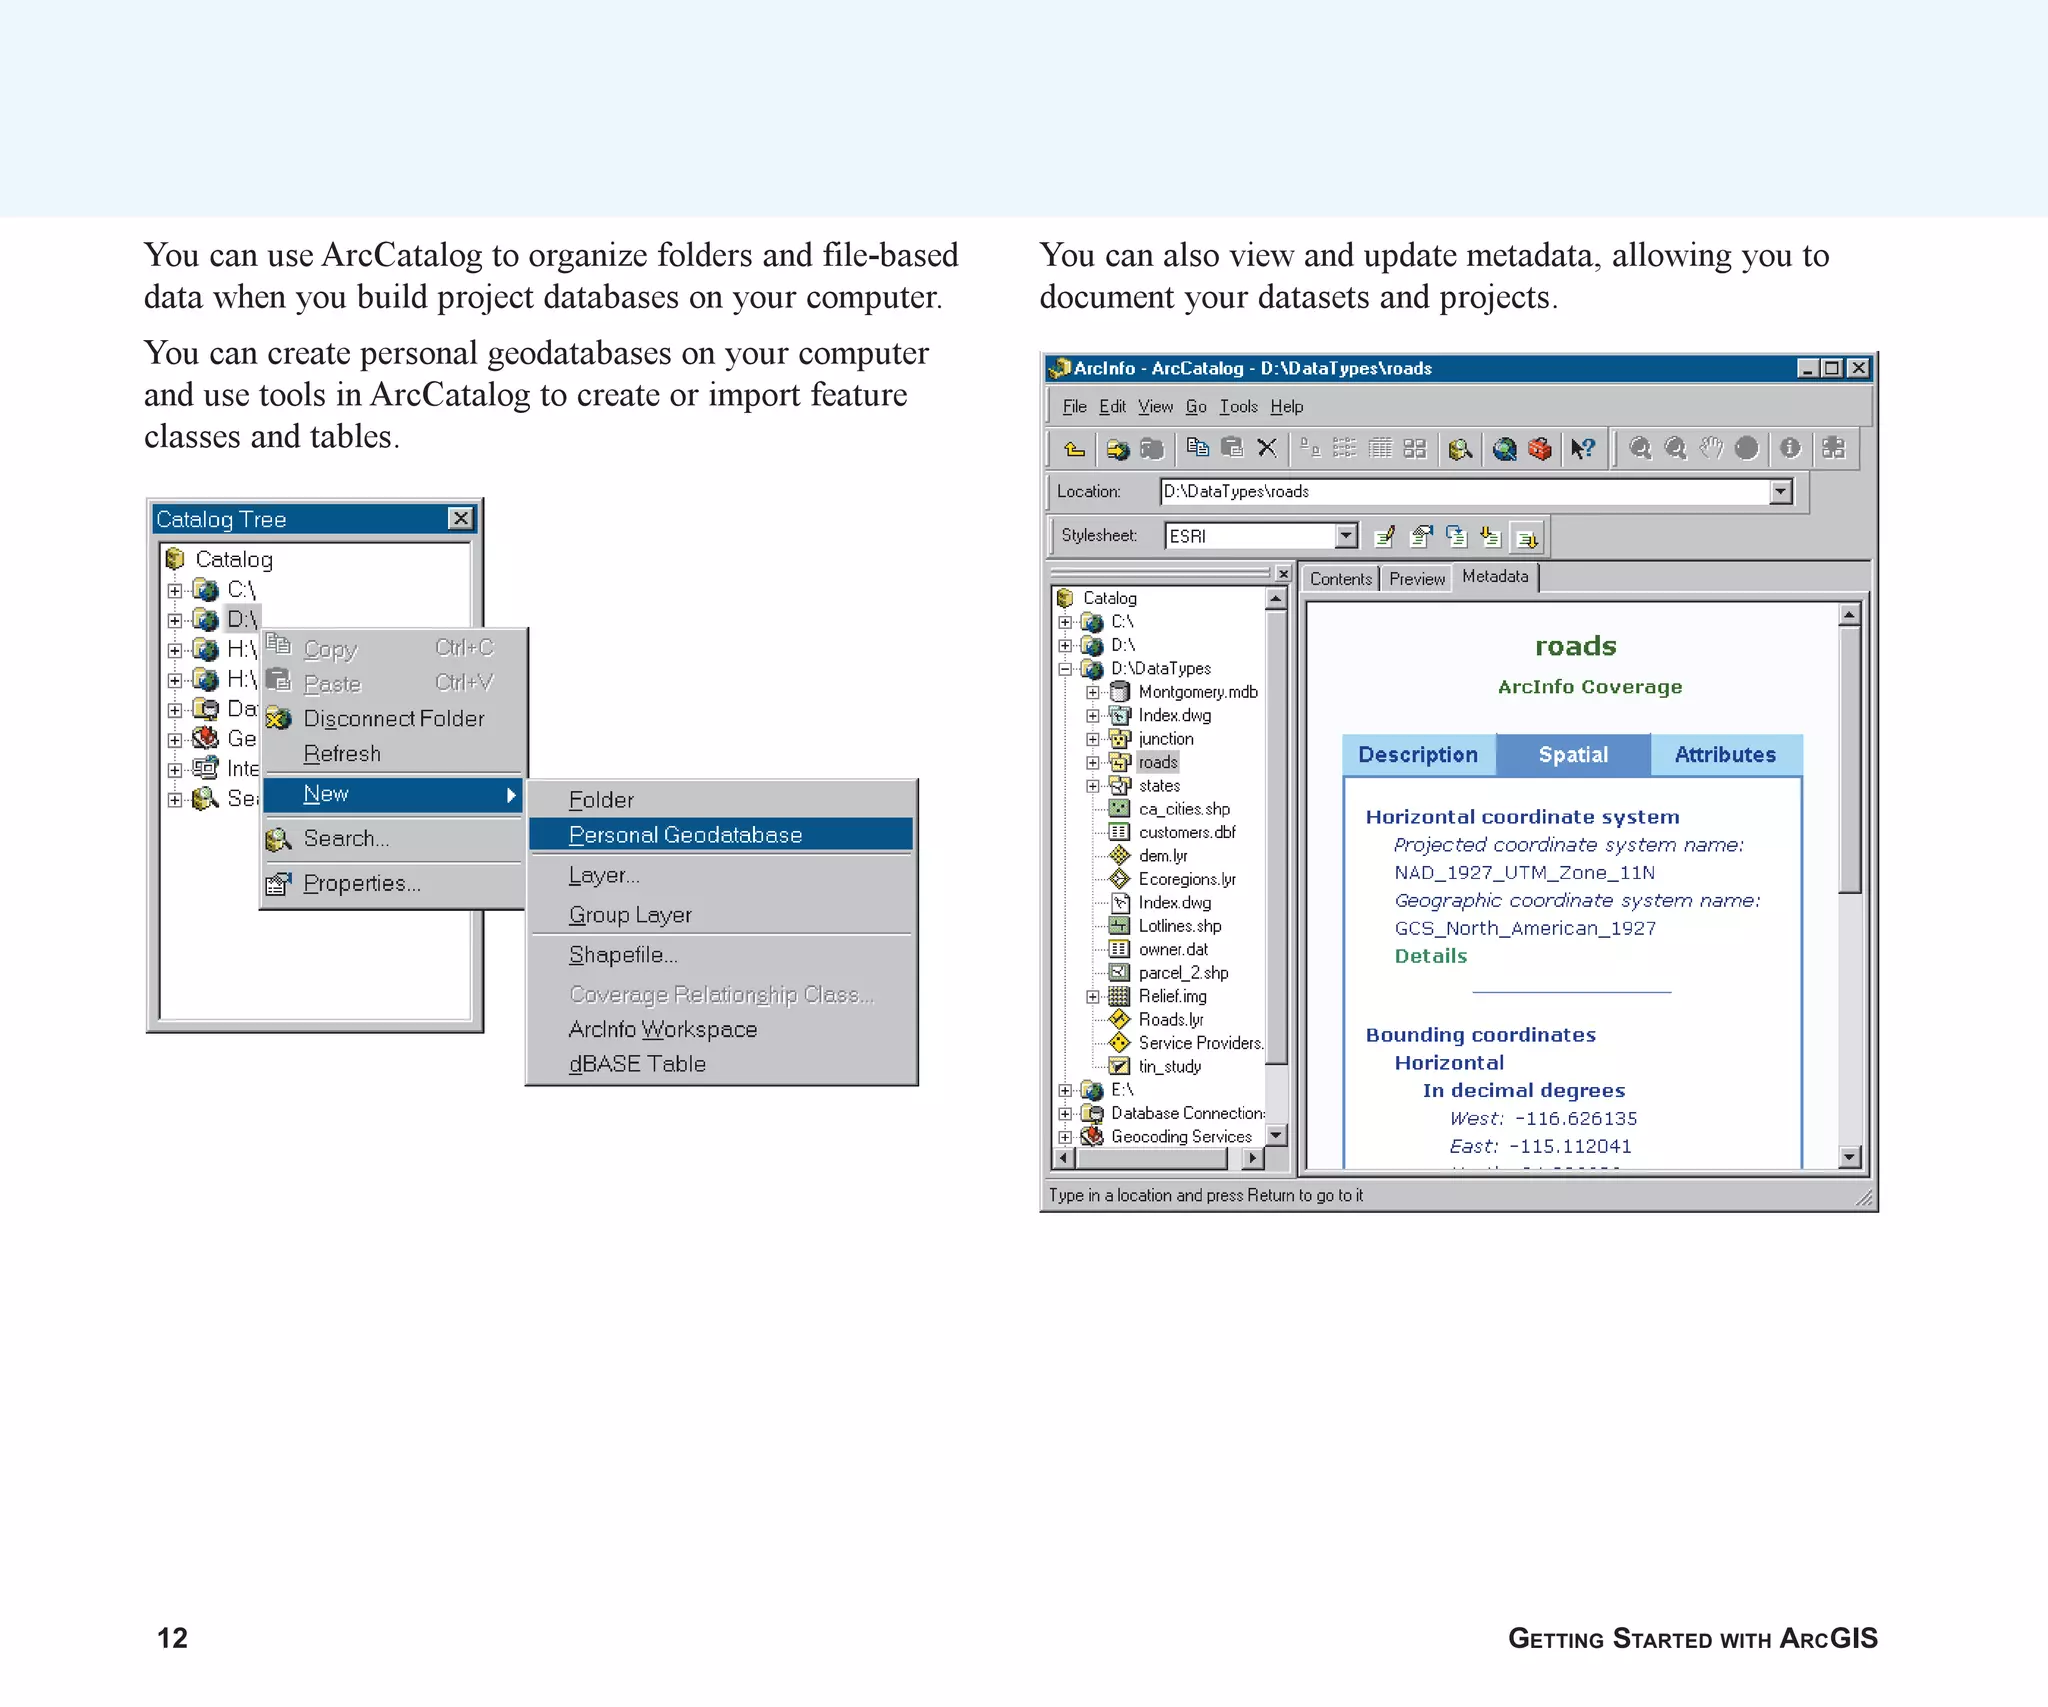
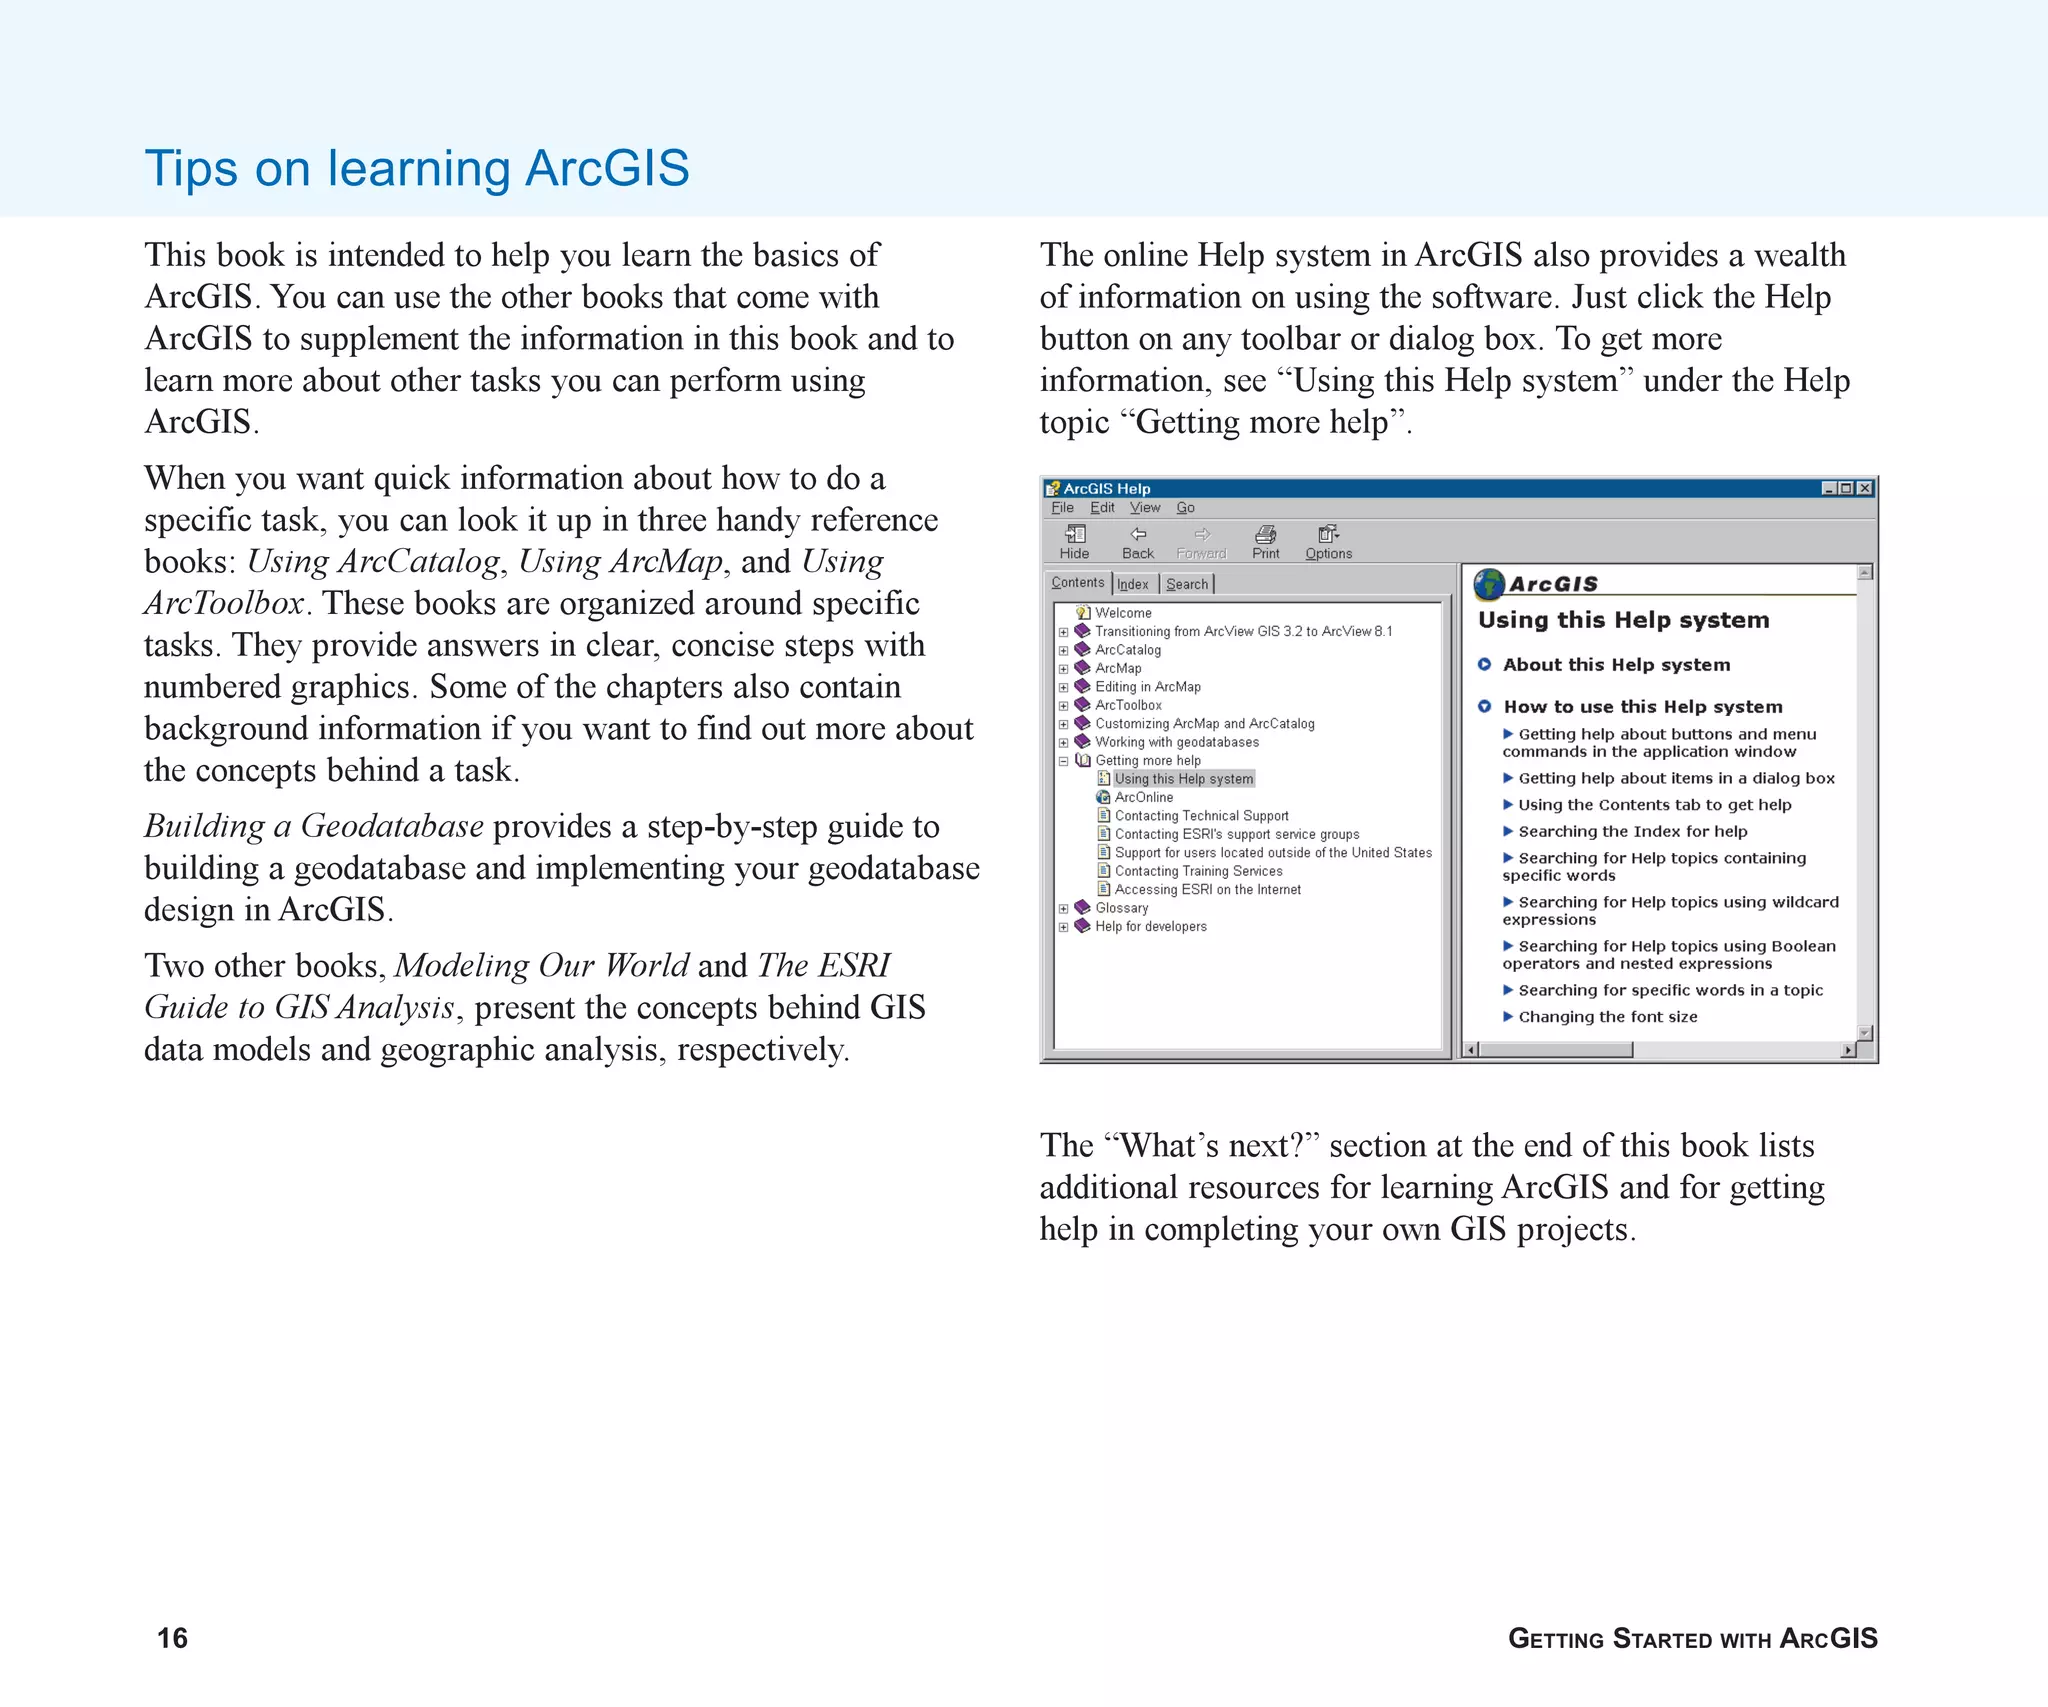
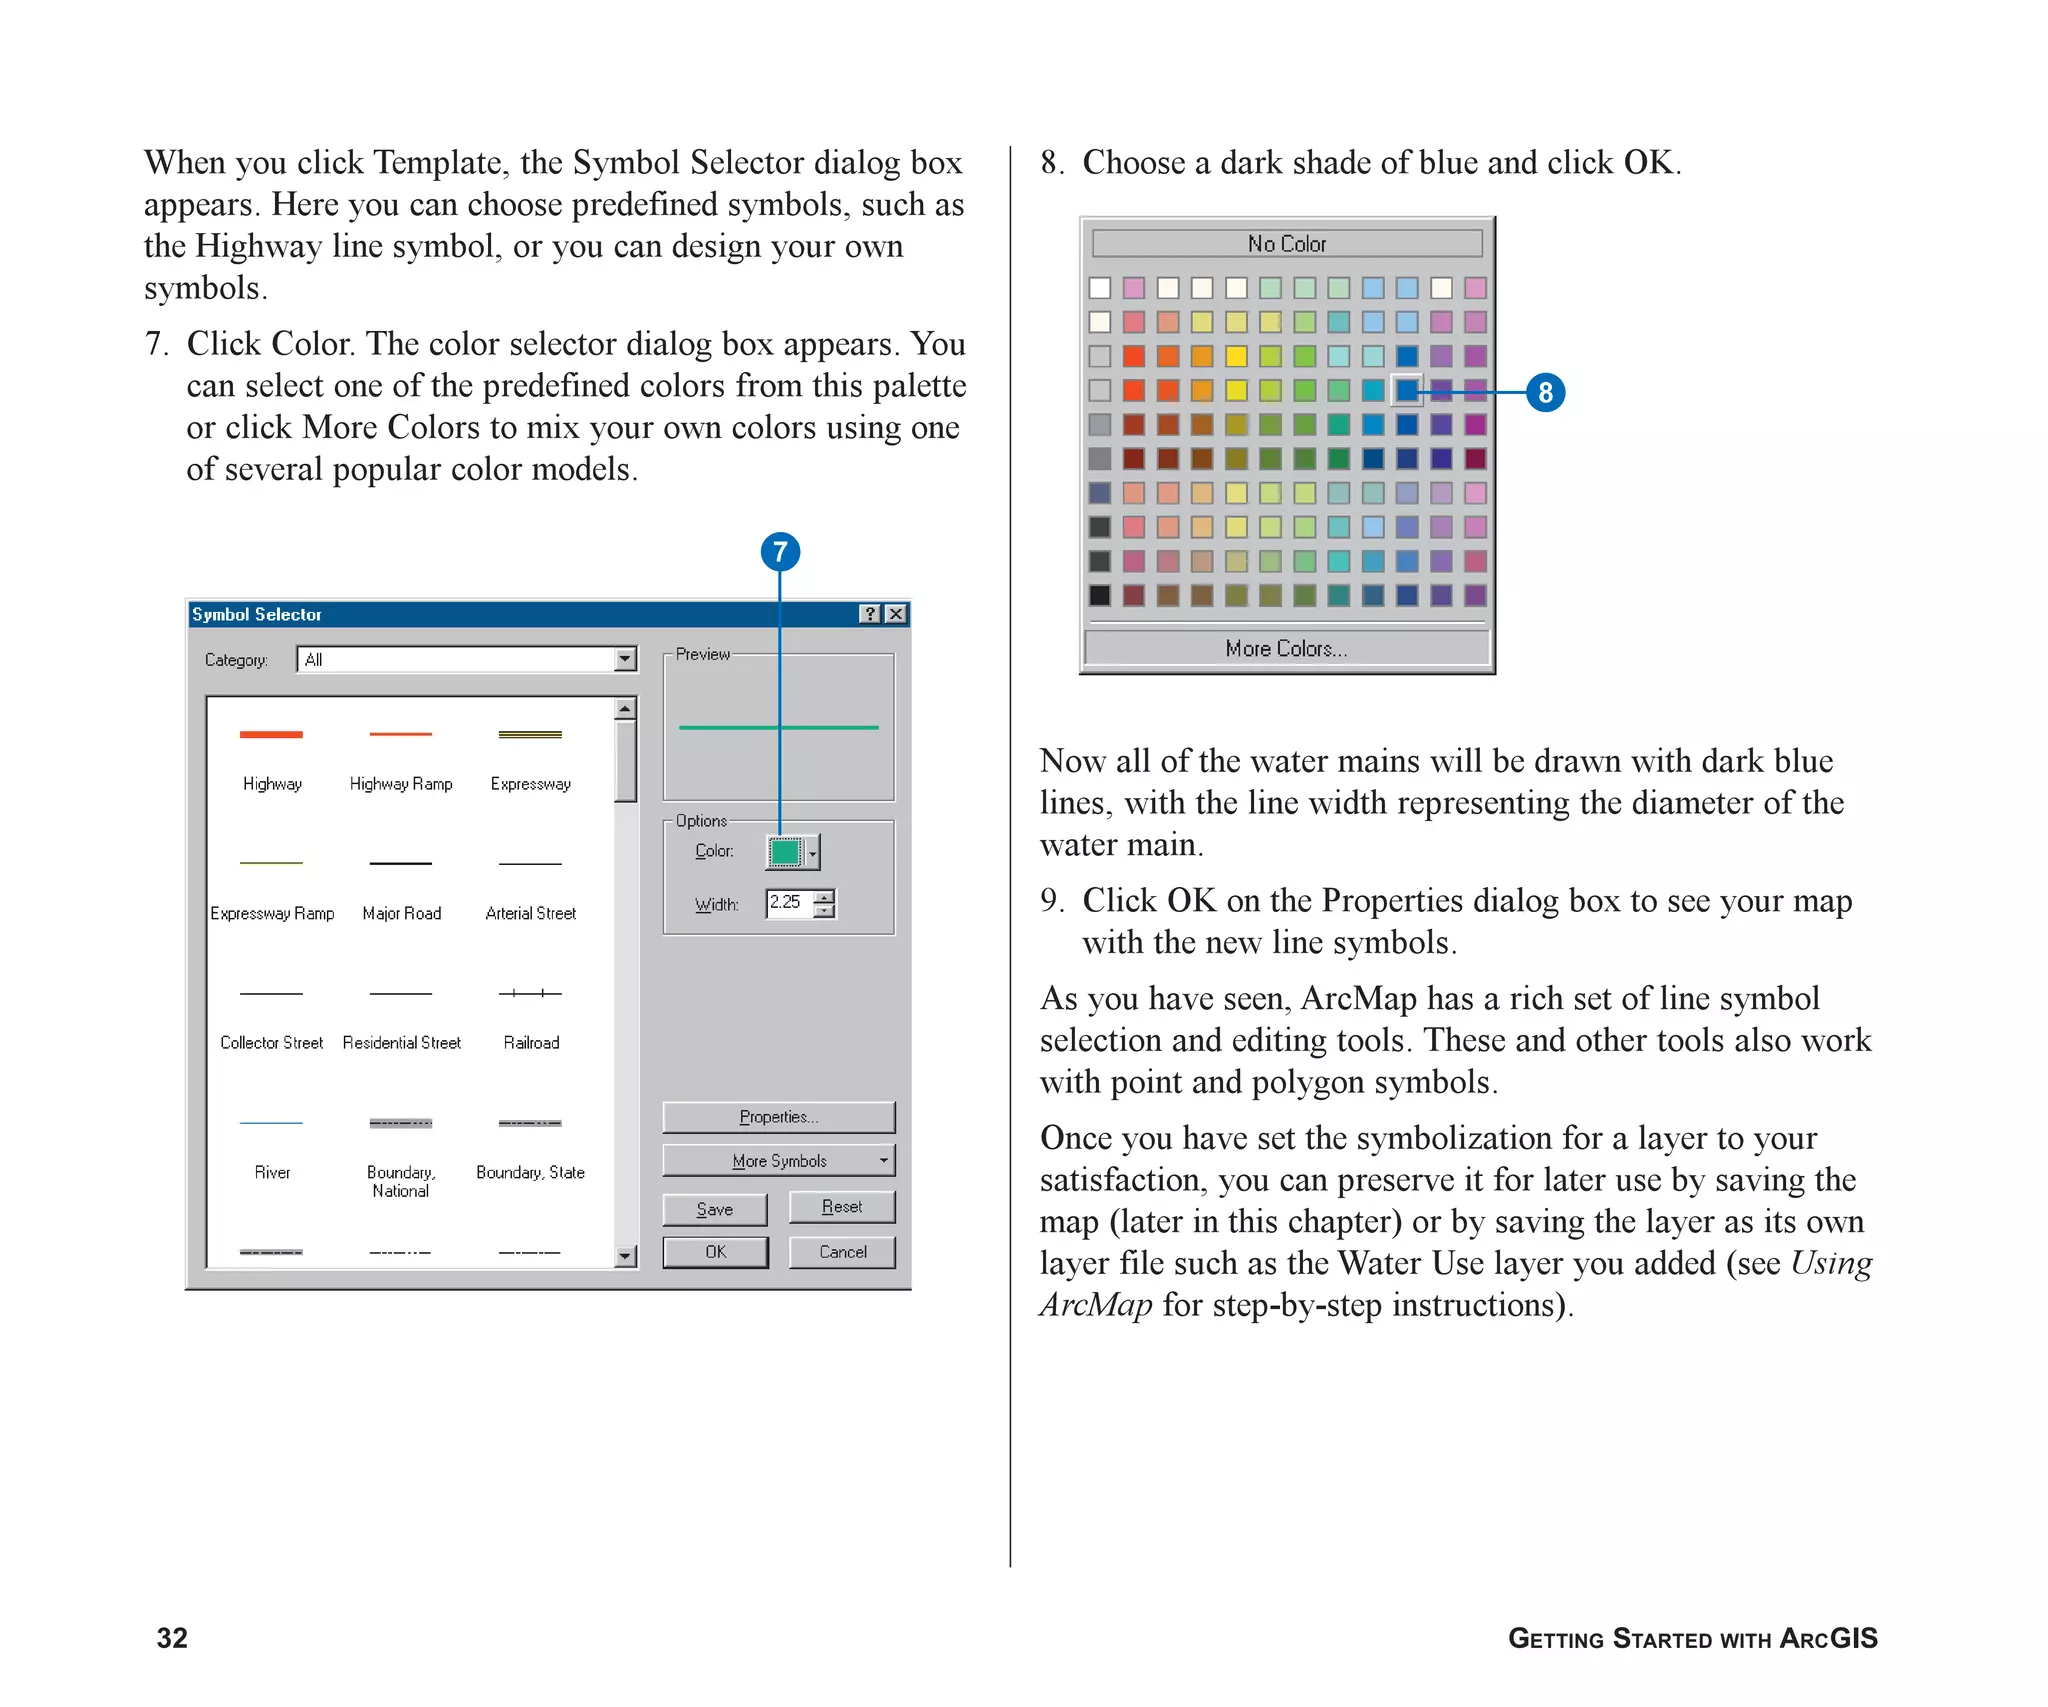
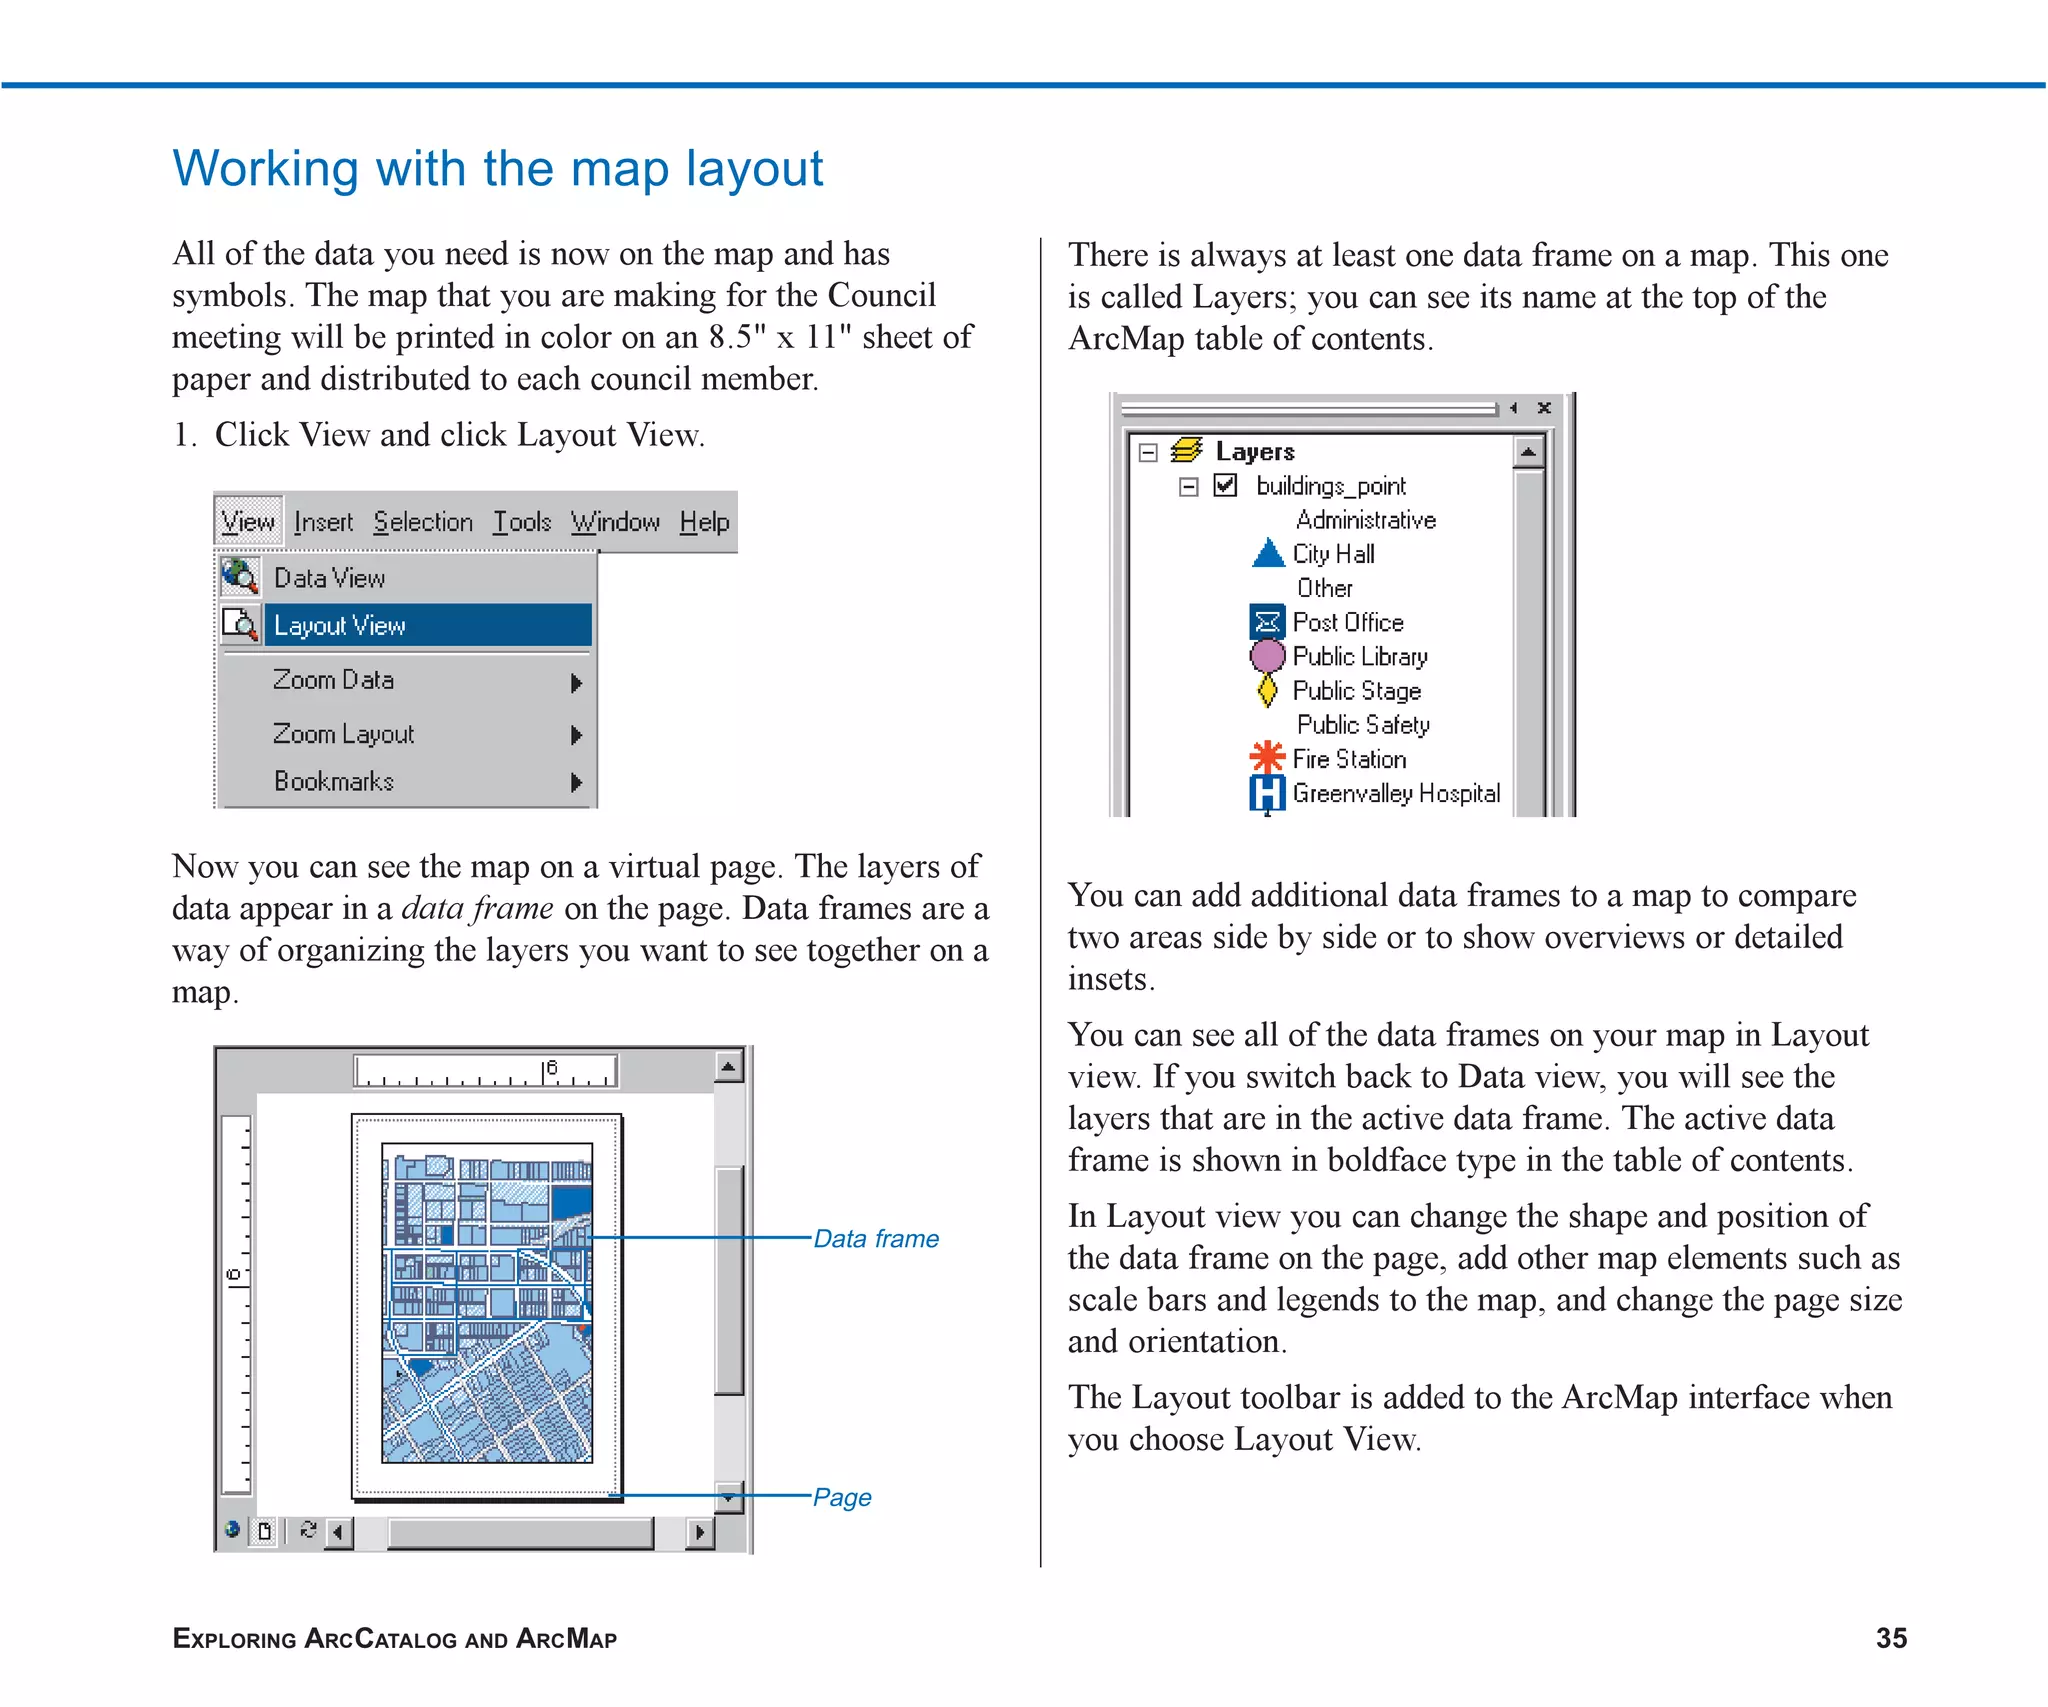
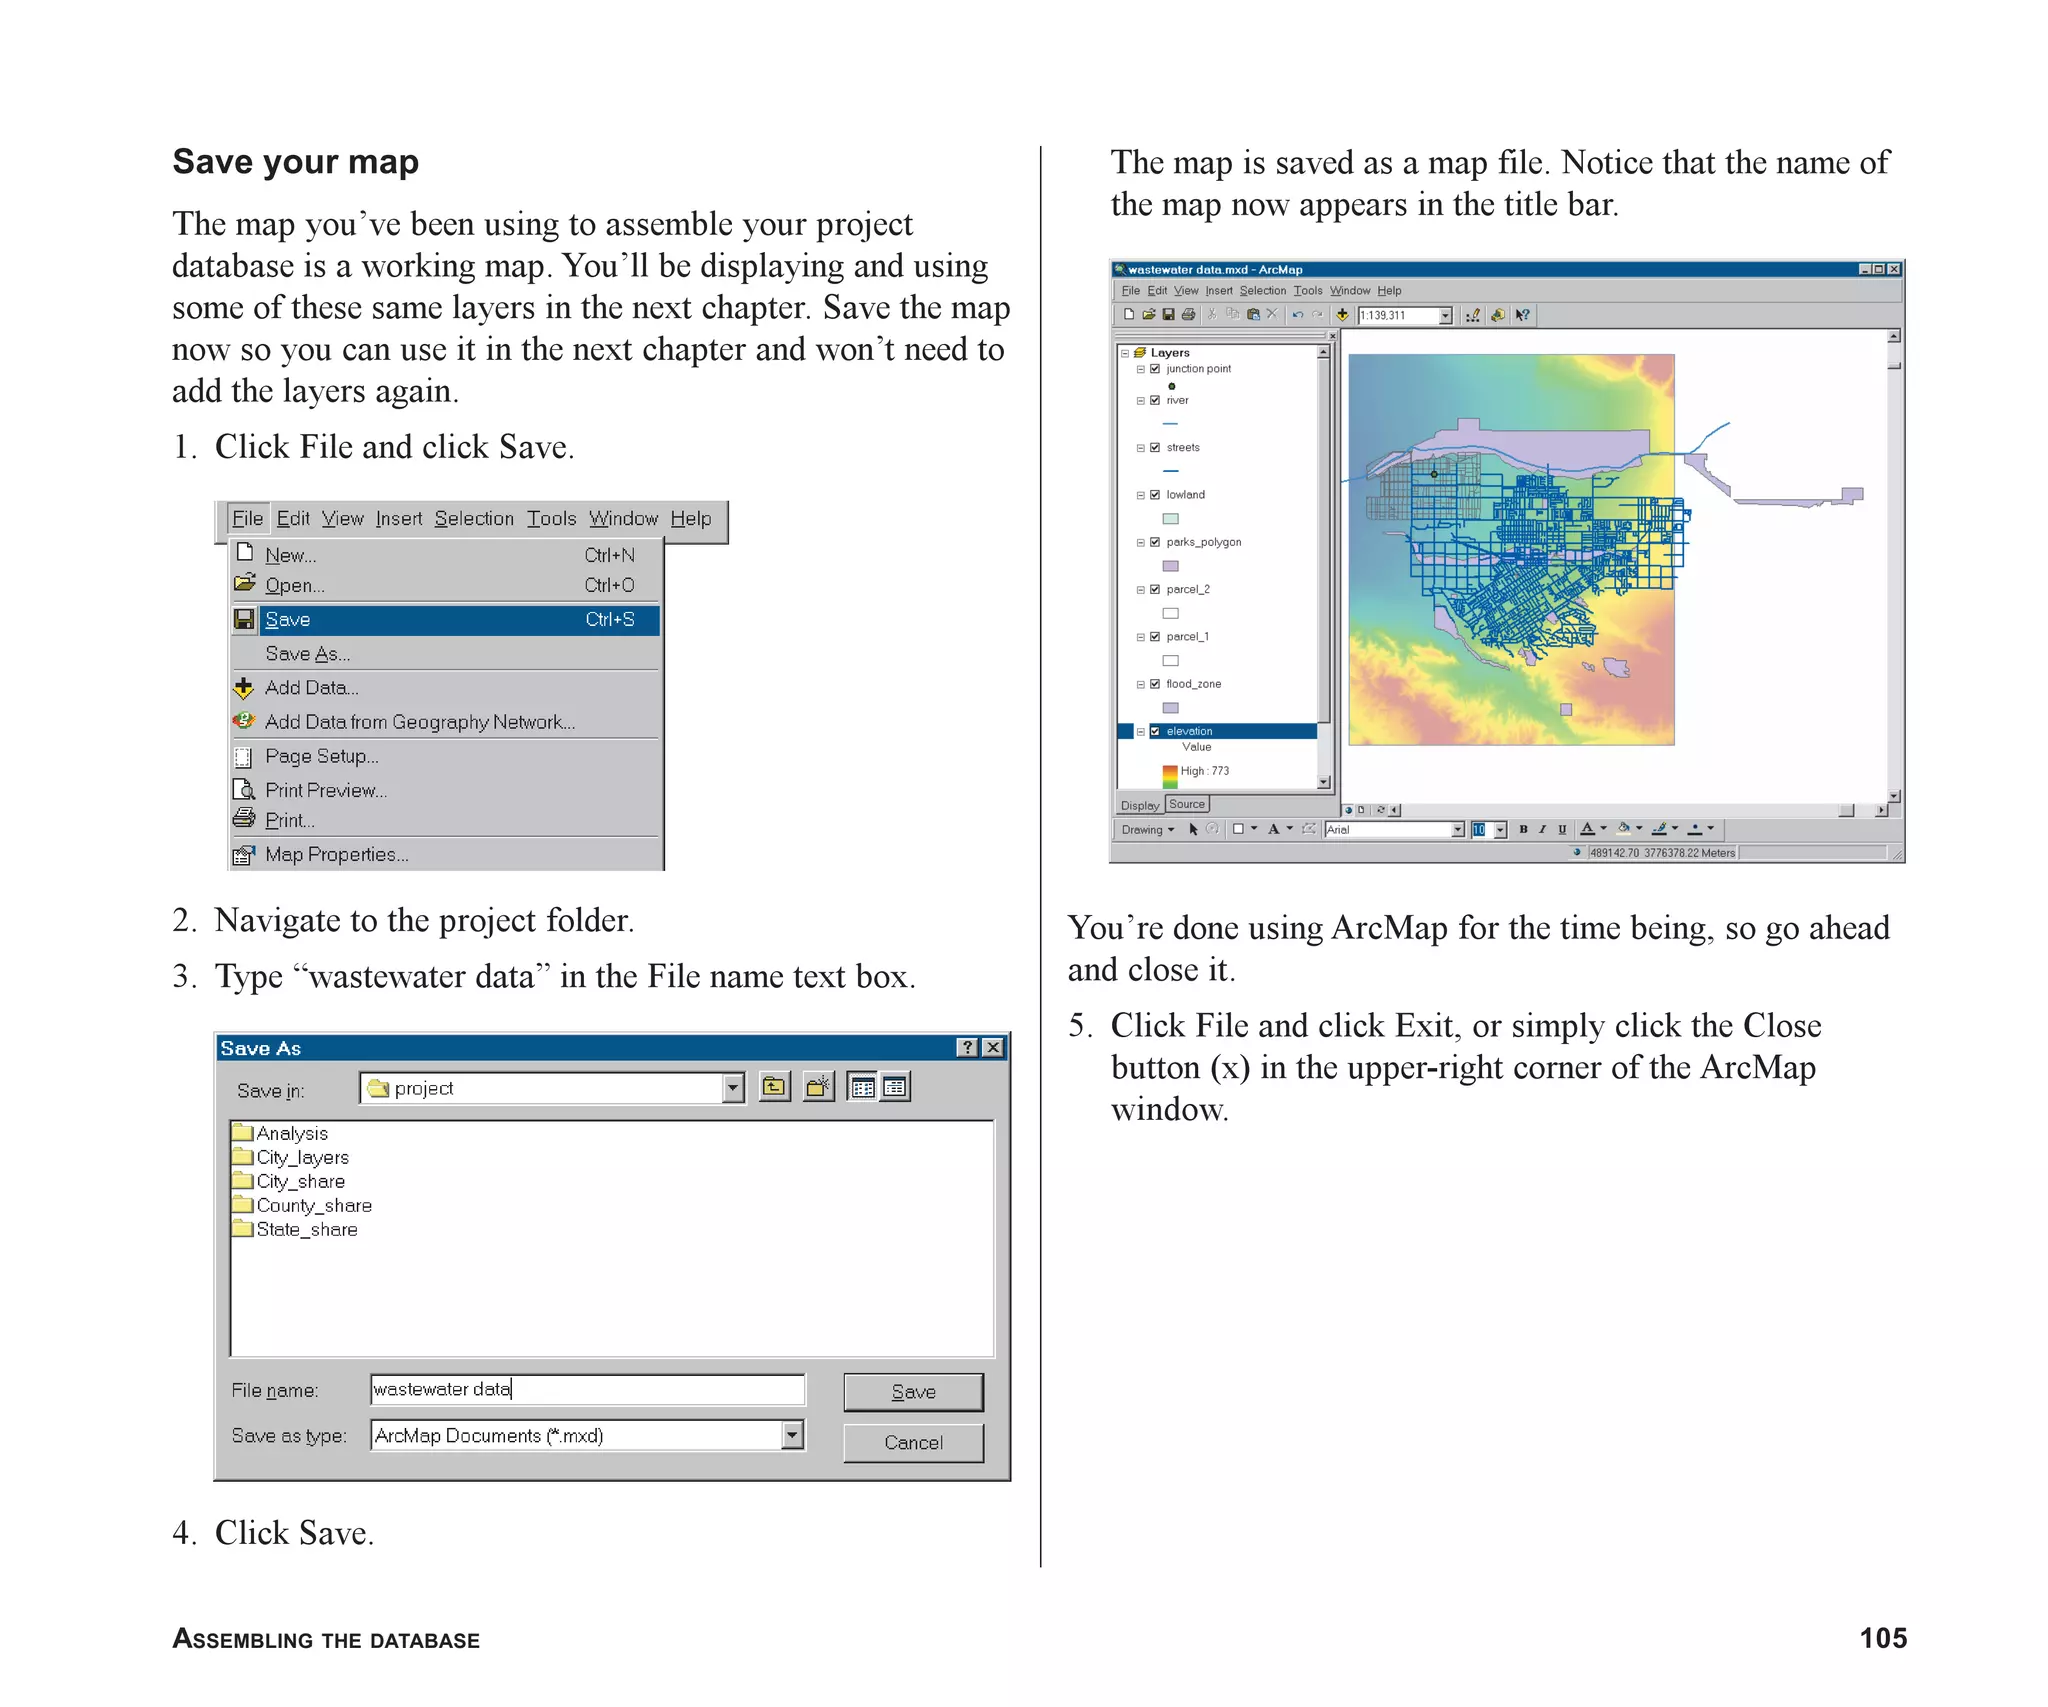
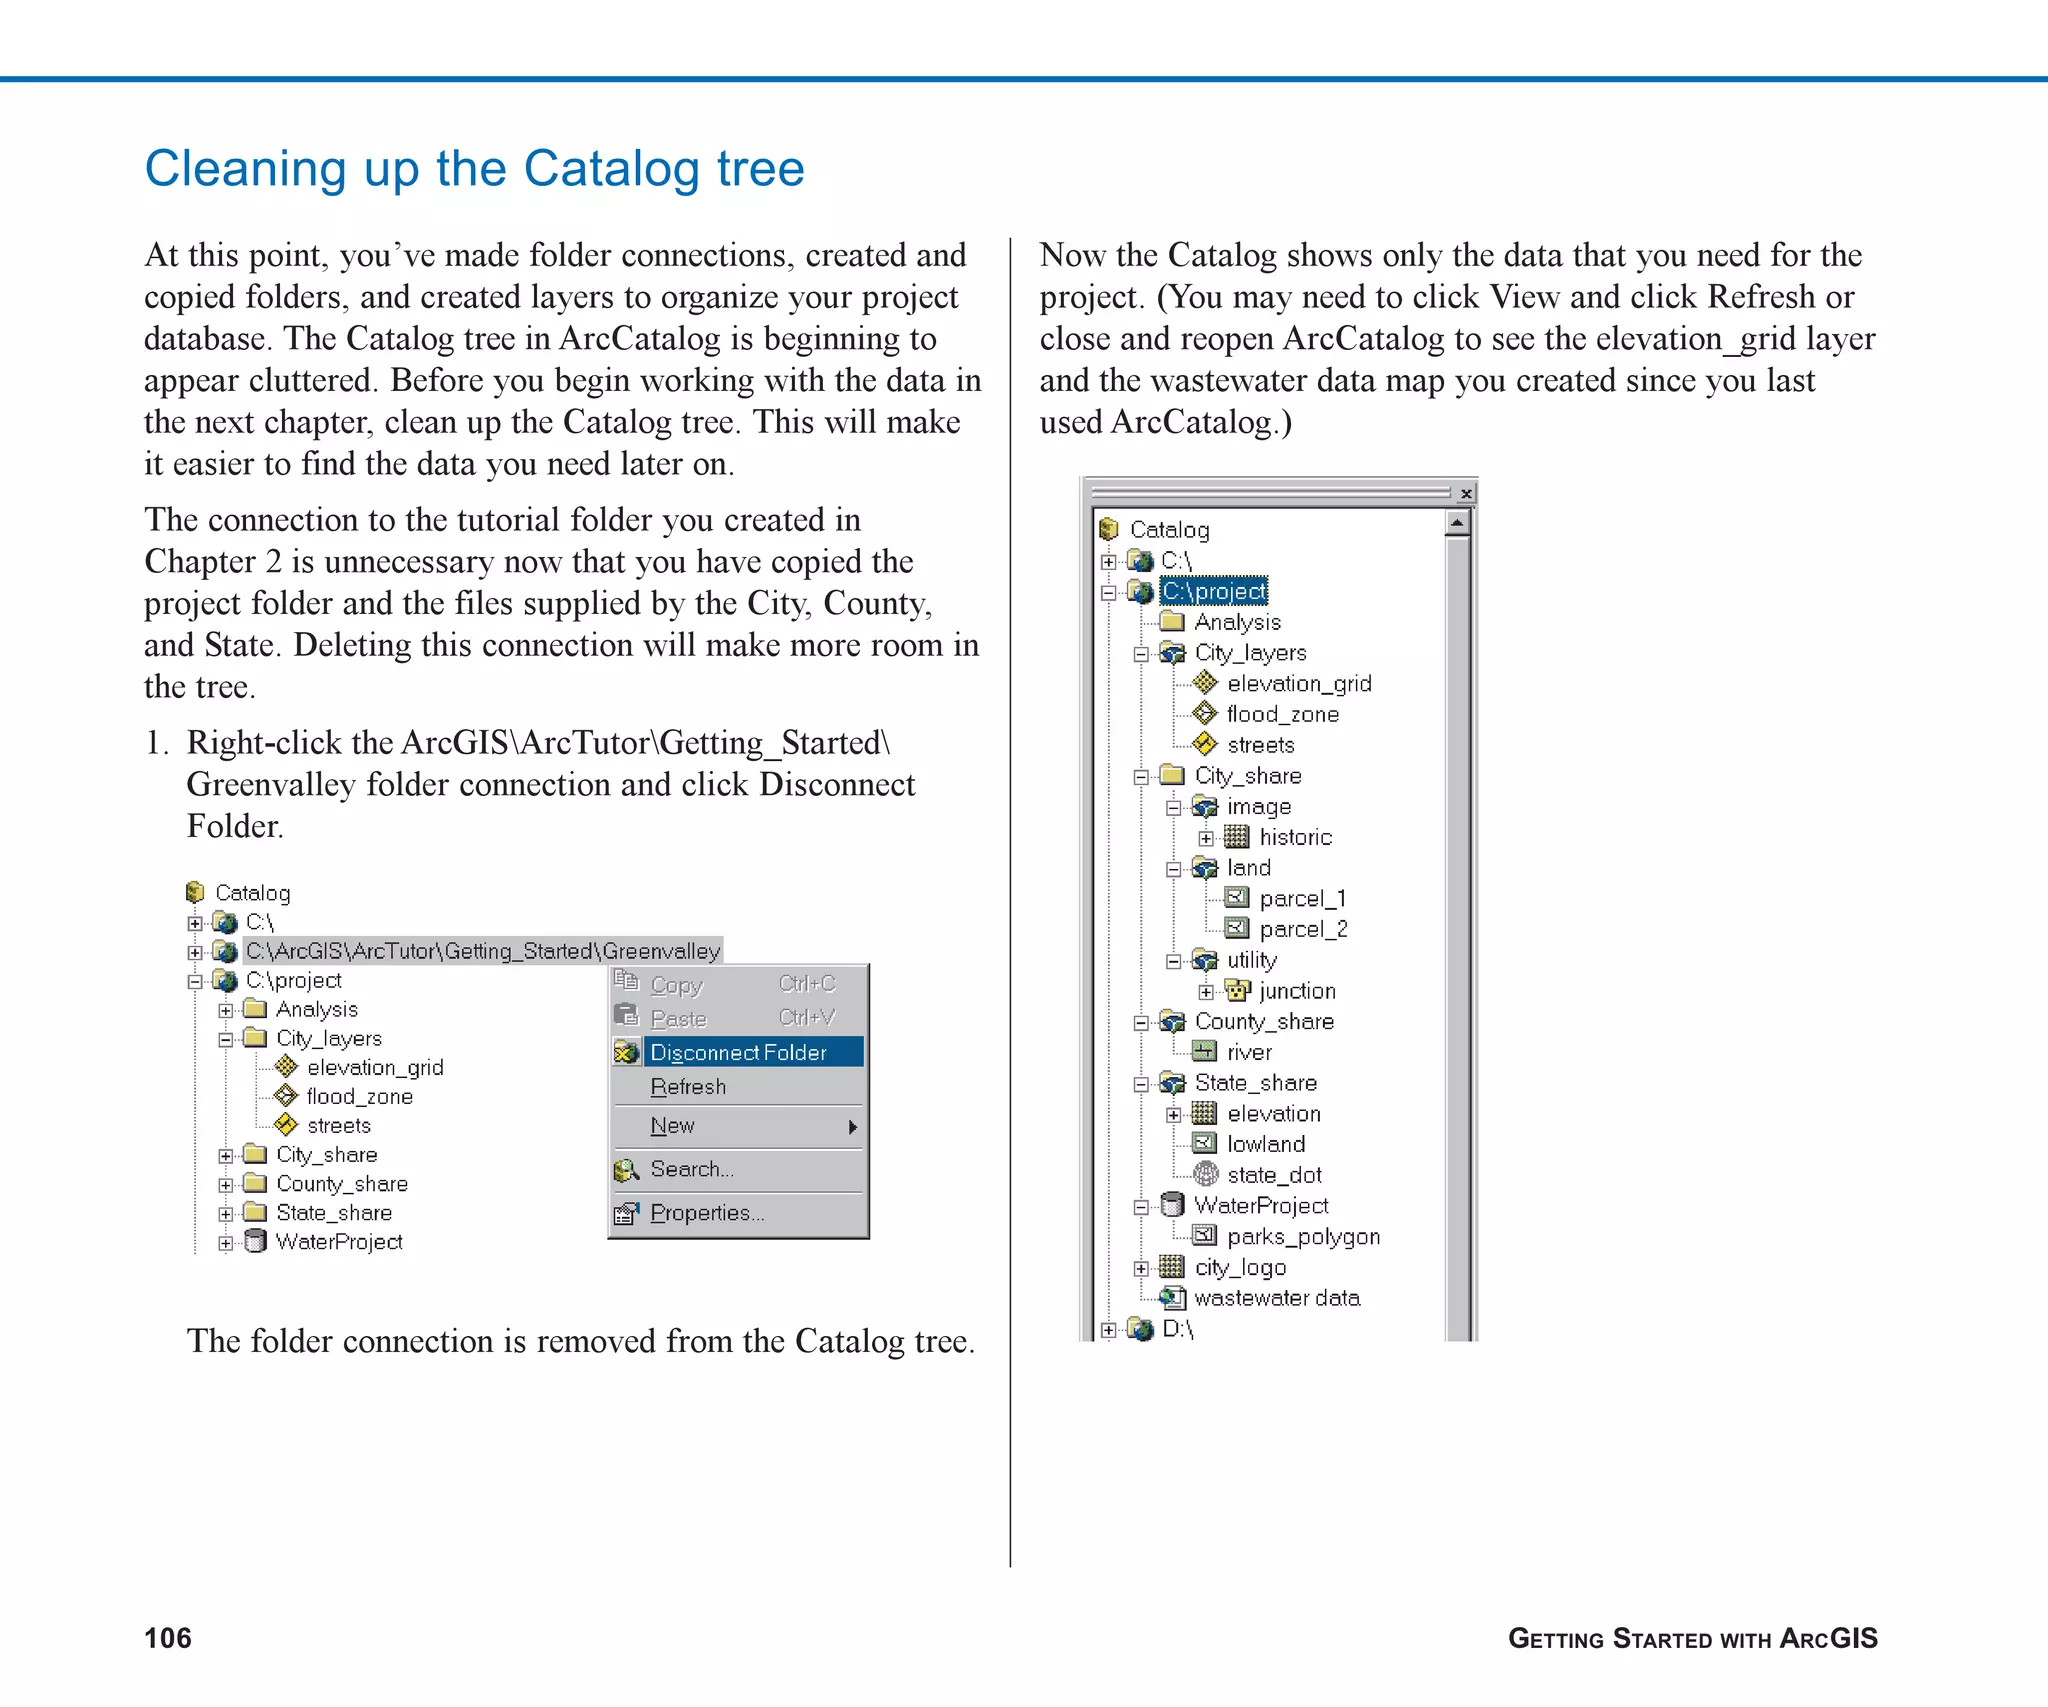
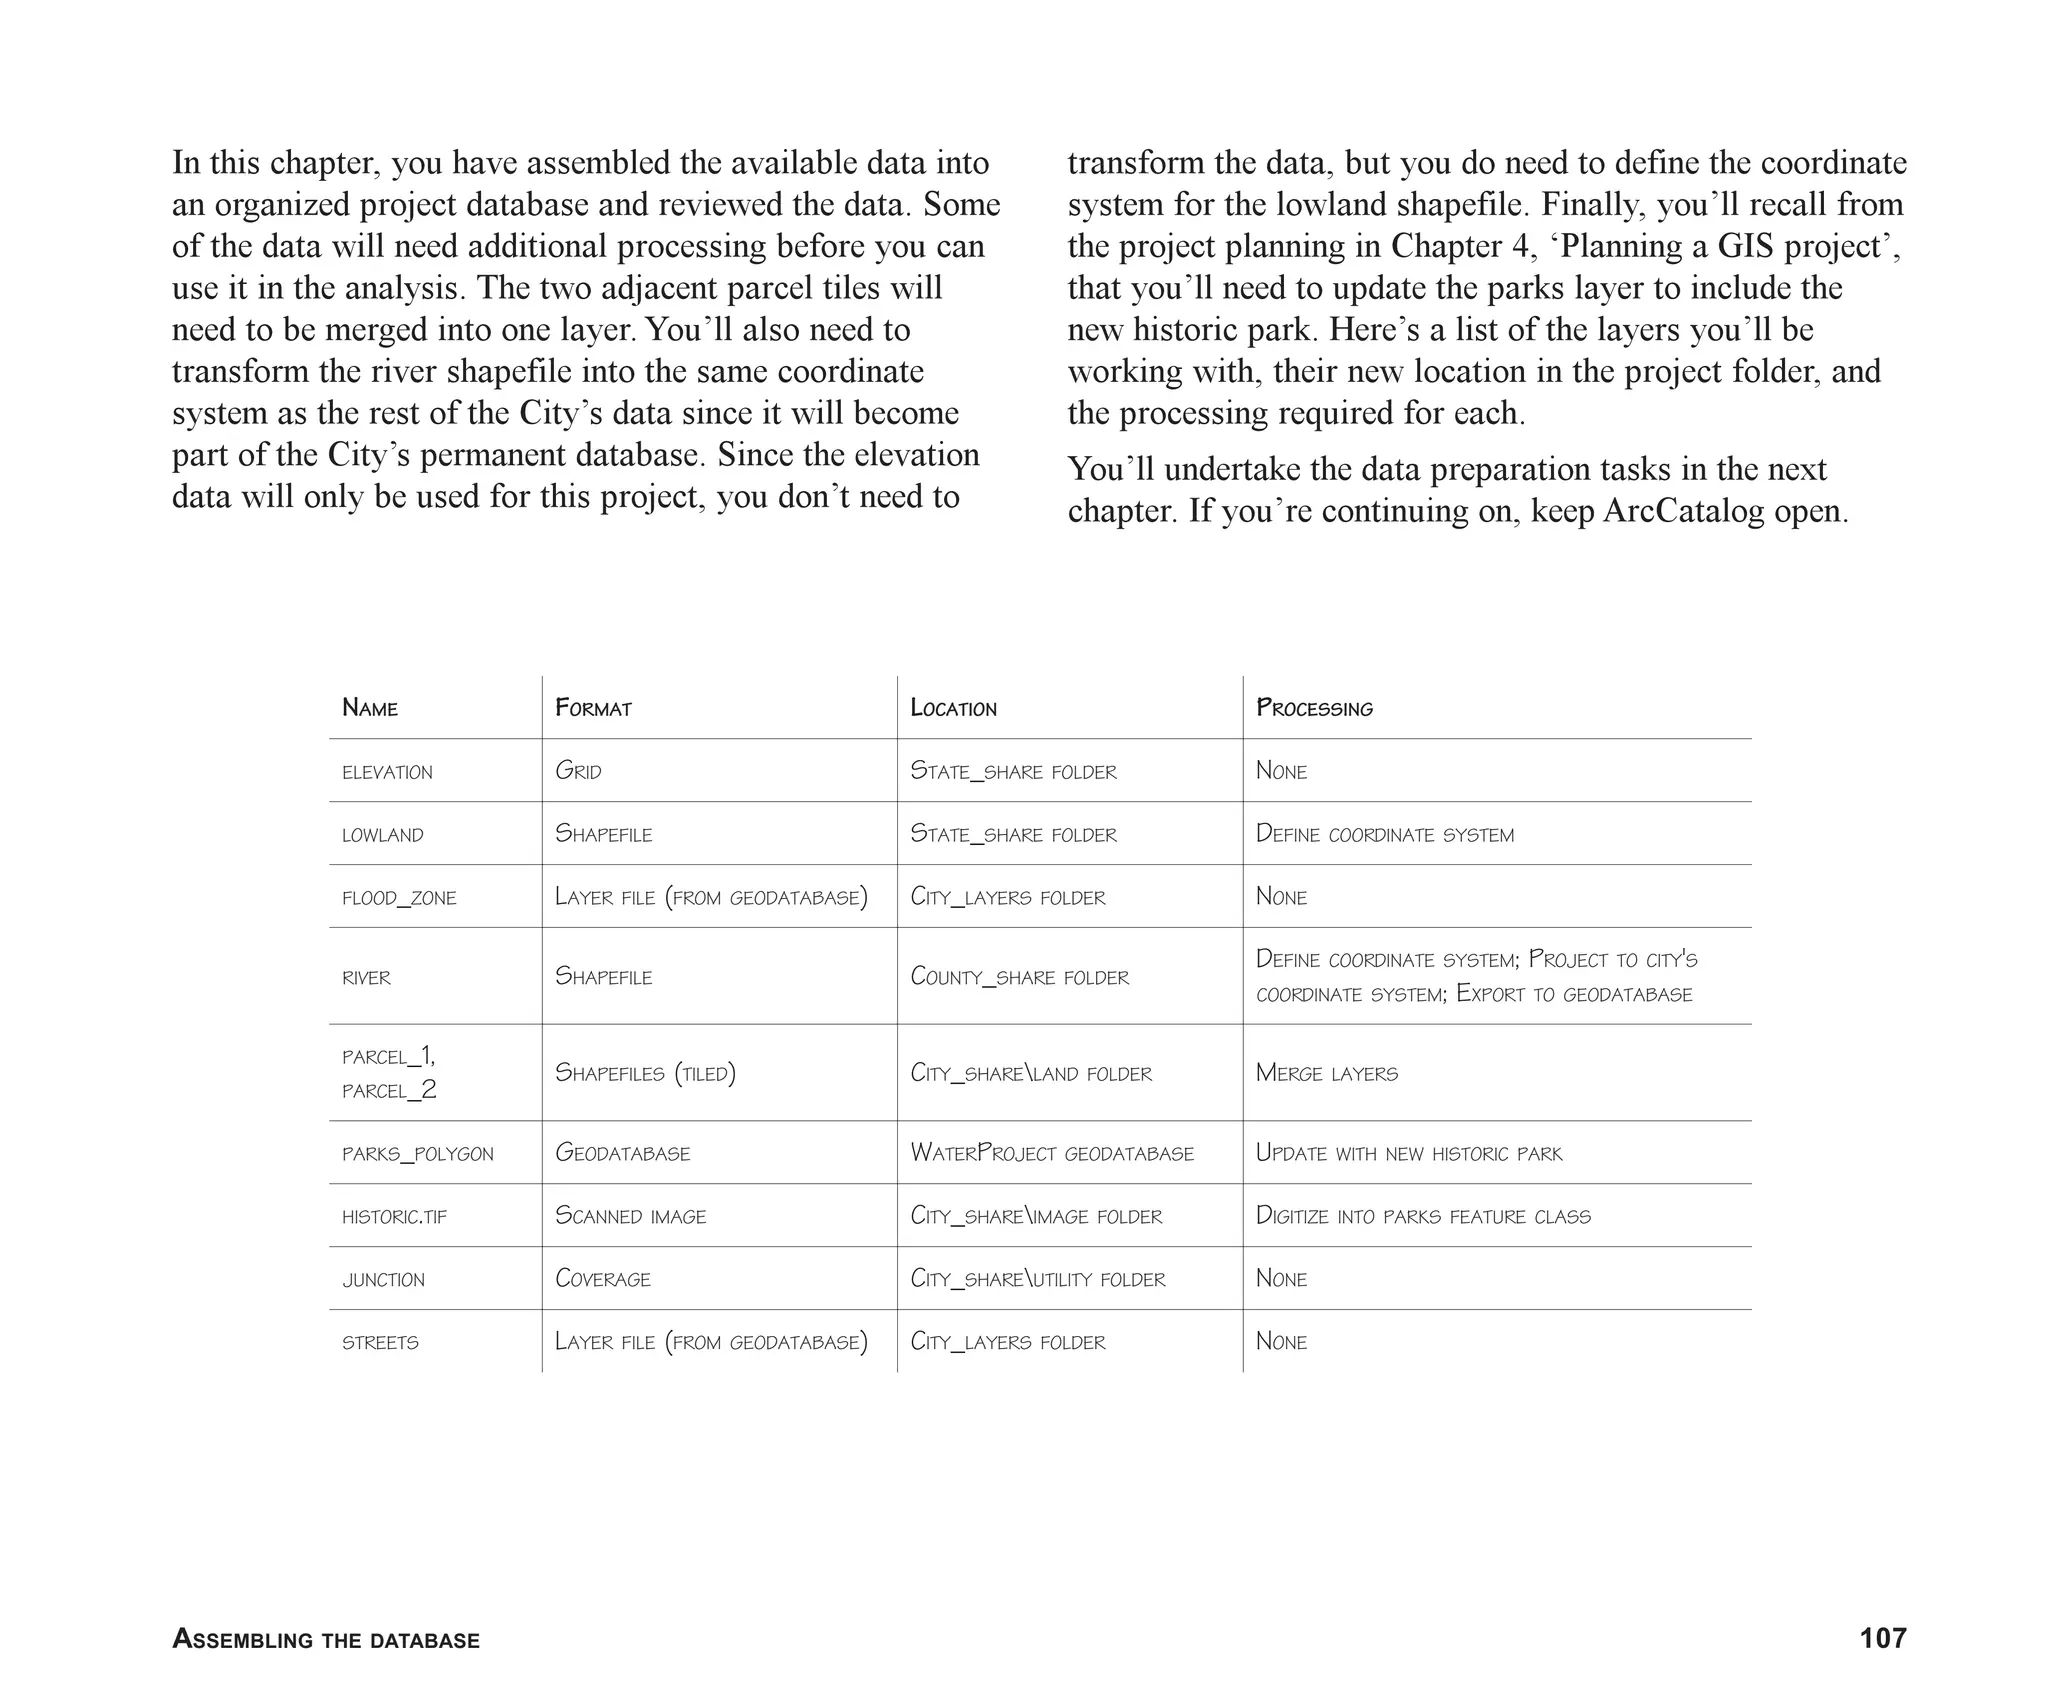
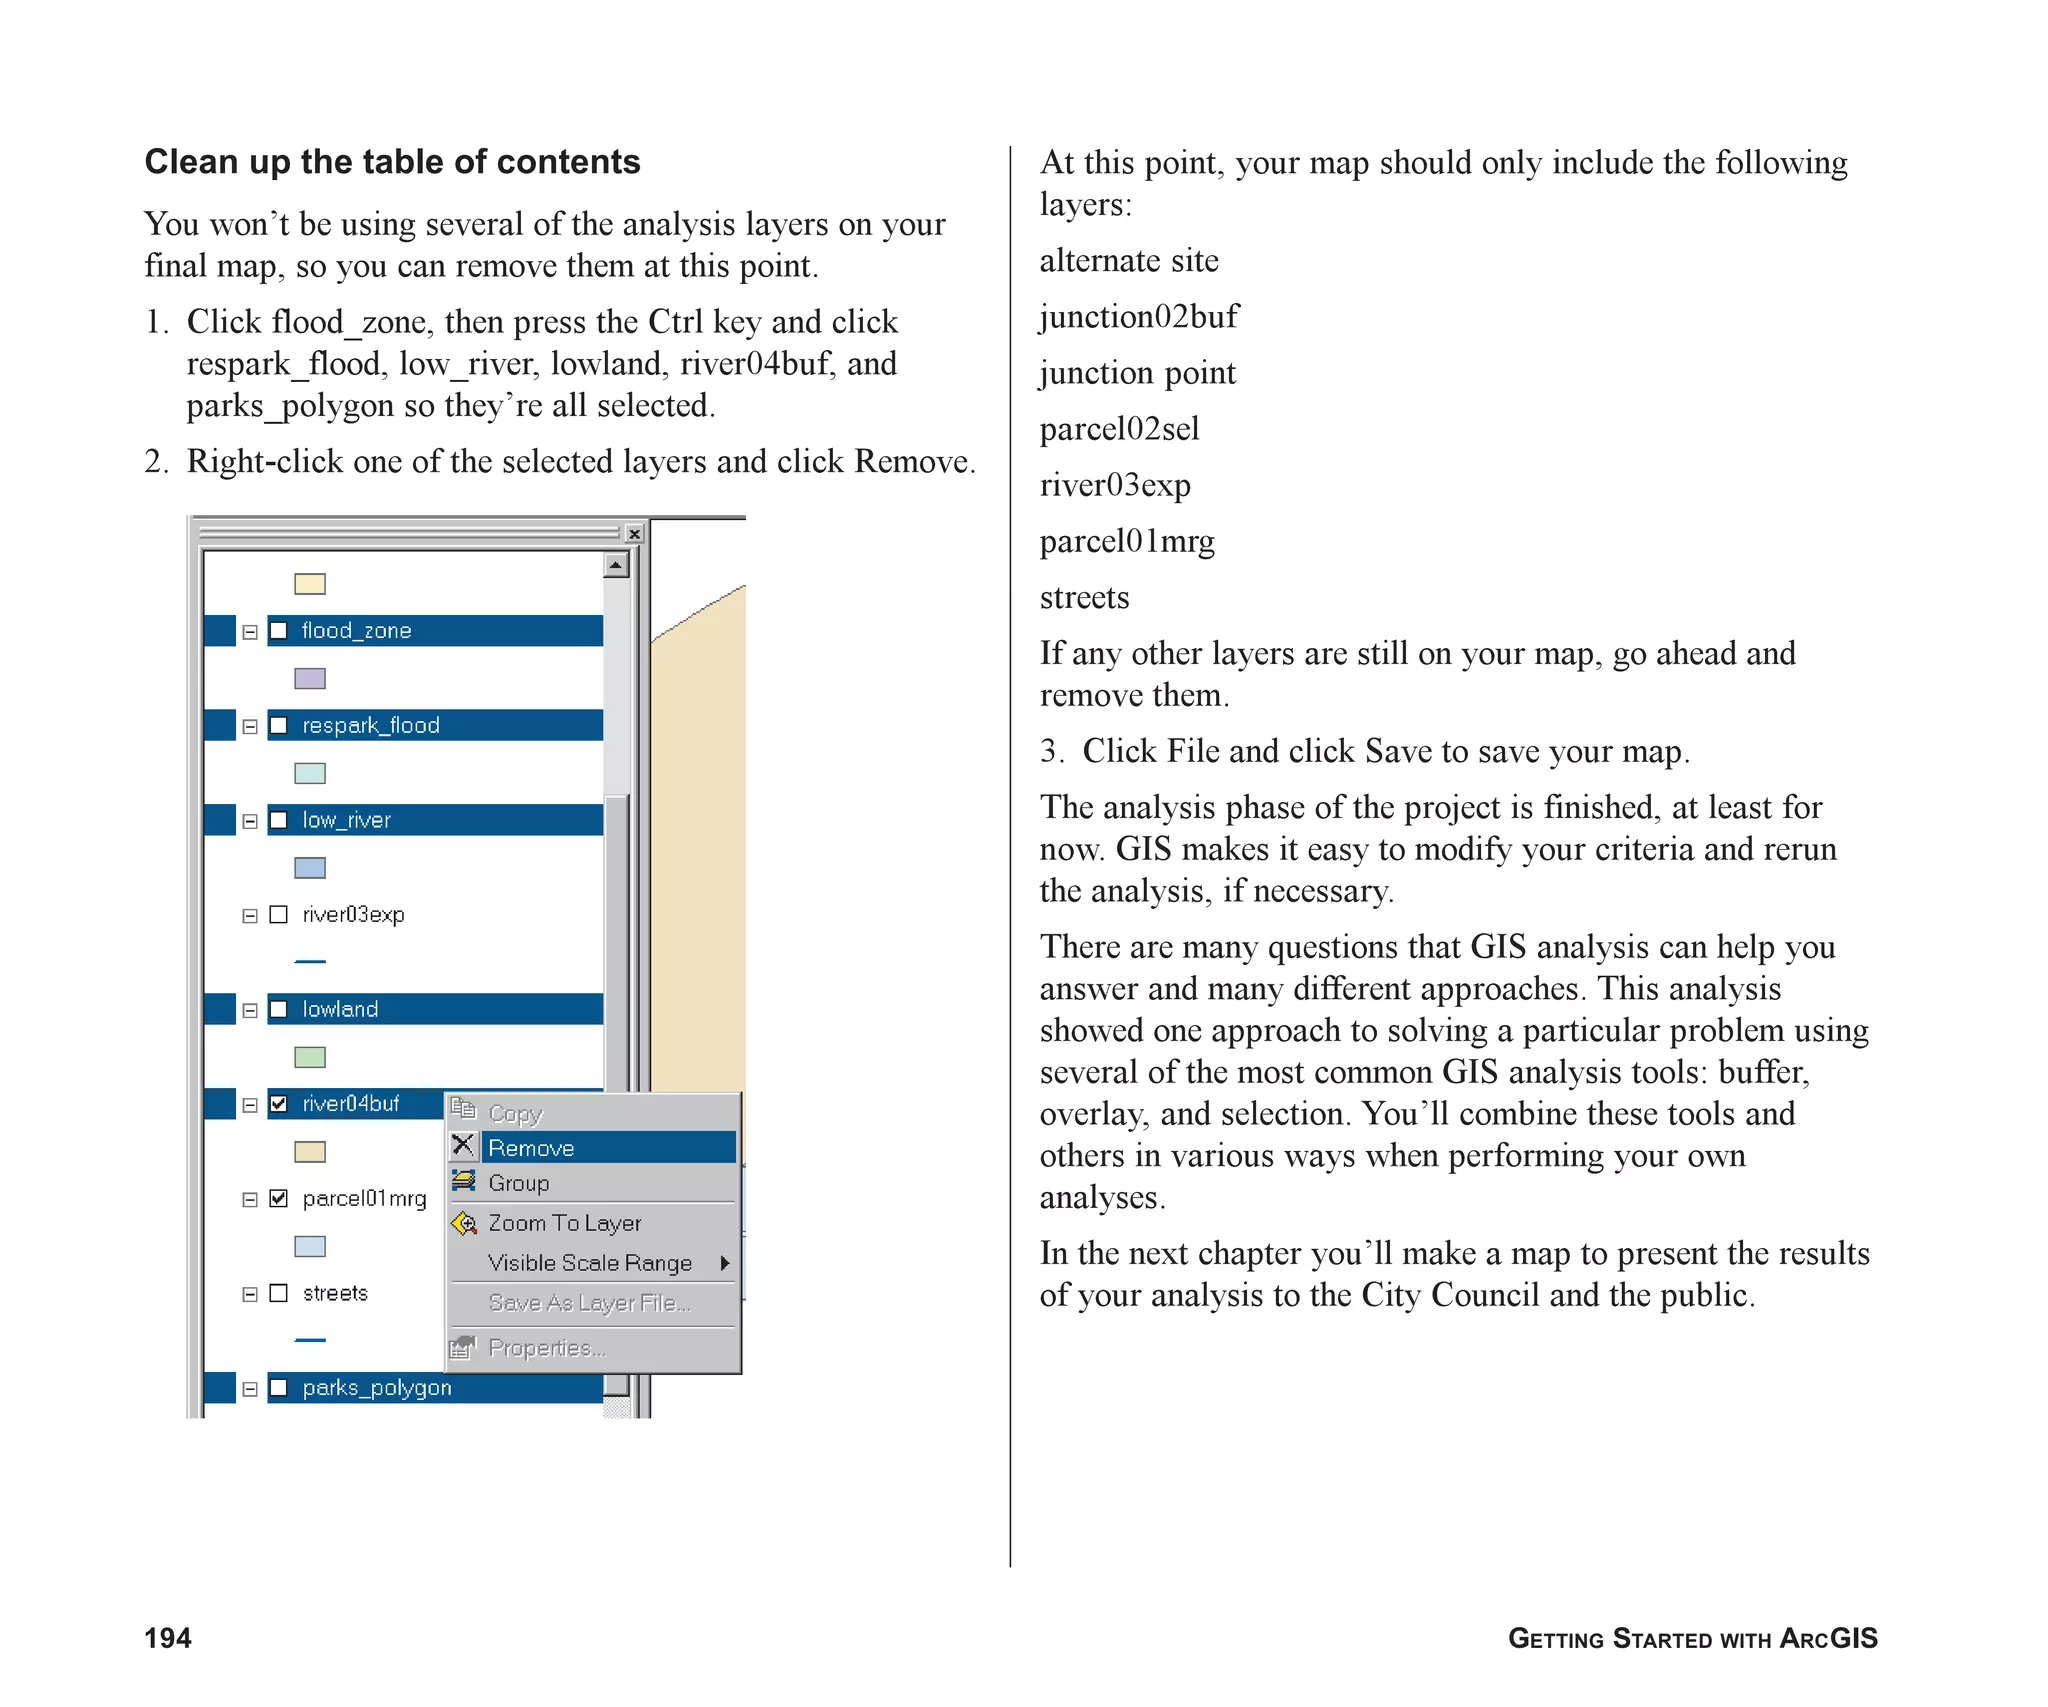
1. ArcCatalog allows you to organize and manage spatial data, create and manage geodatabases, and document data with metadata.
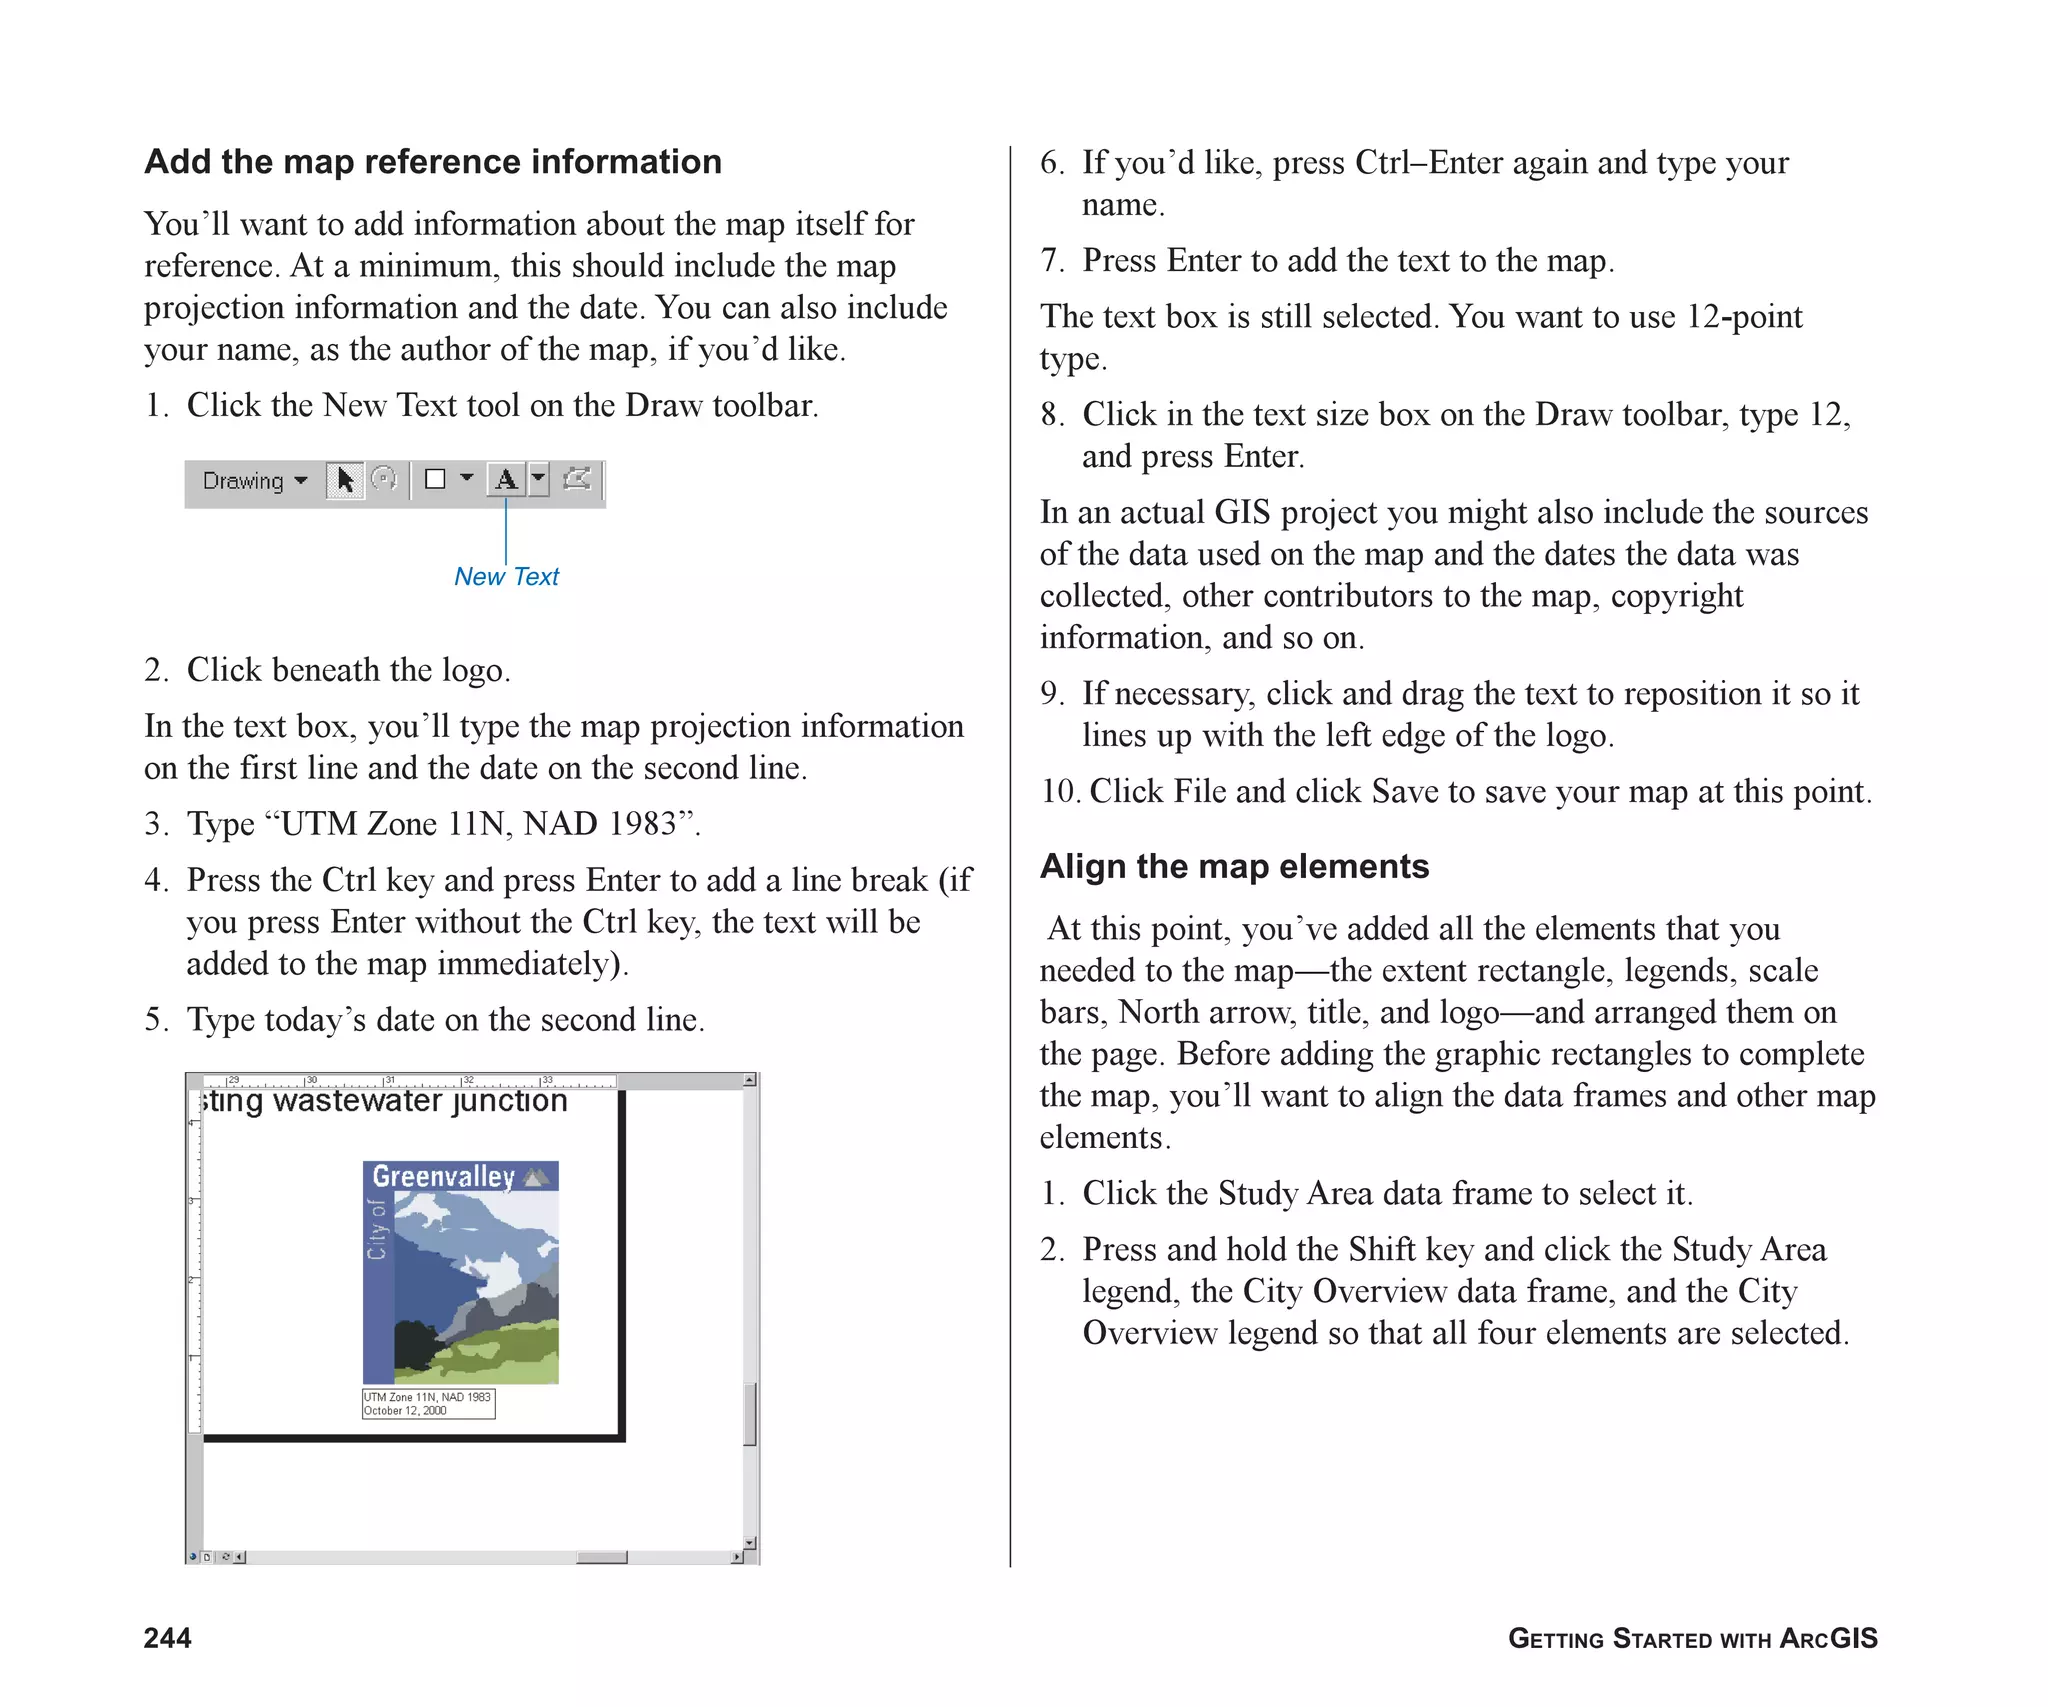
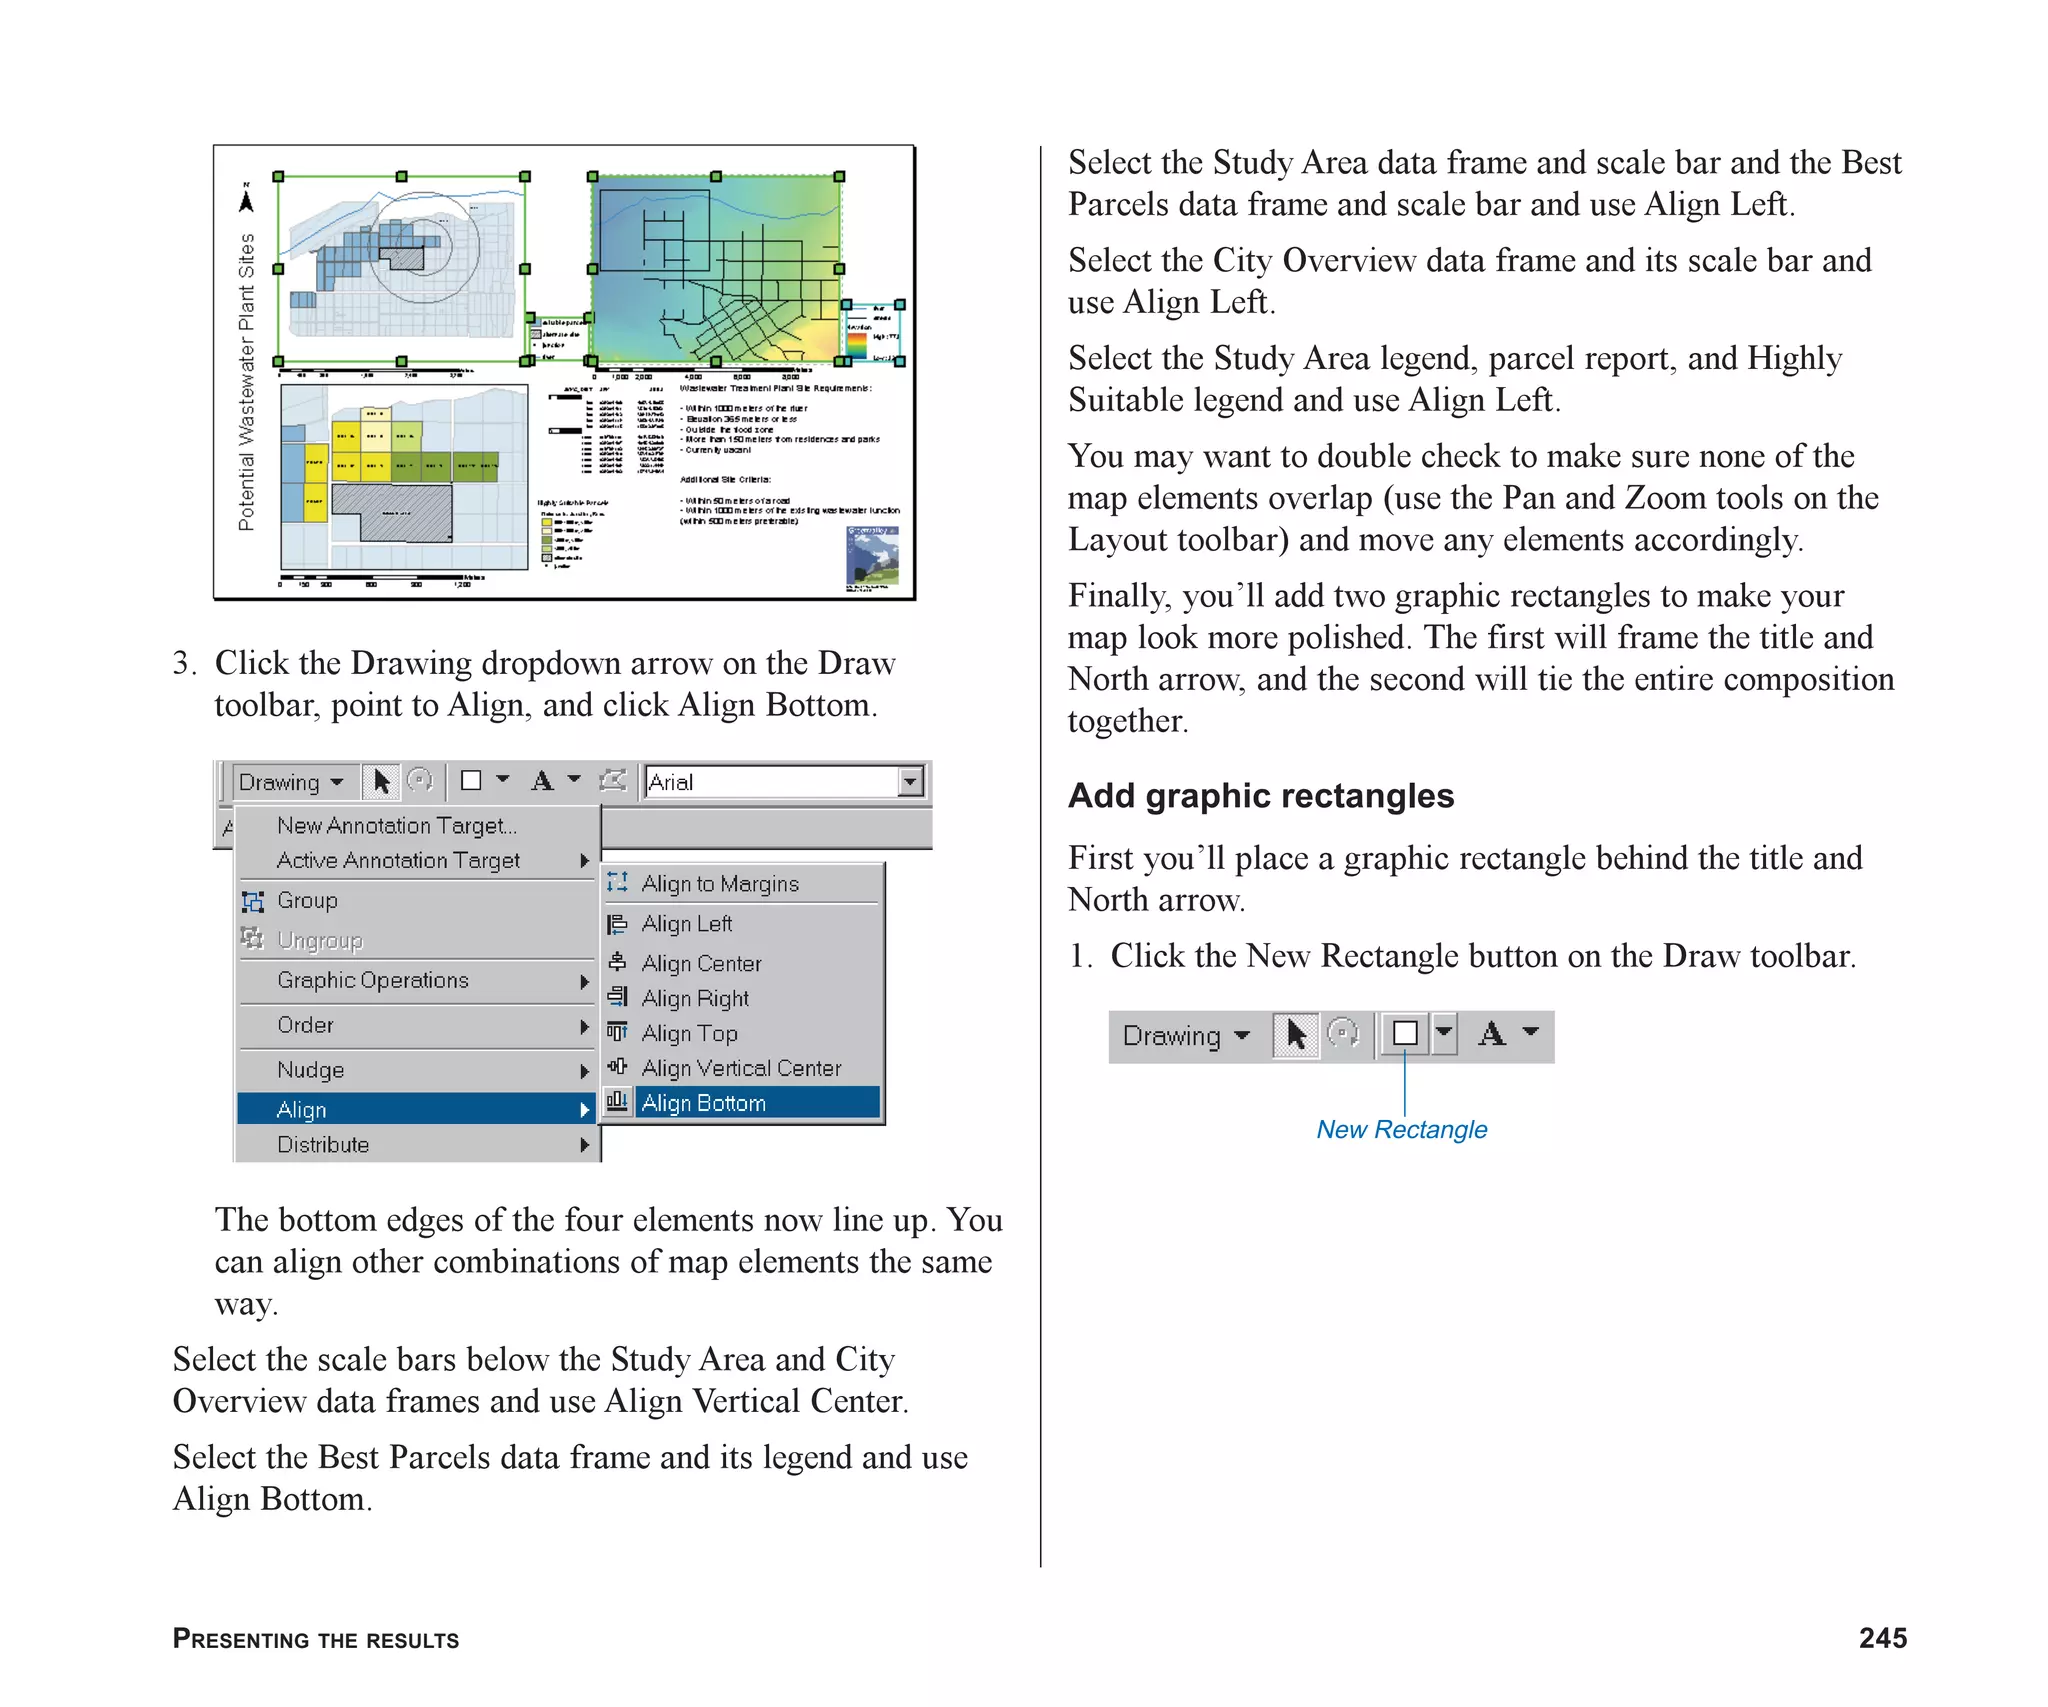
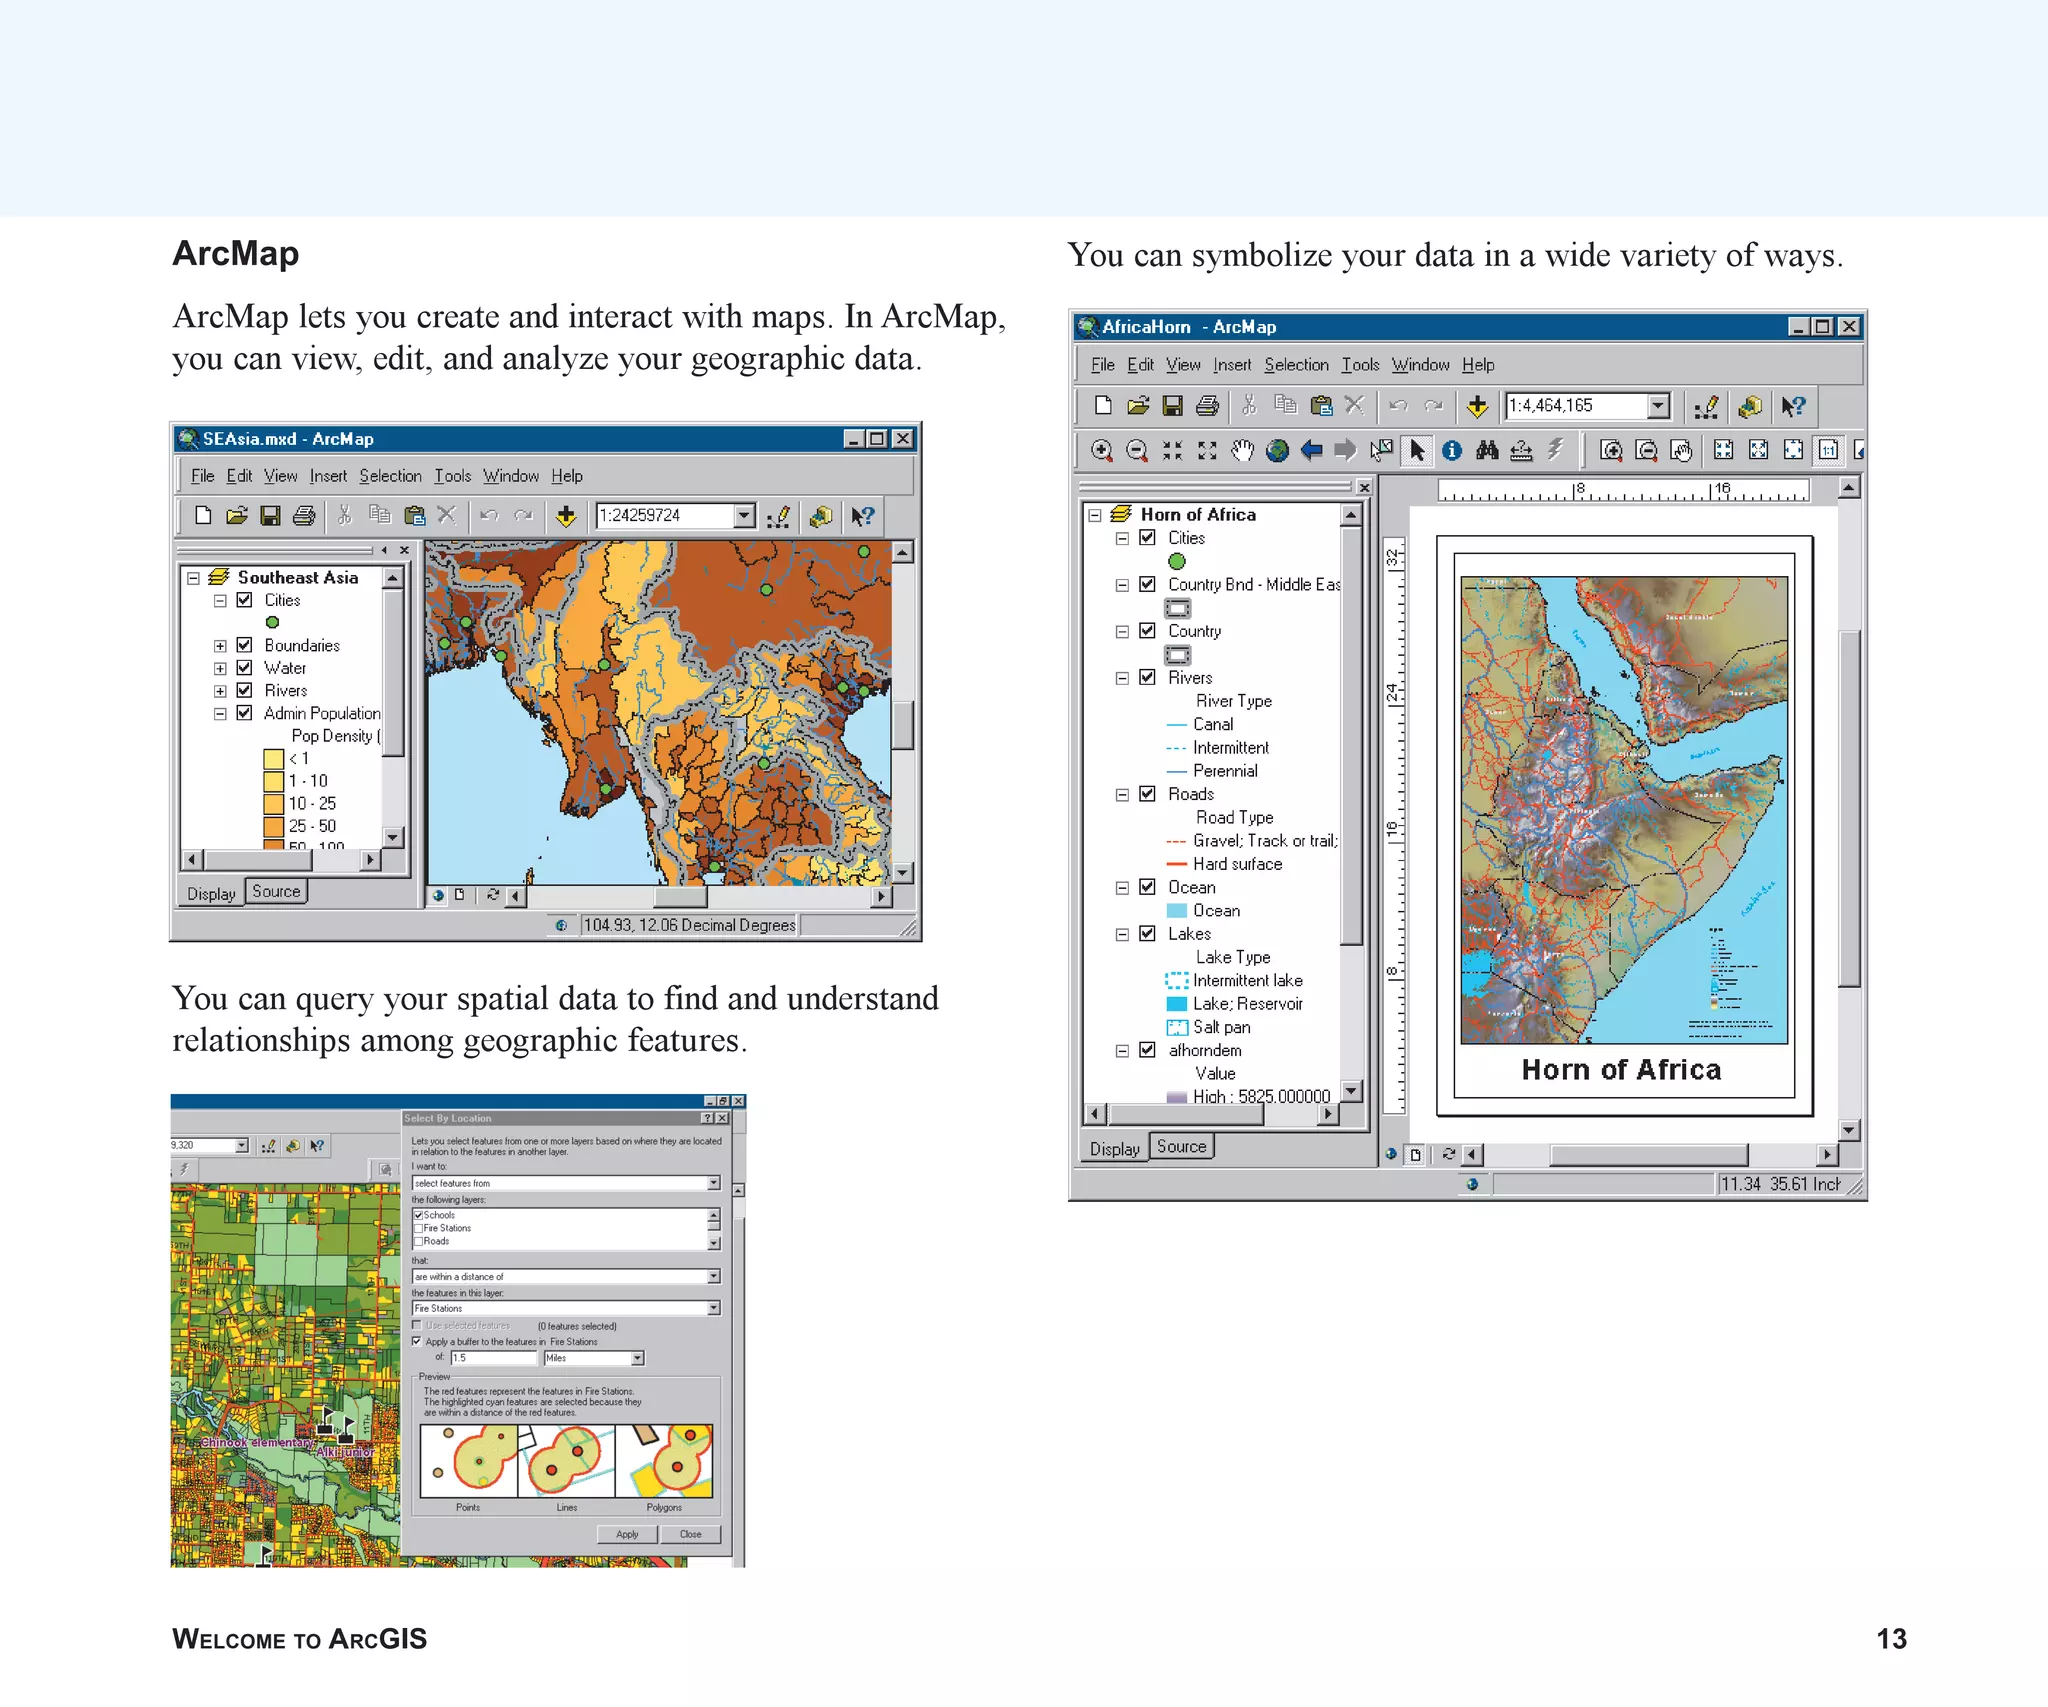
2. ArcMap is used for mapping, editing, and map-based analysis tasks. You can view, query, and symbolize data in ArcMap.
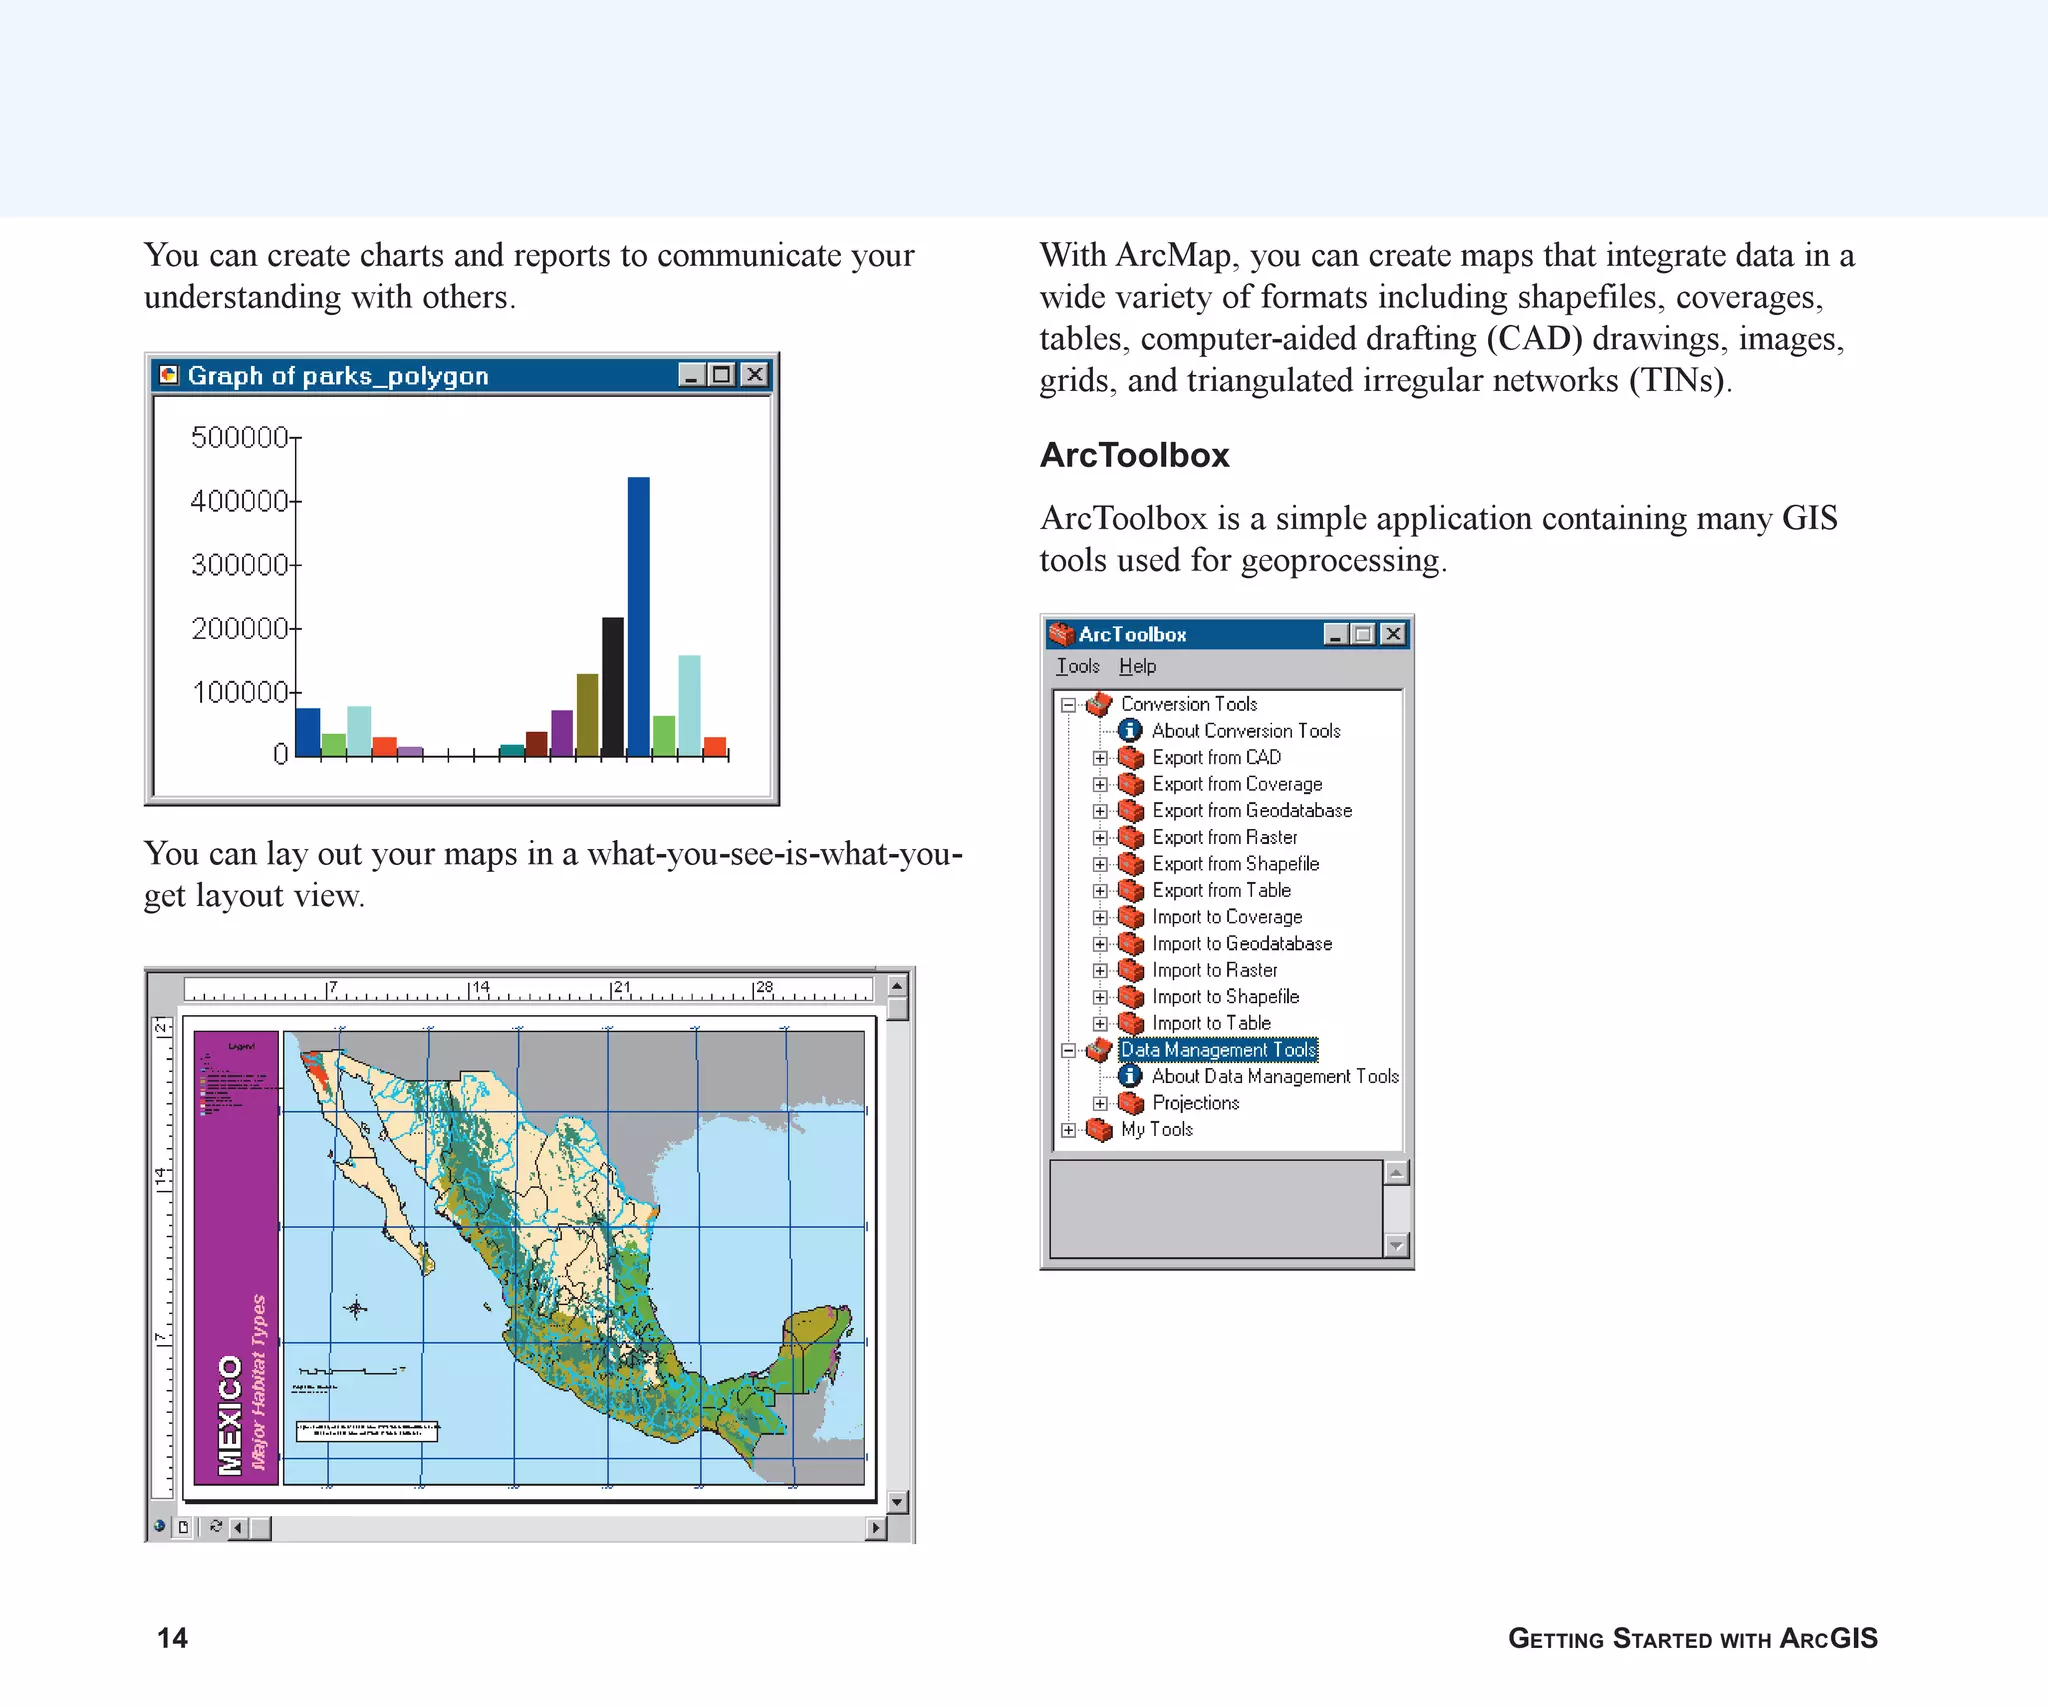
3. ArcToolbox provides geoprocessing tools for data conversion and analysis tasks.


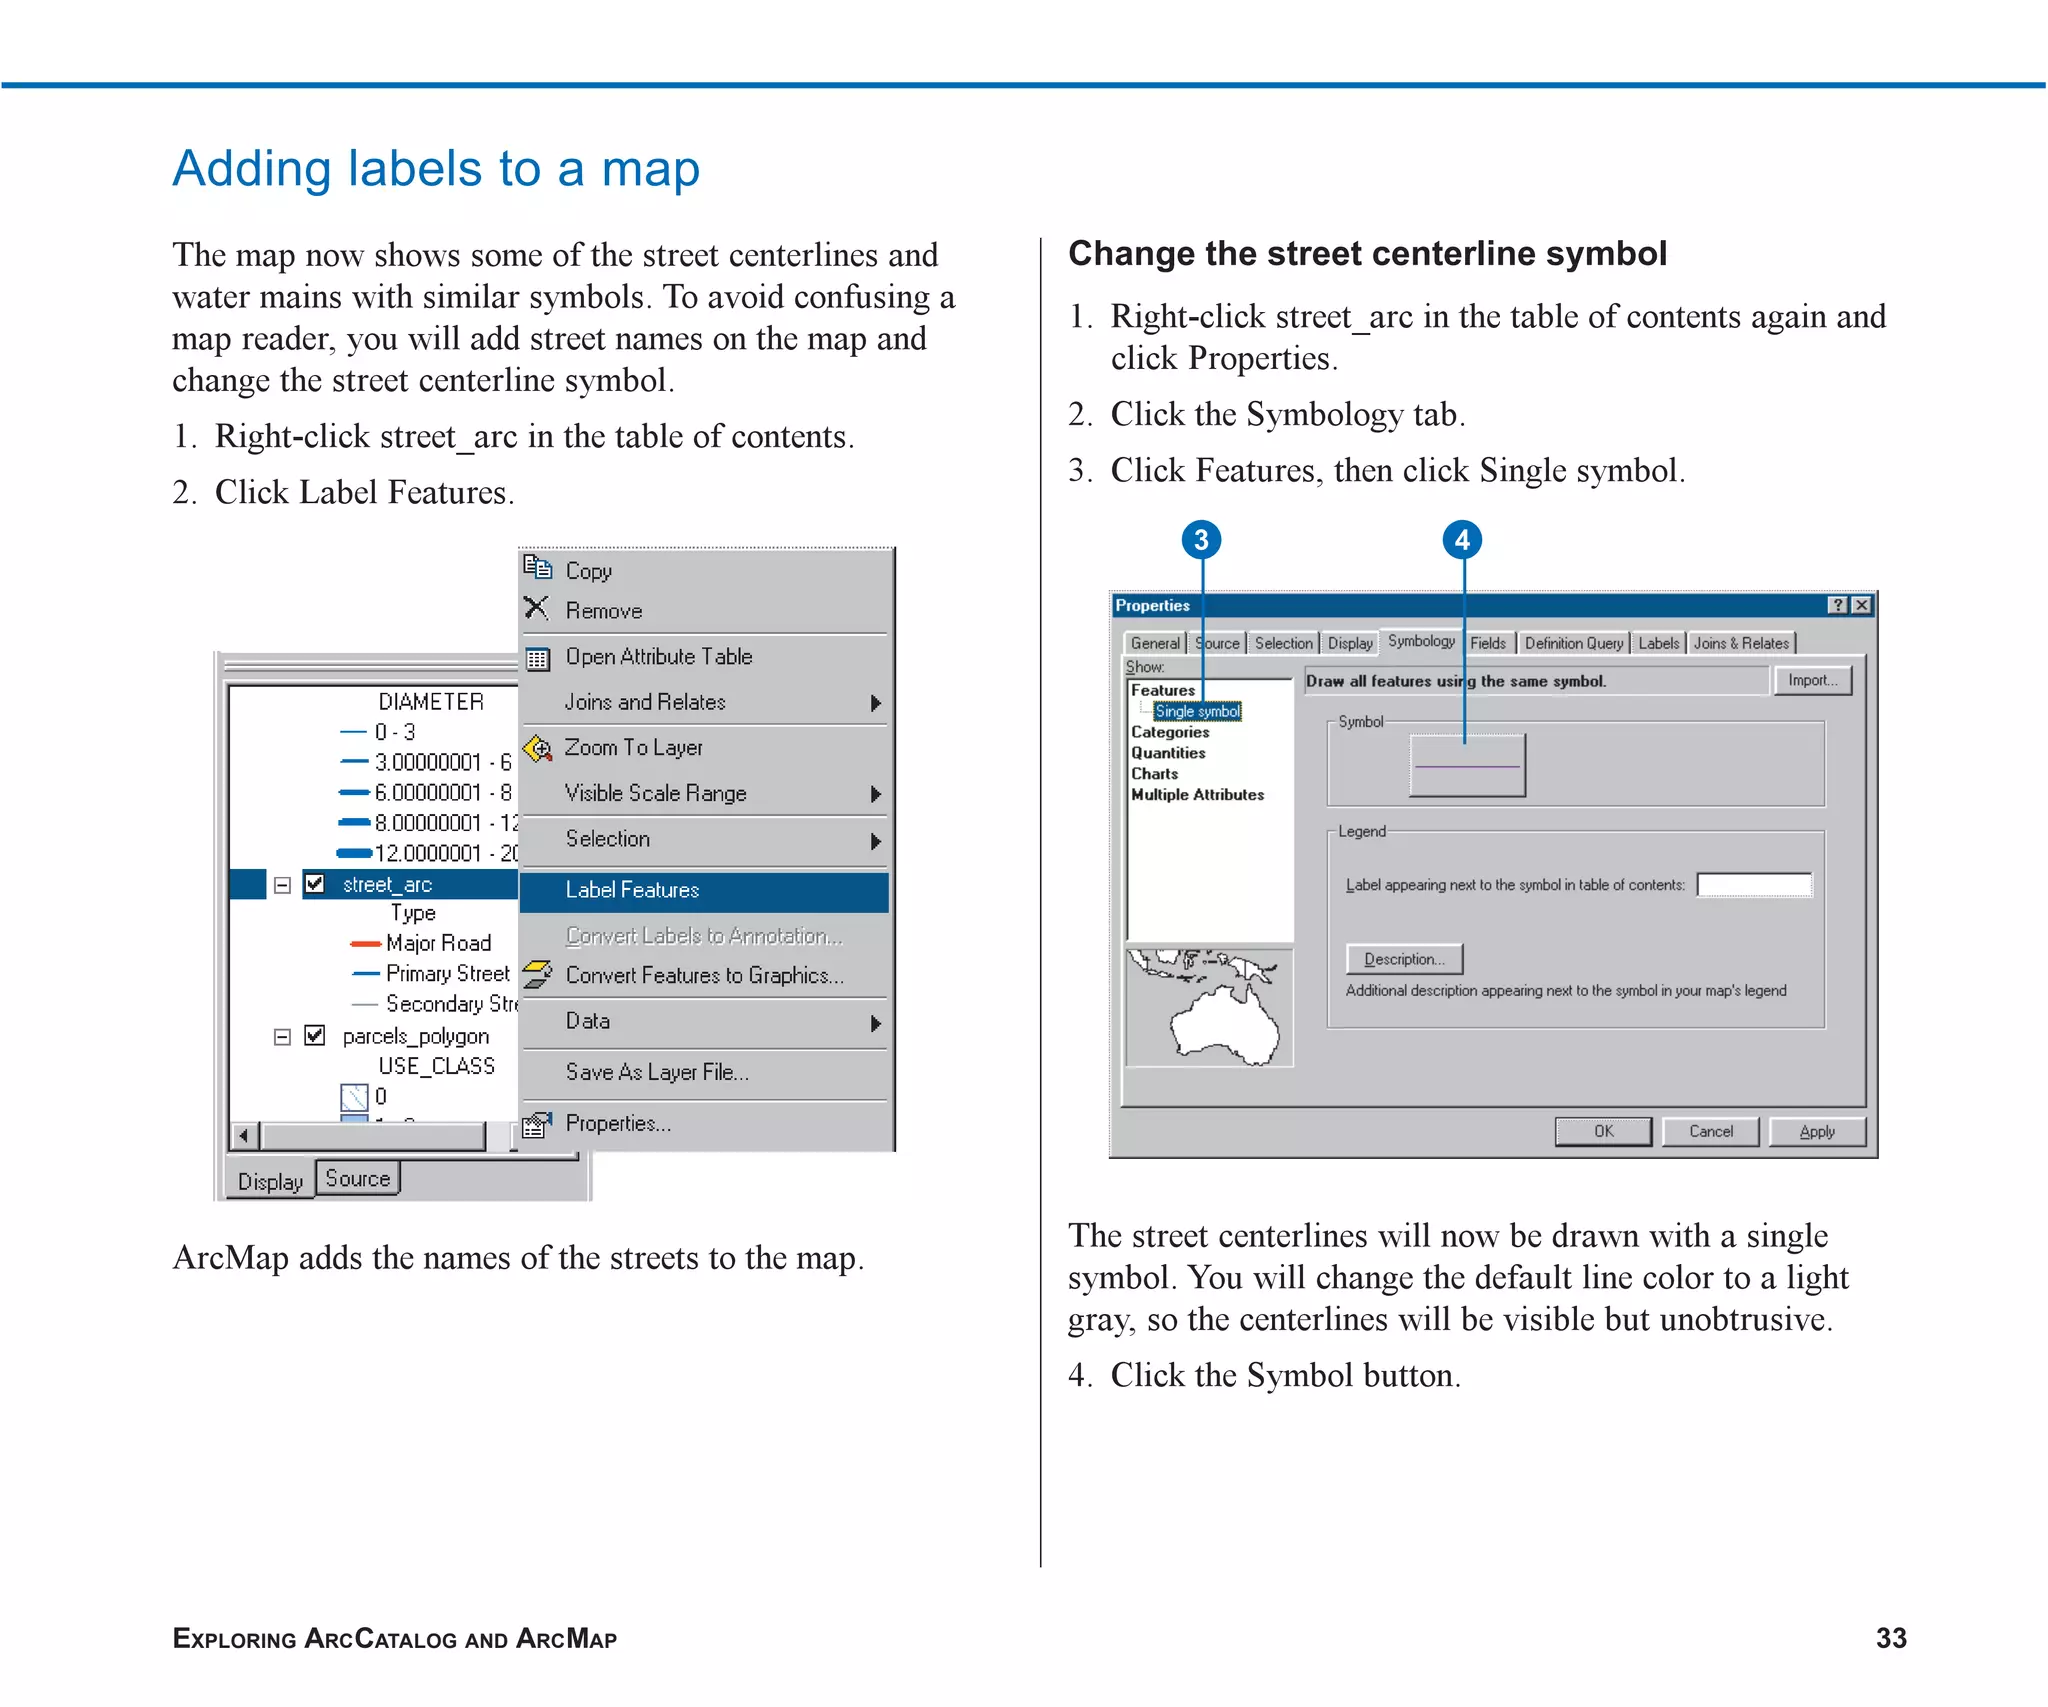
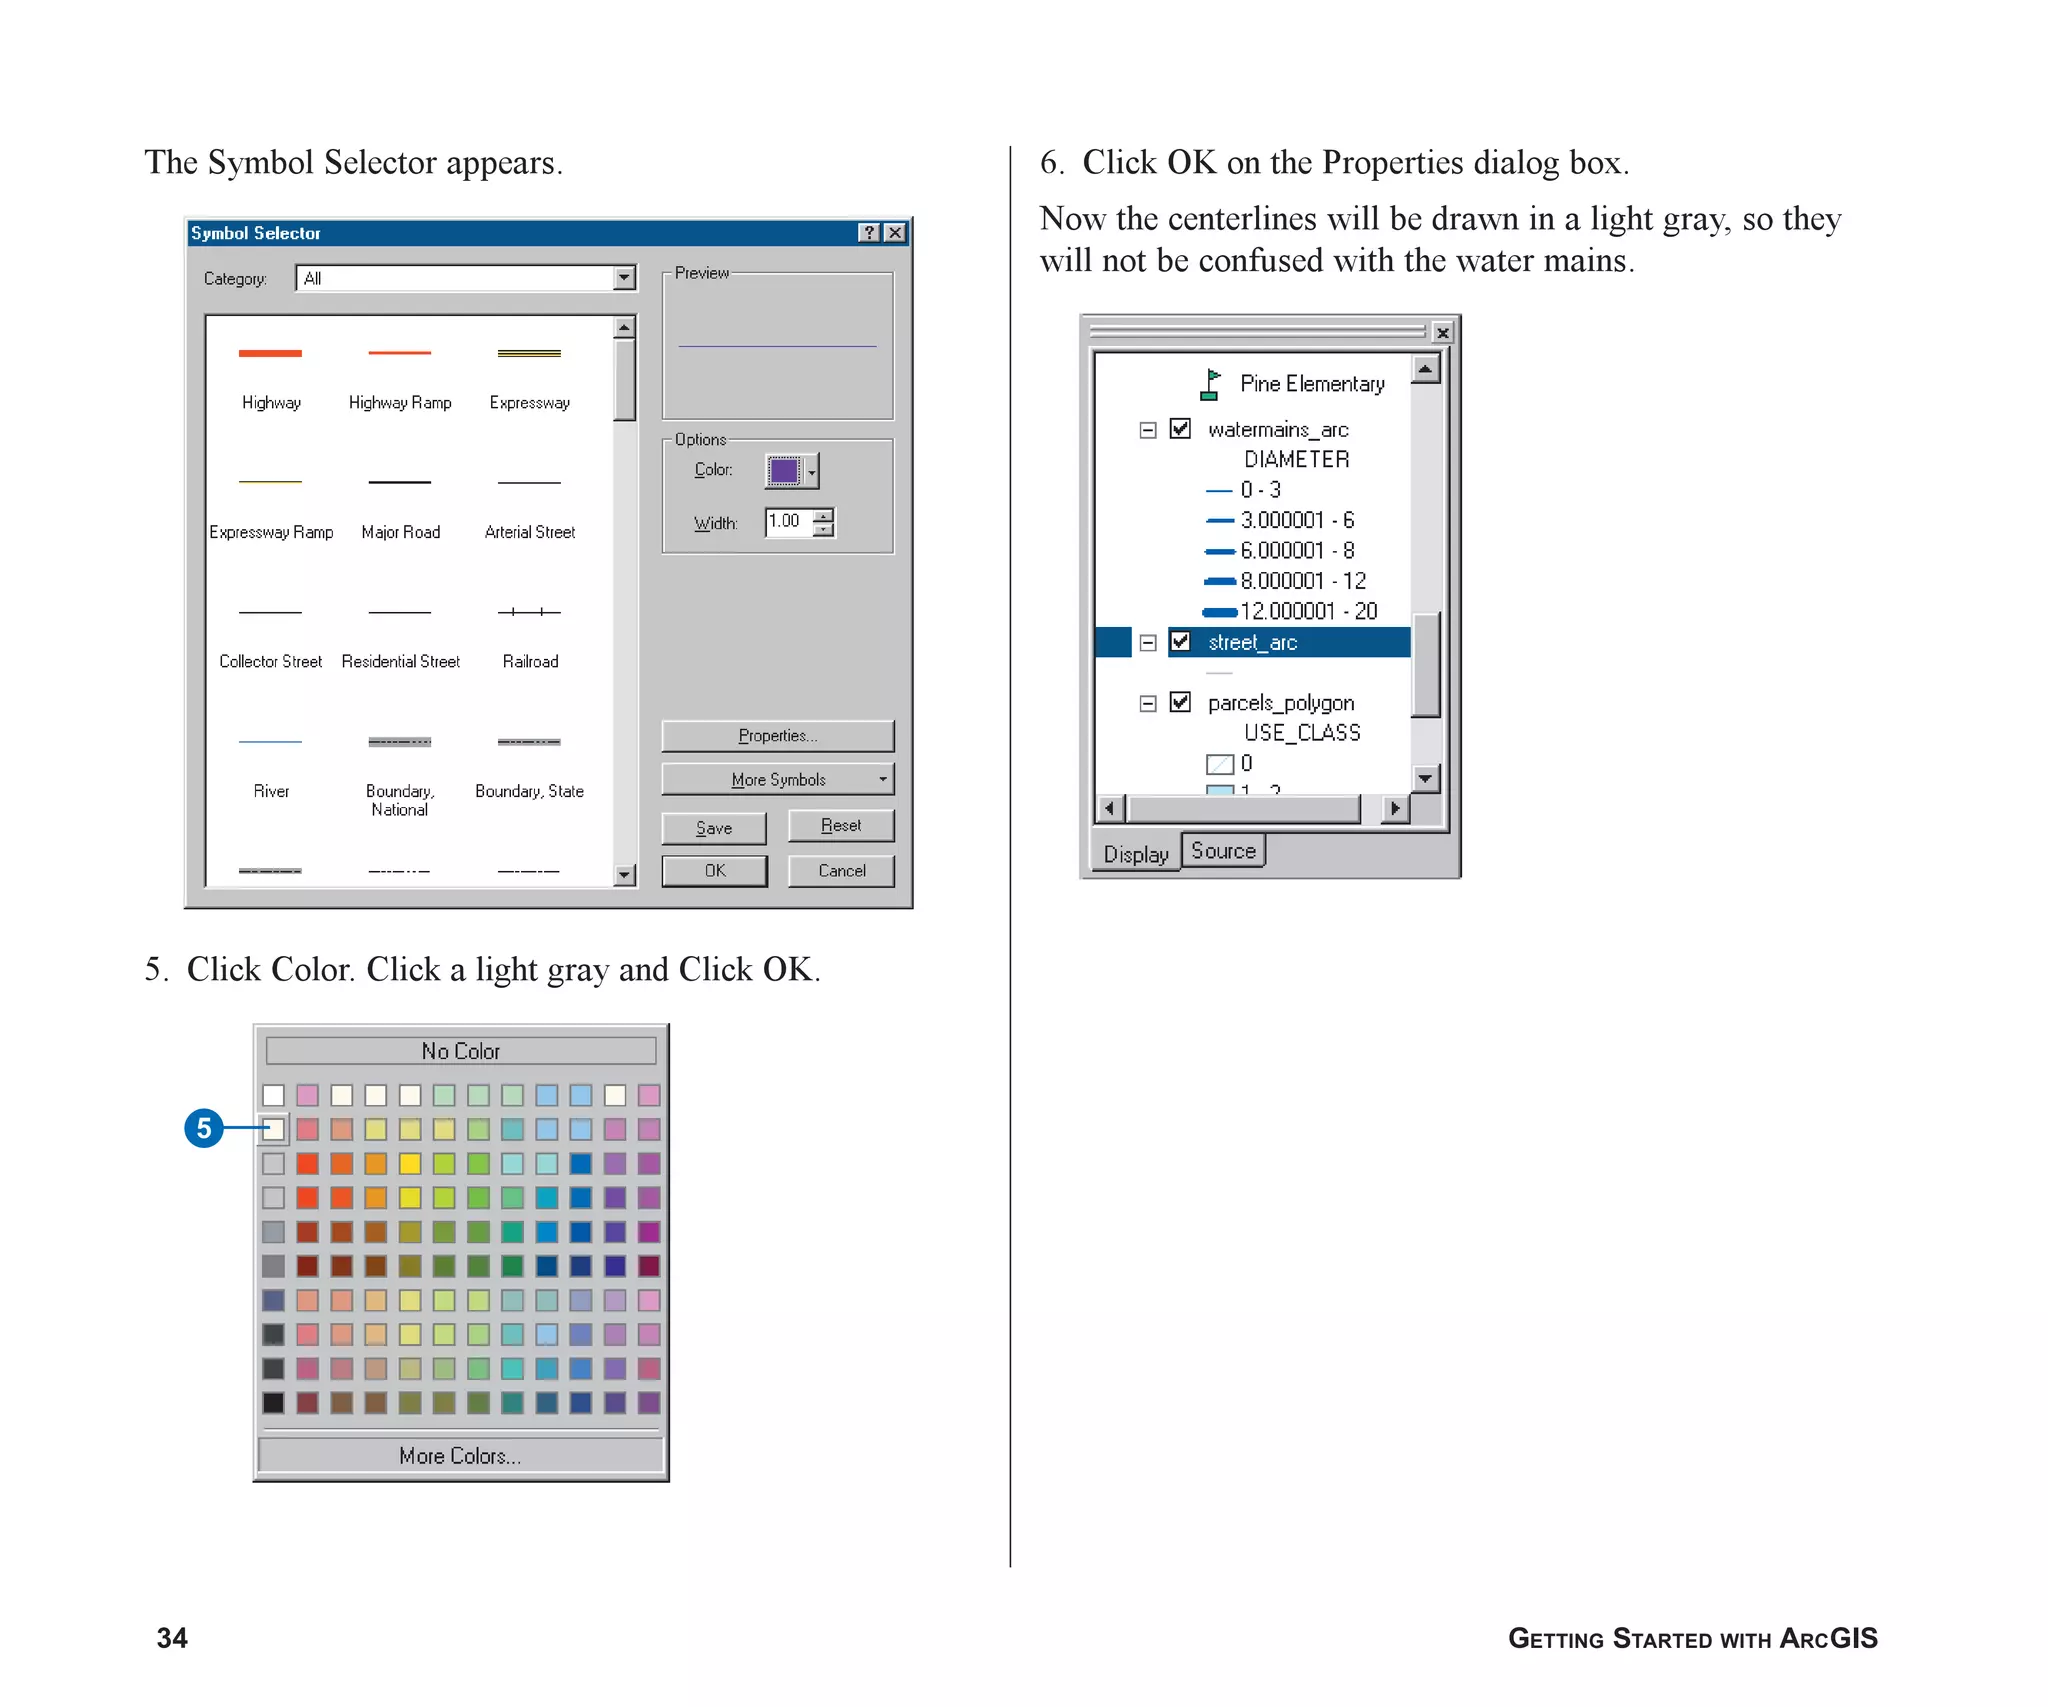


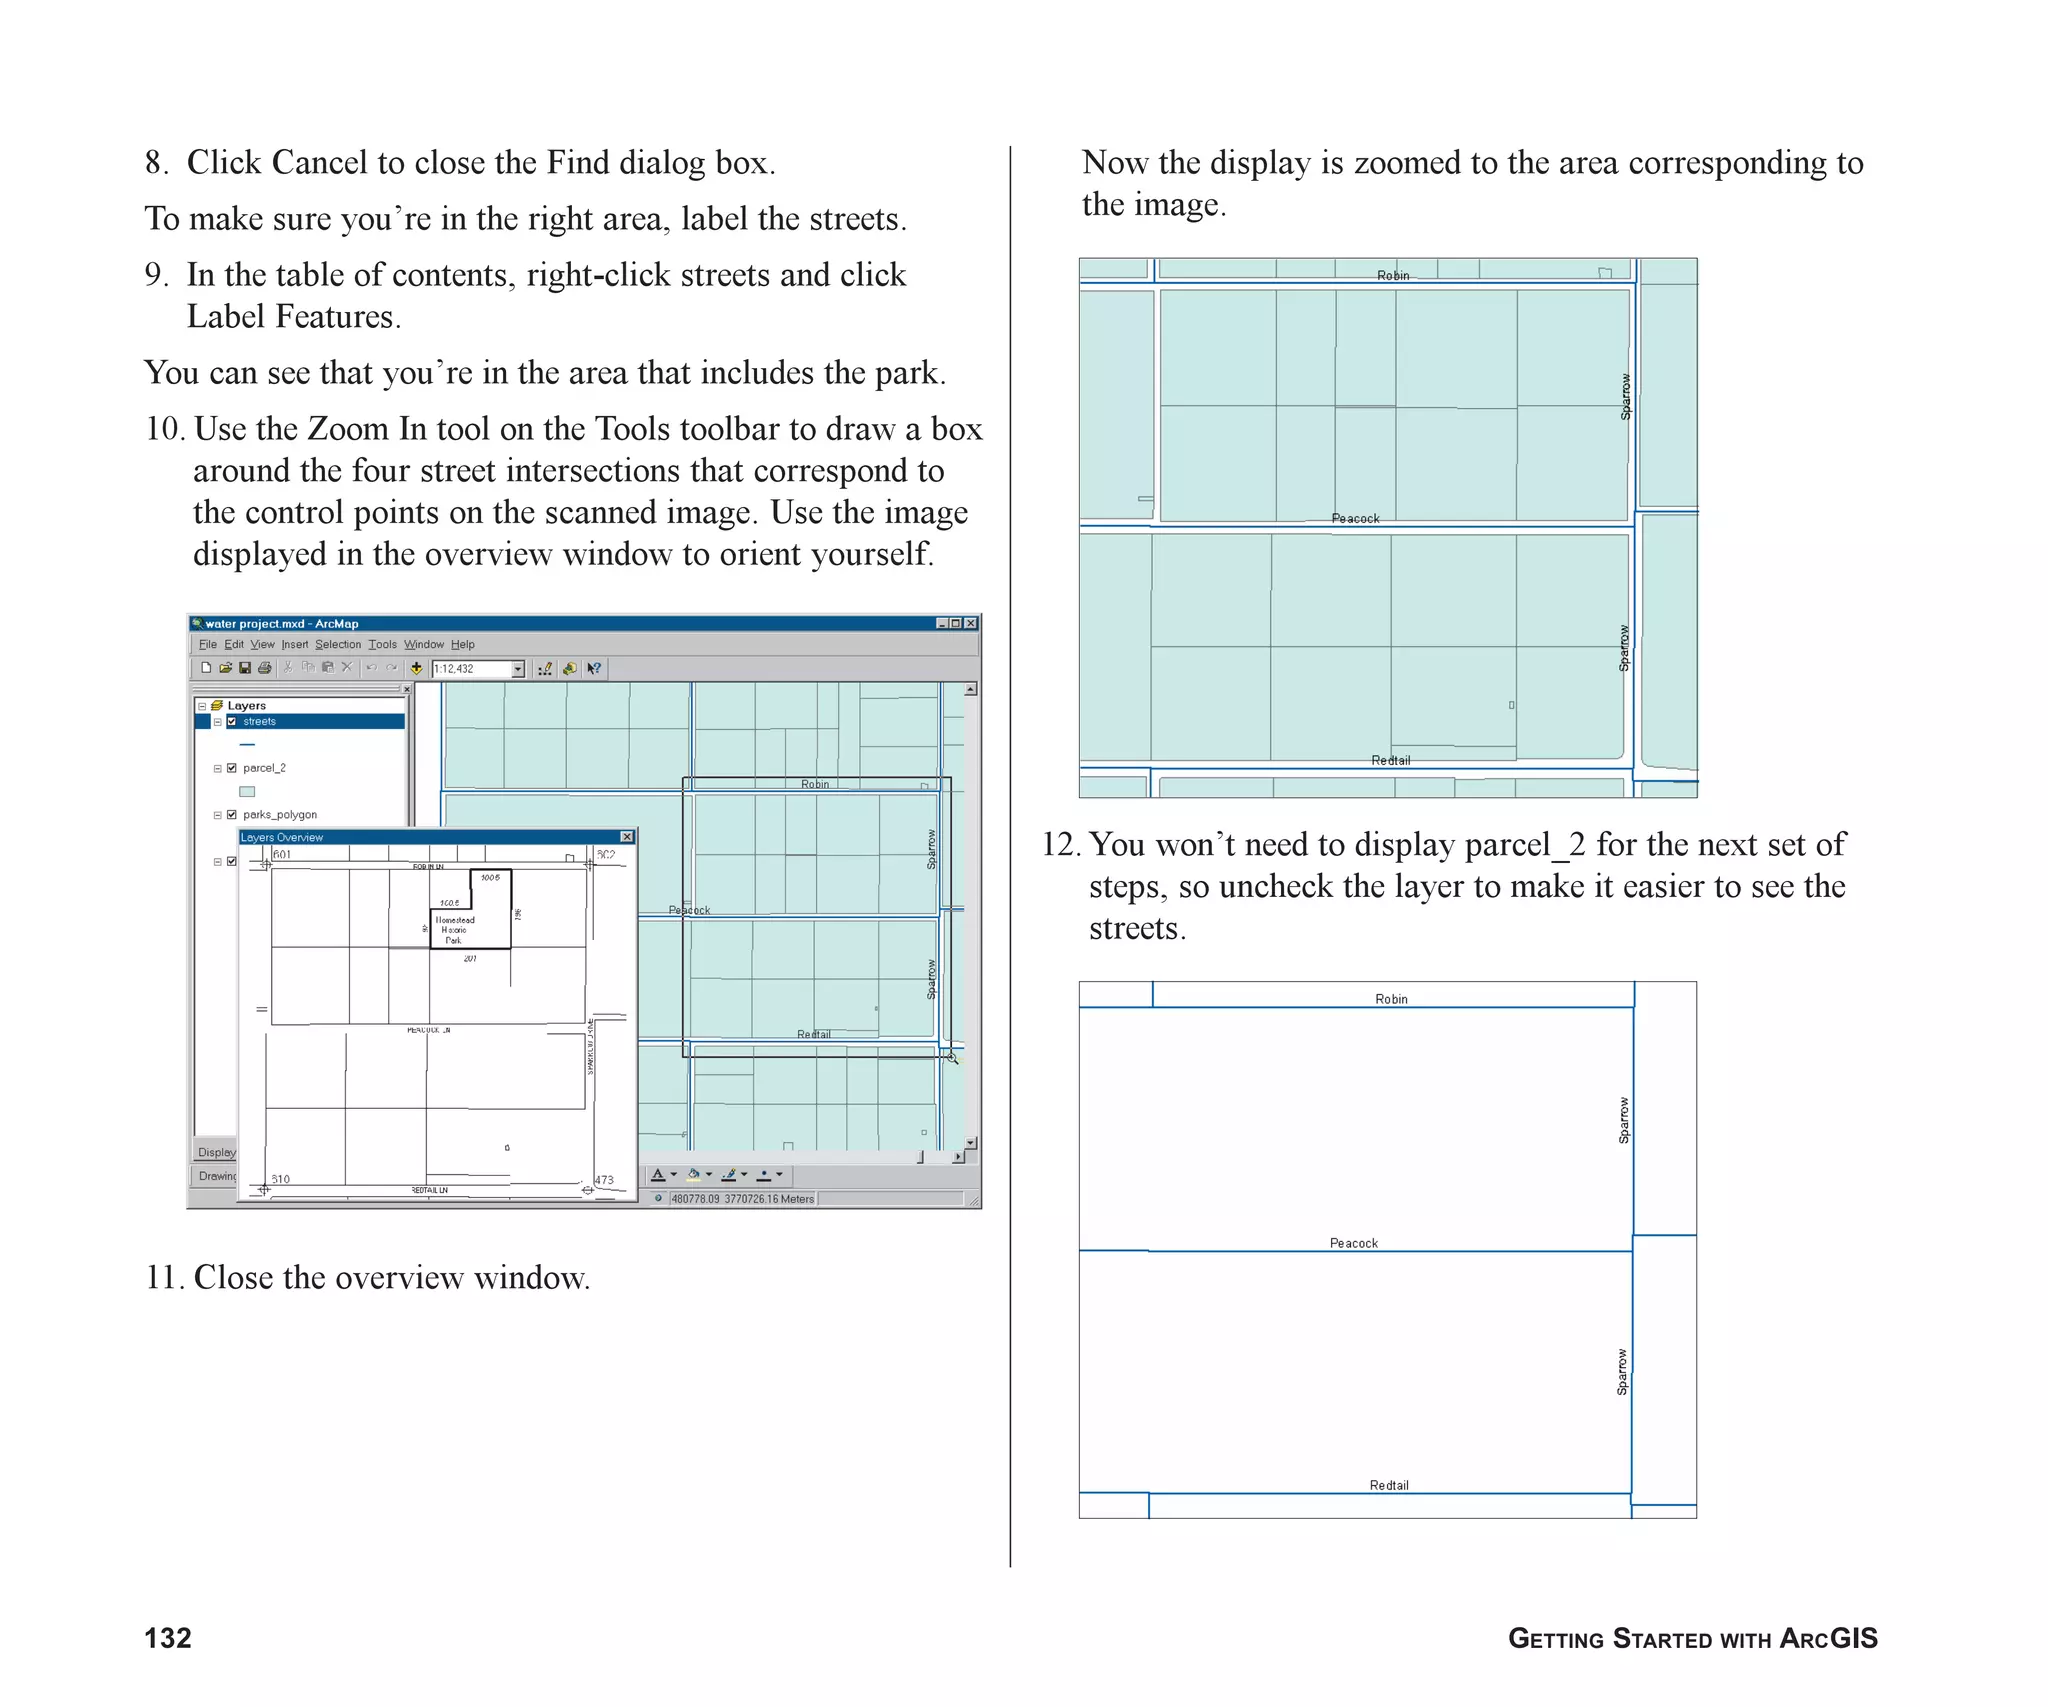
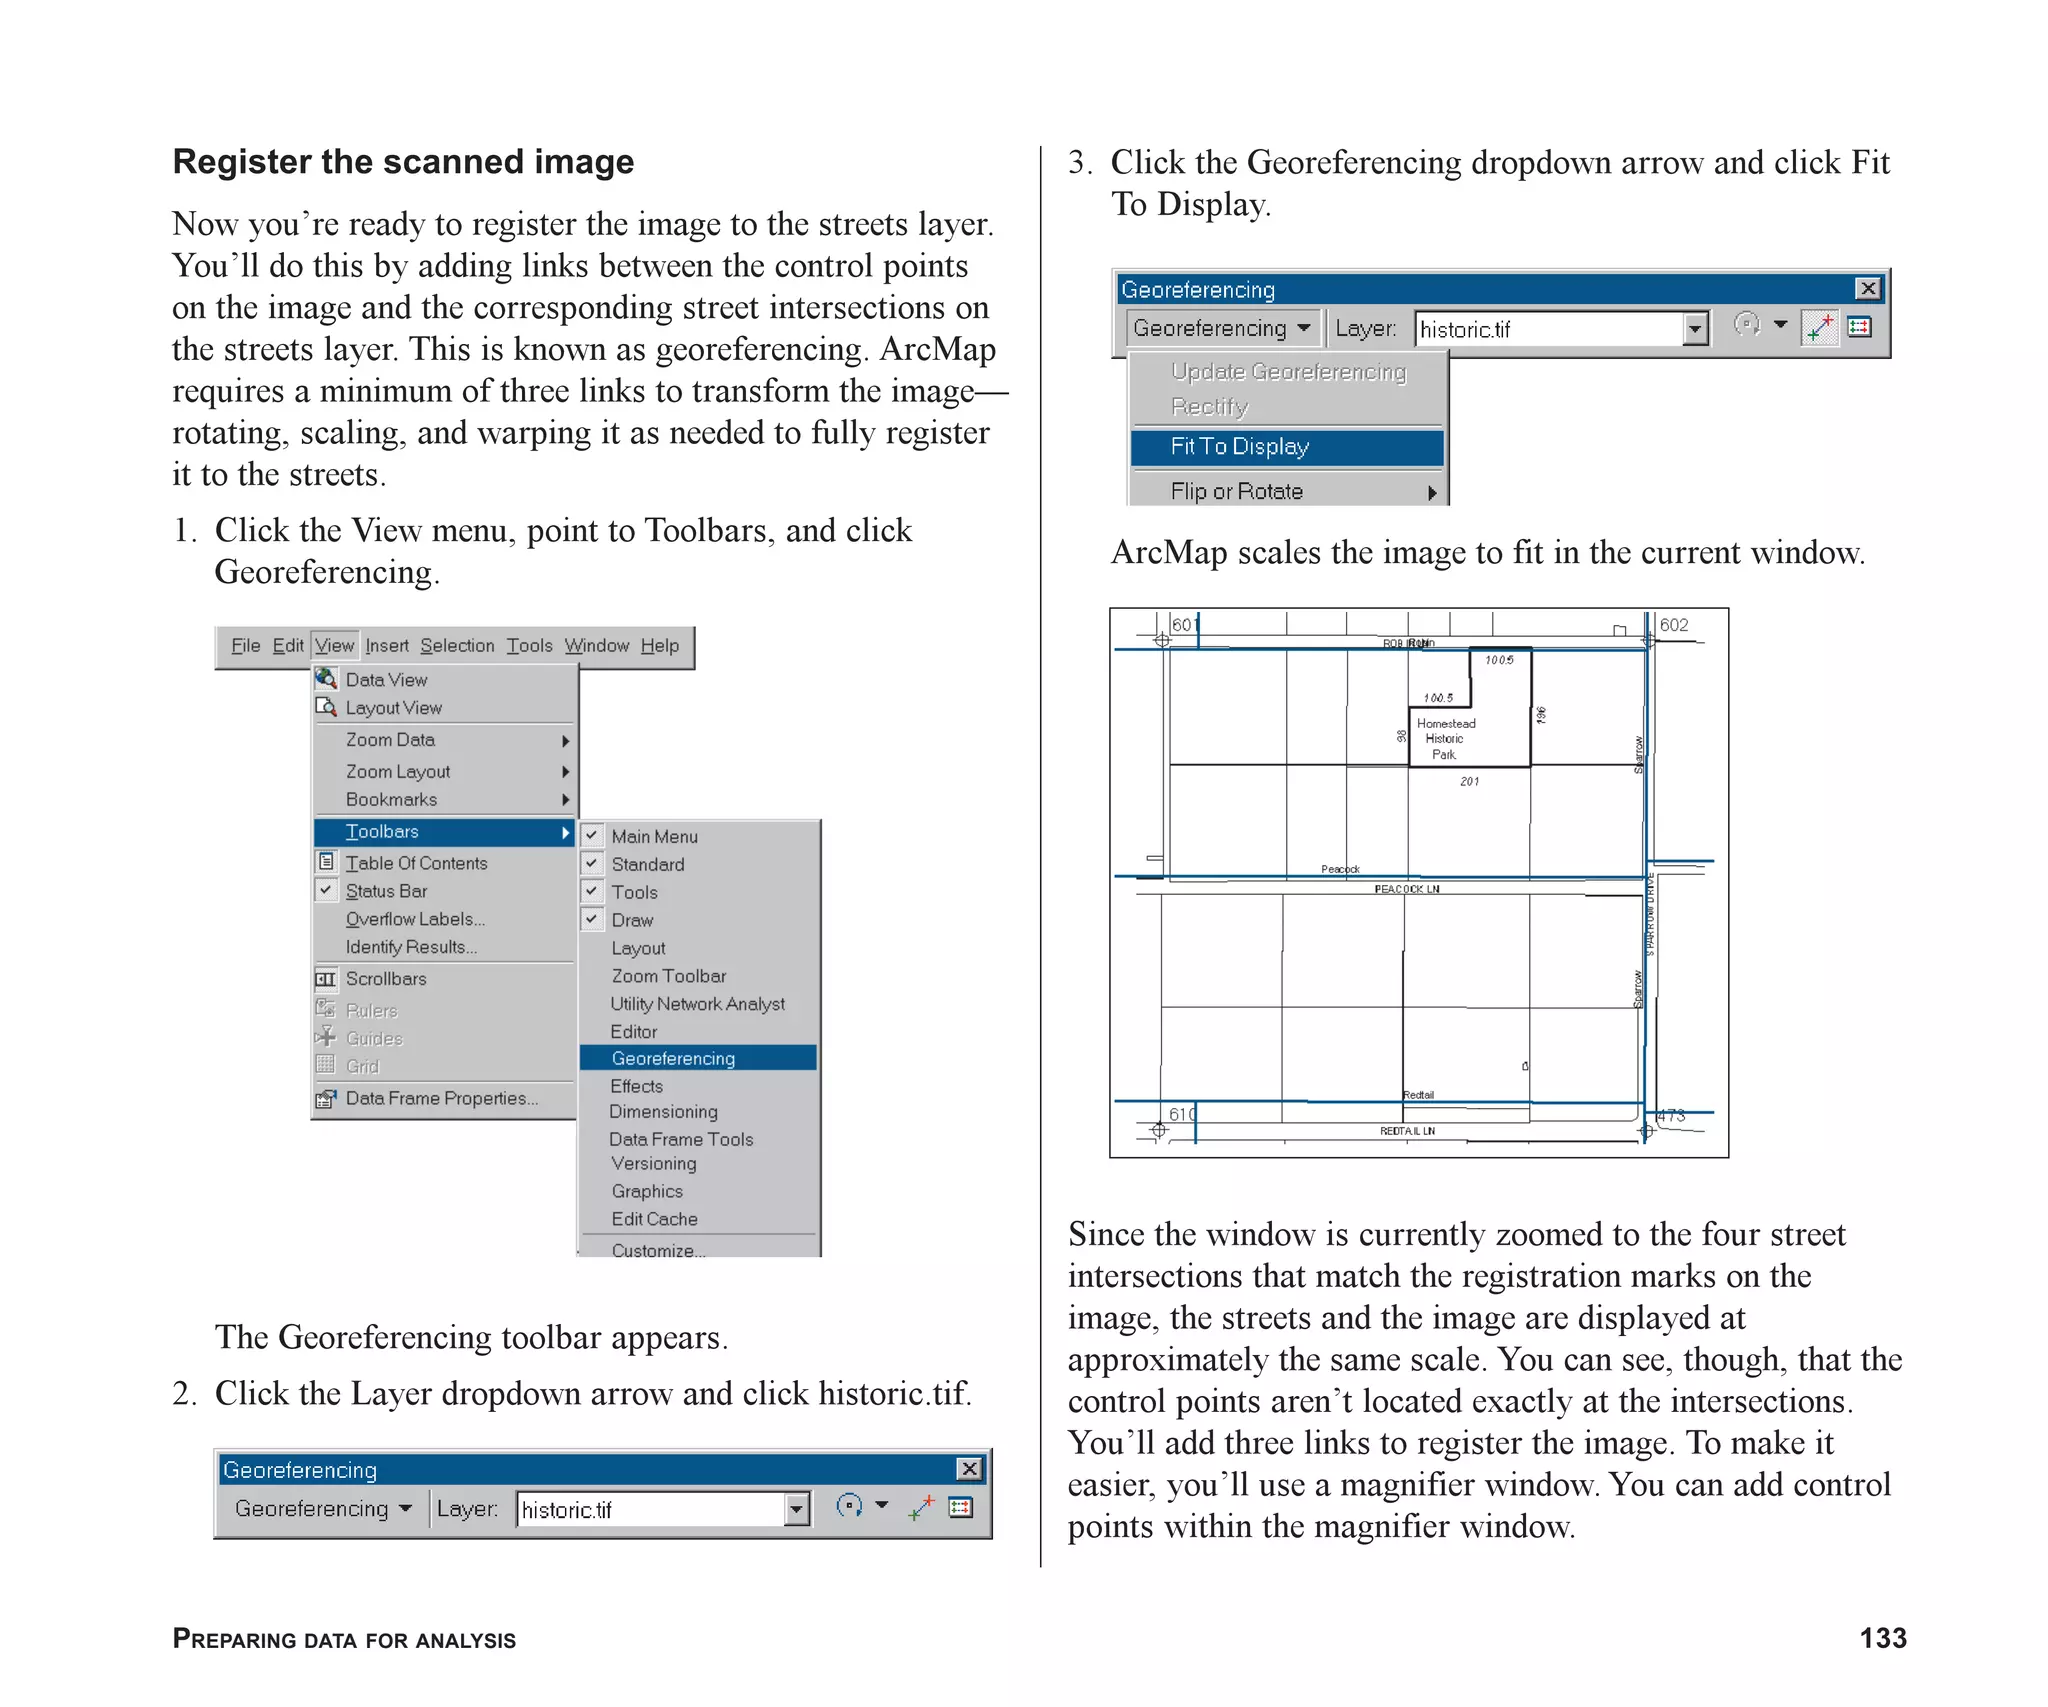
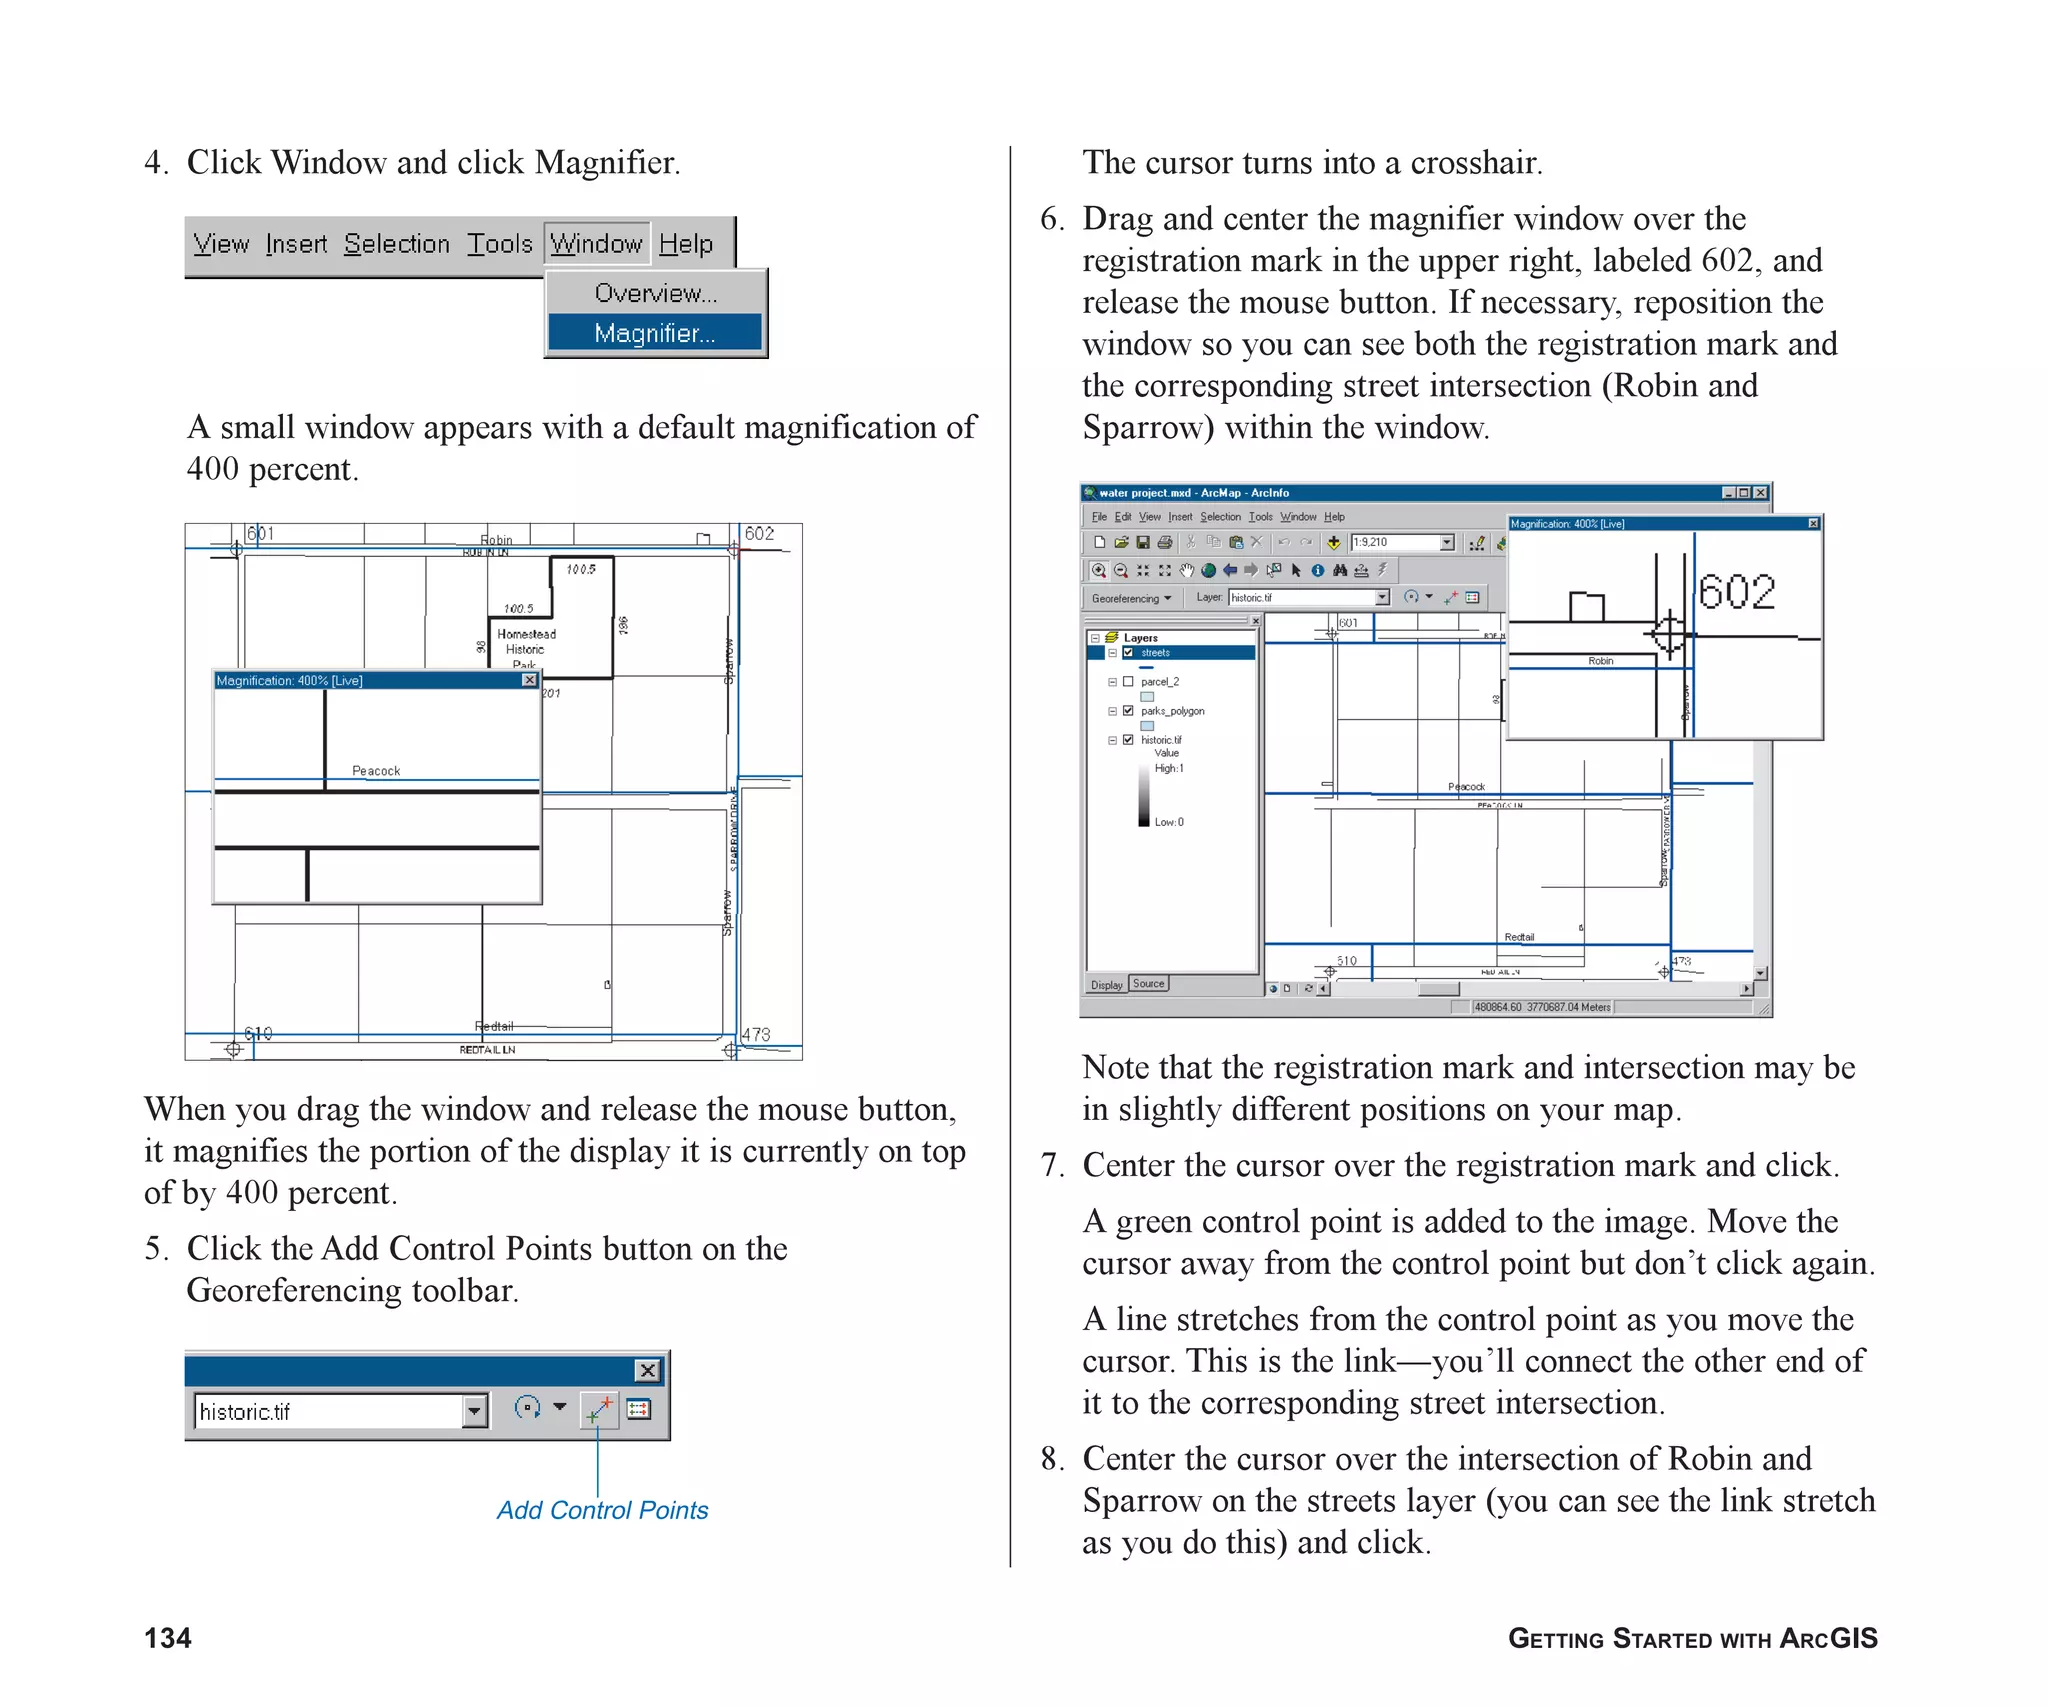
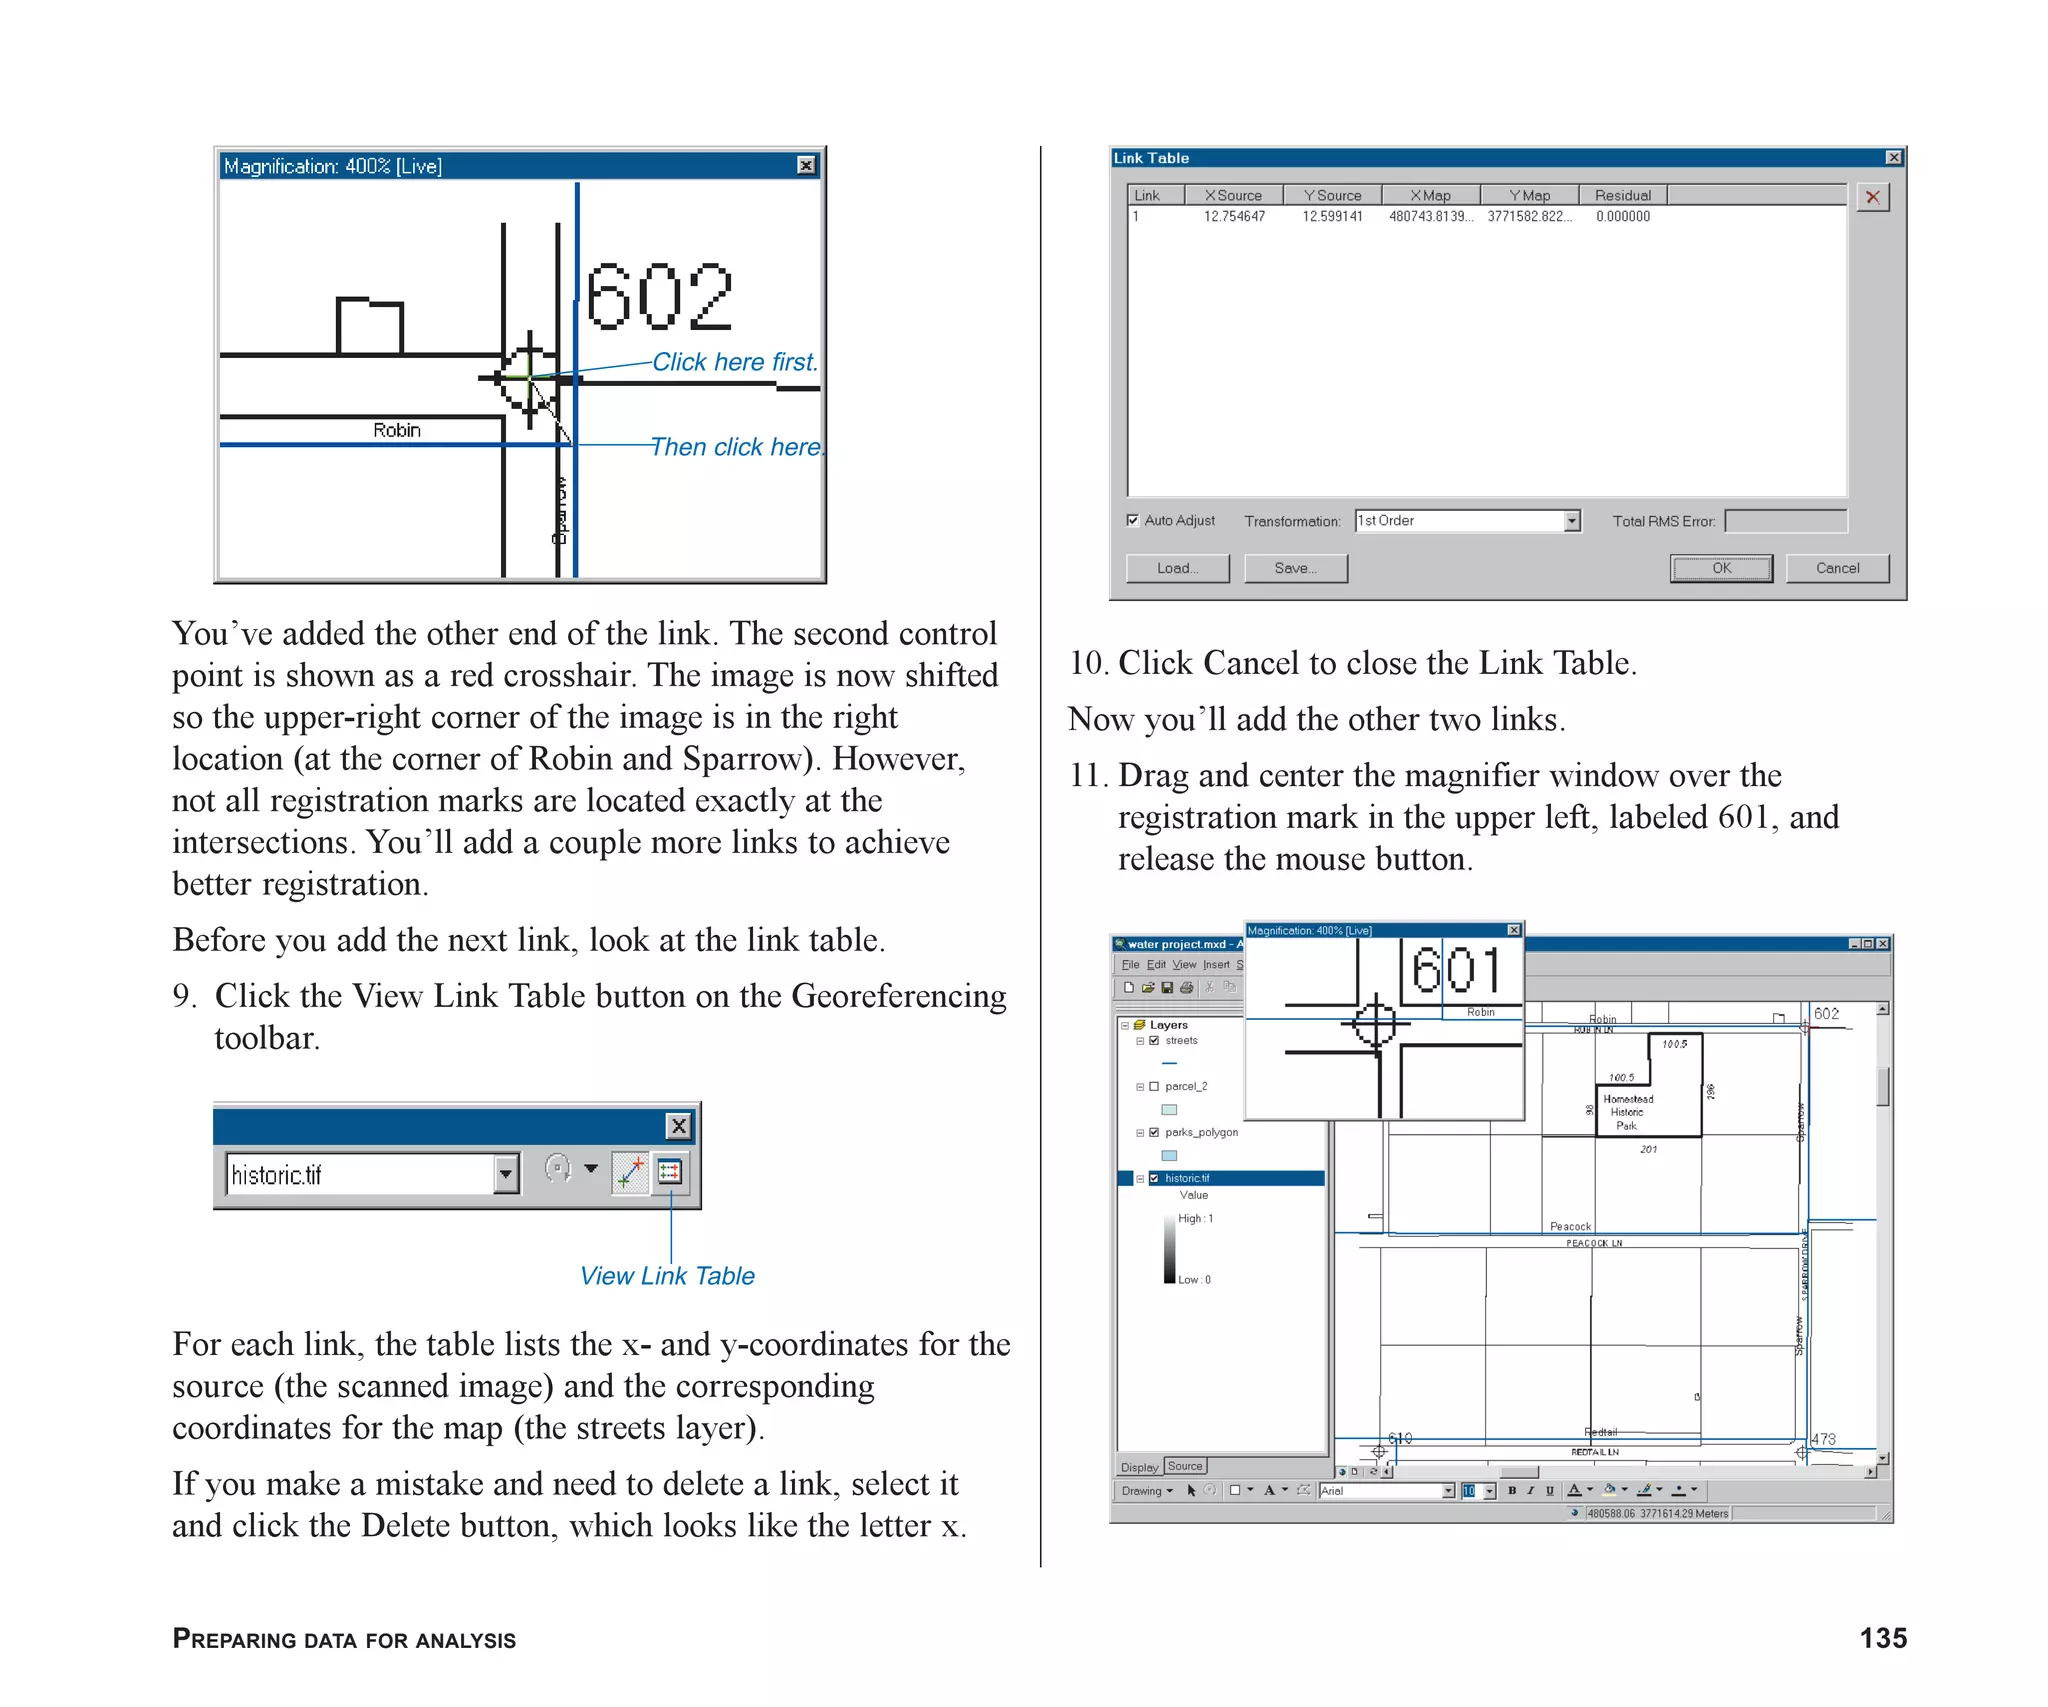
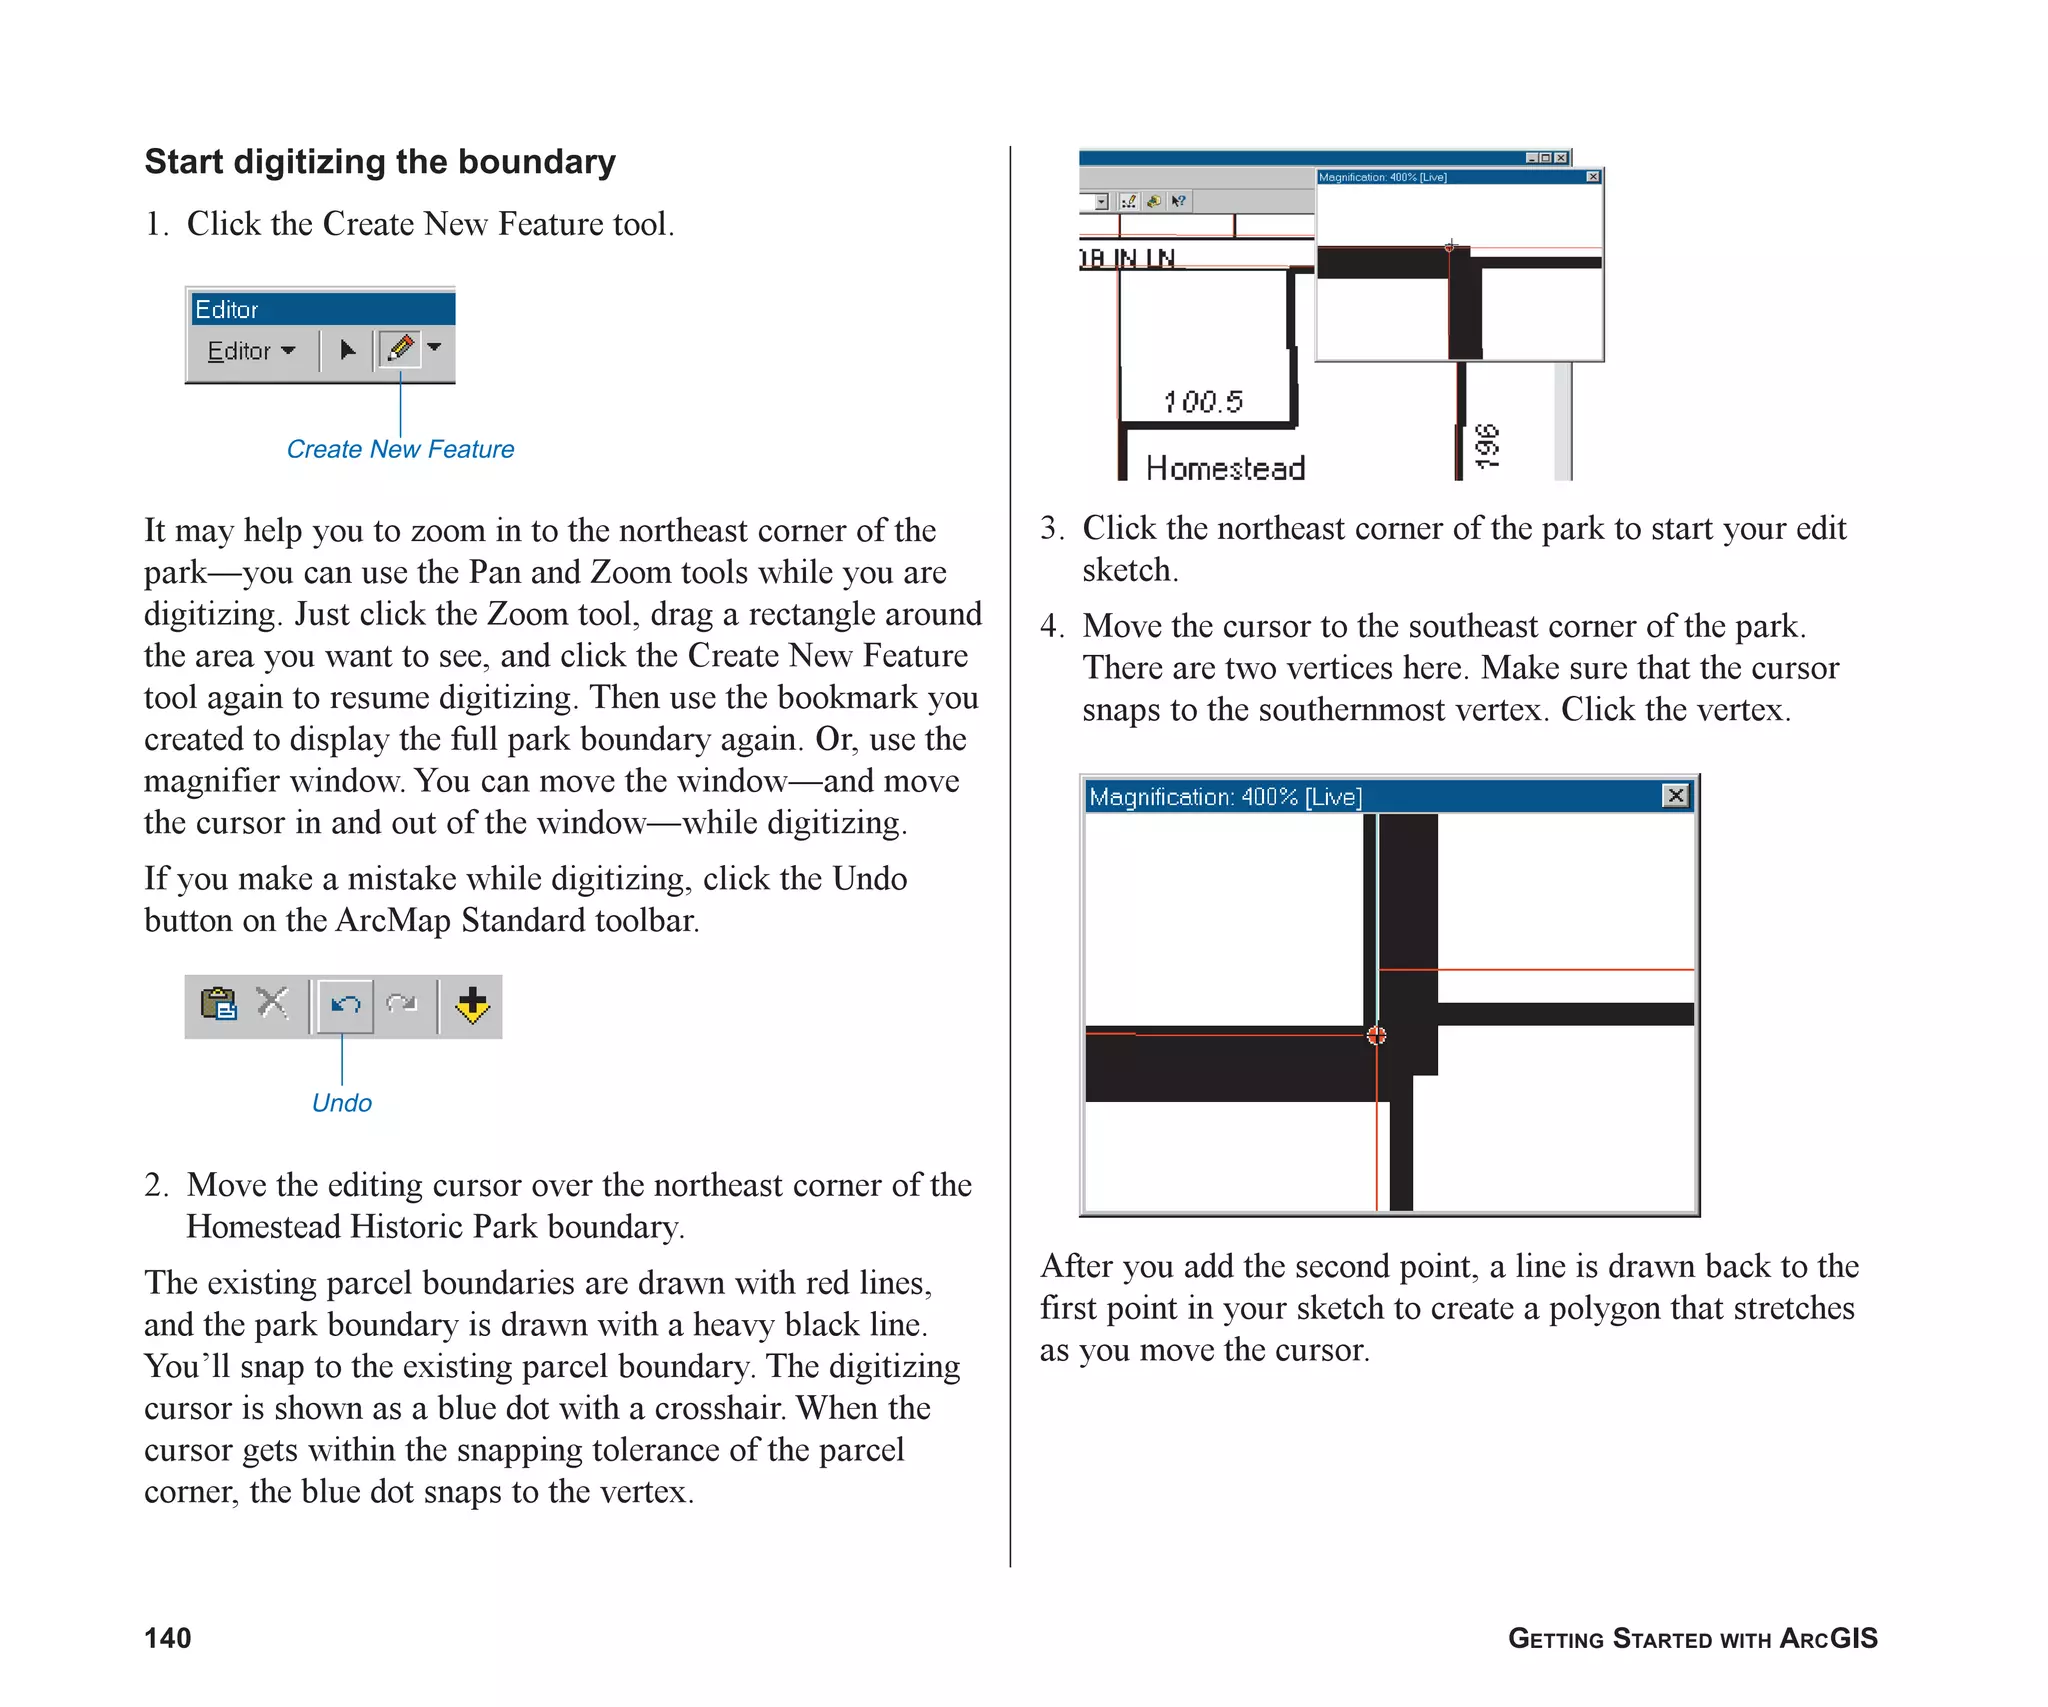
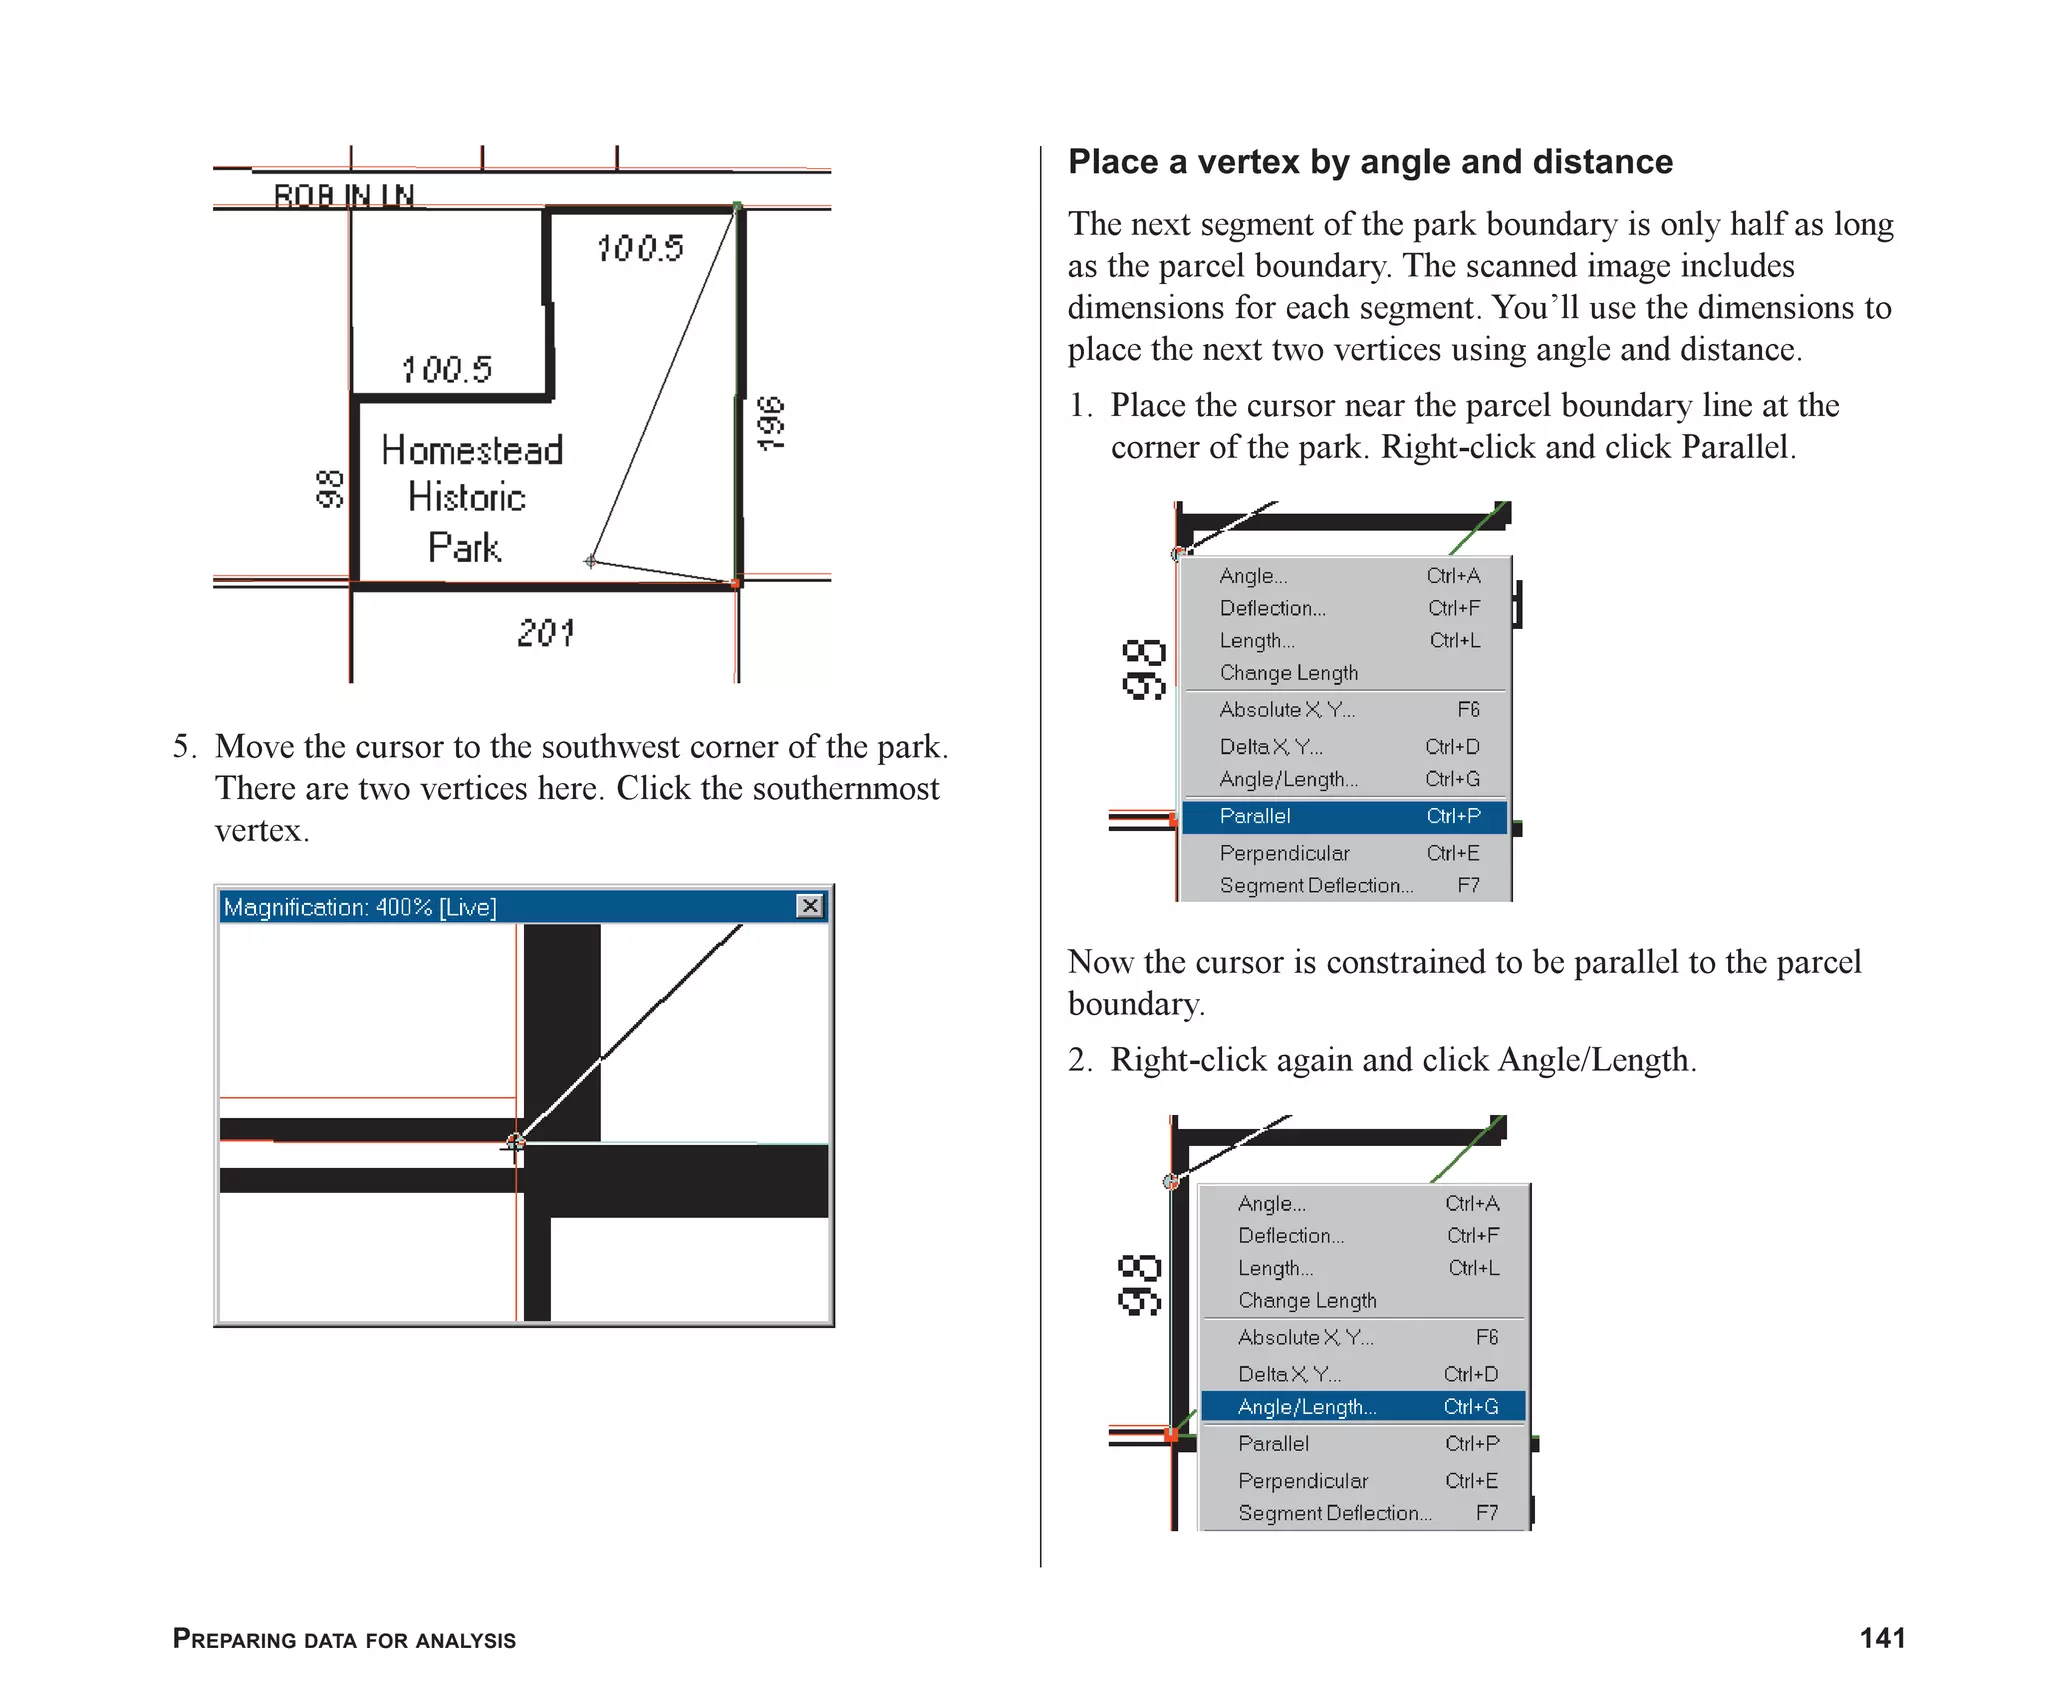
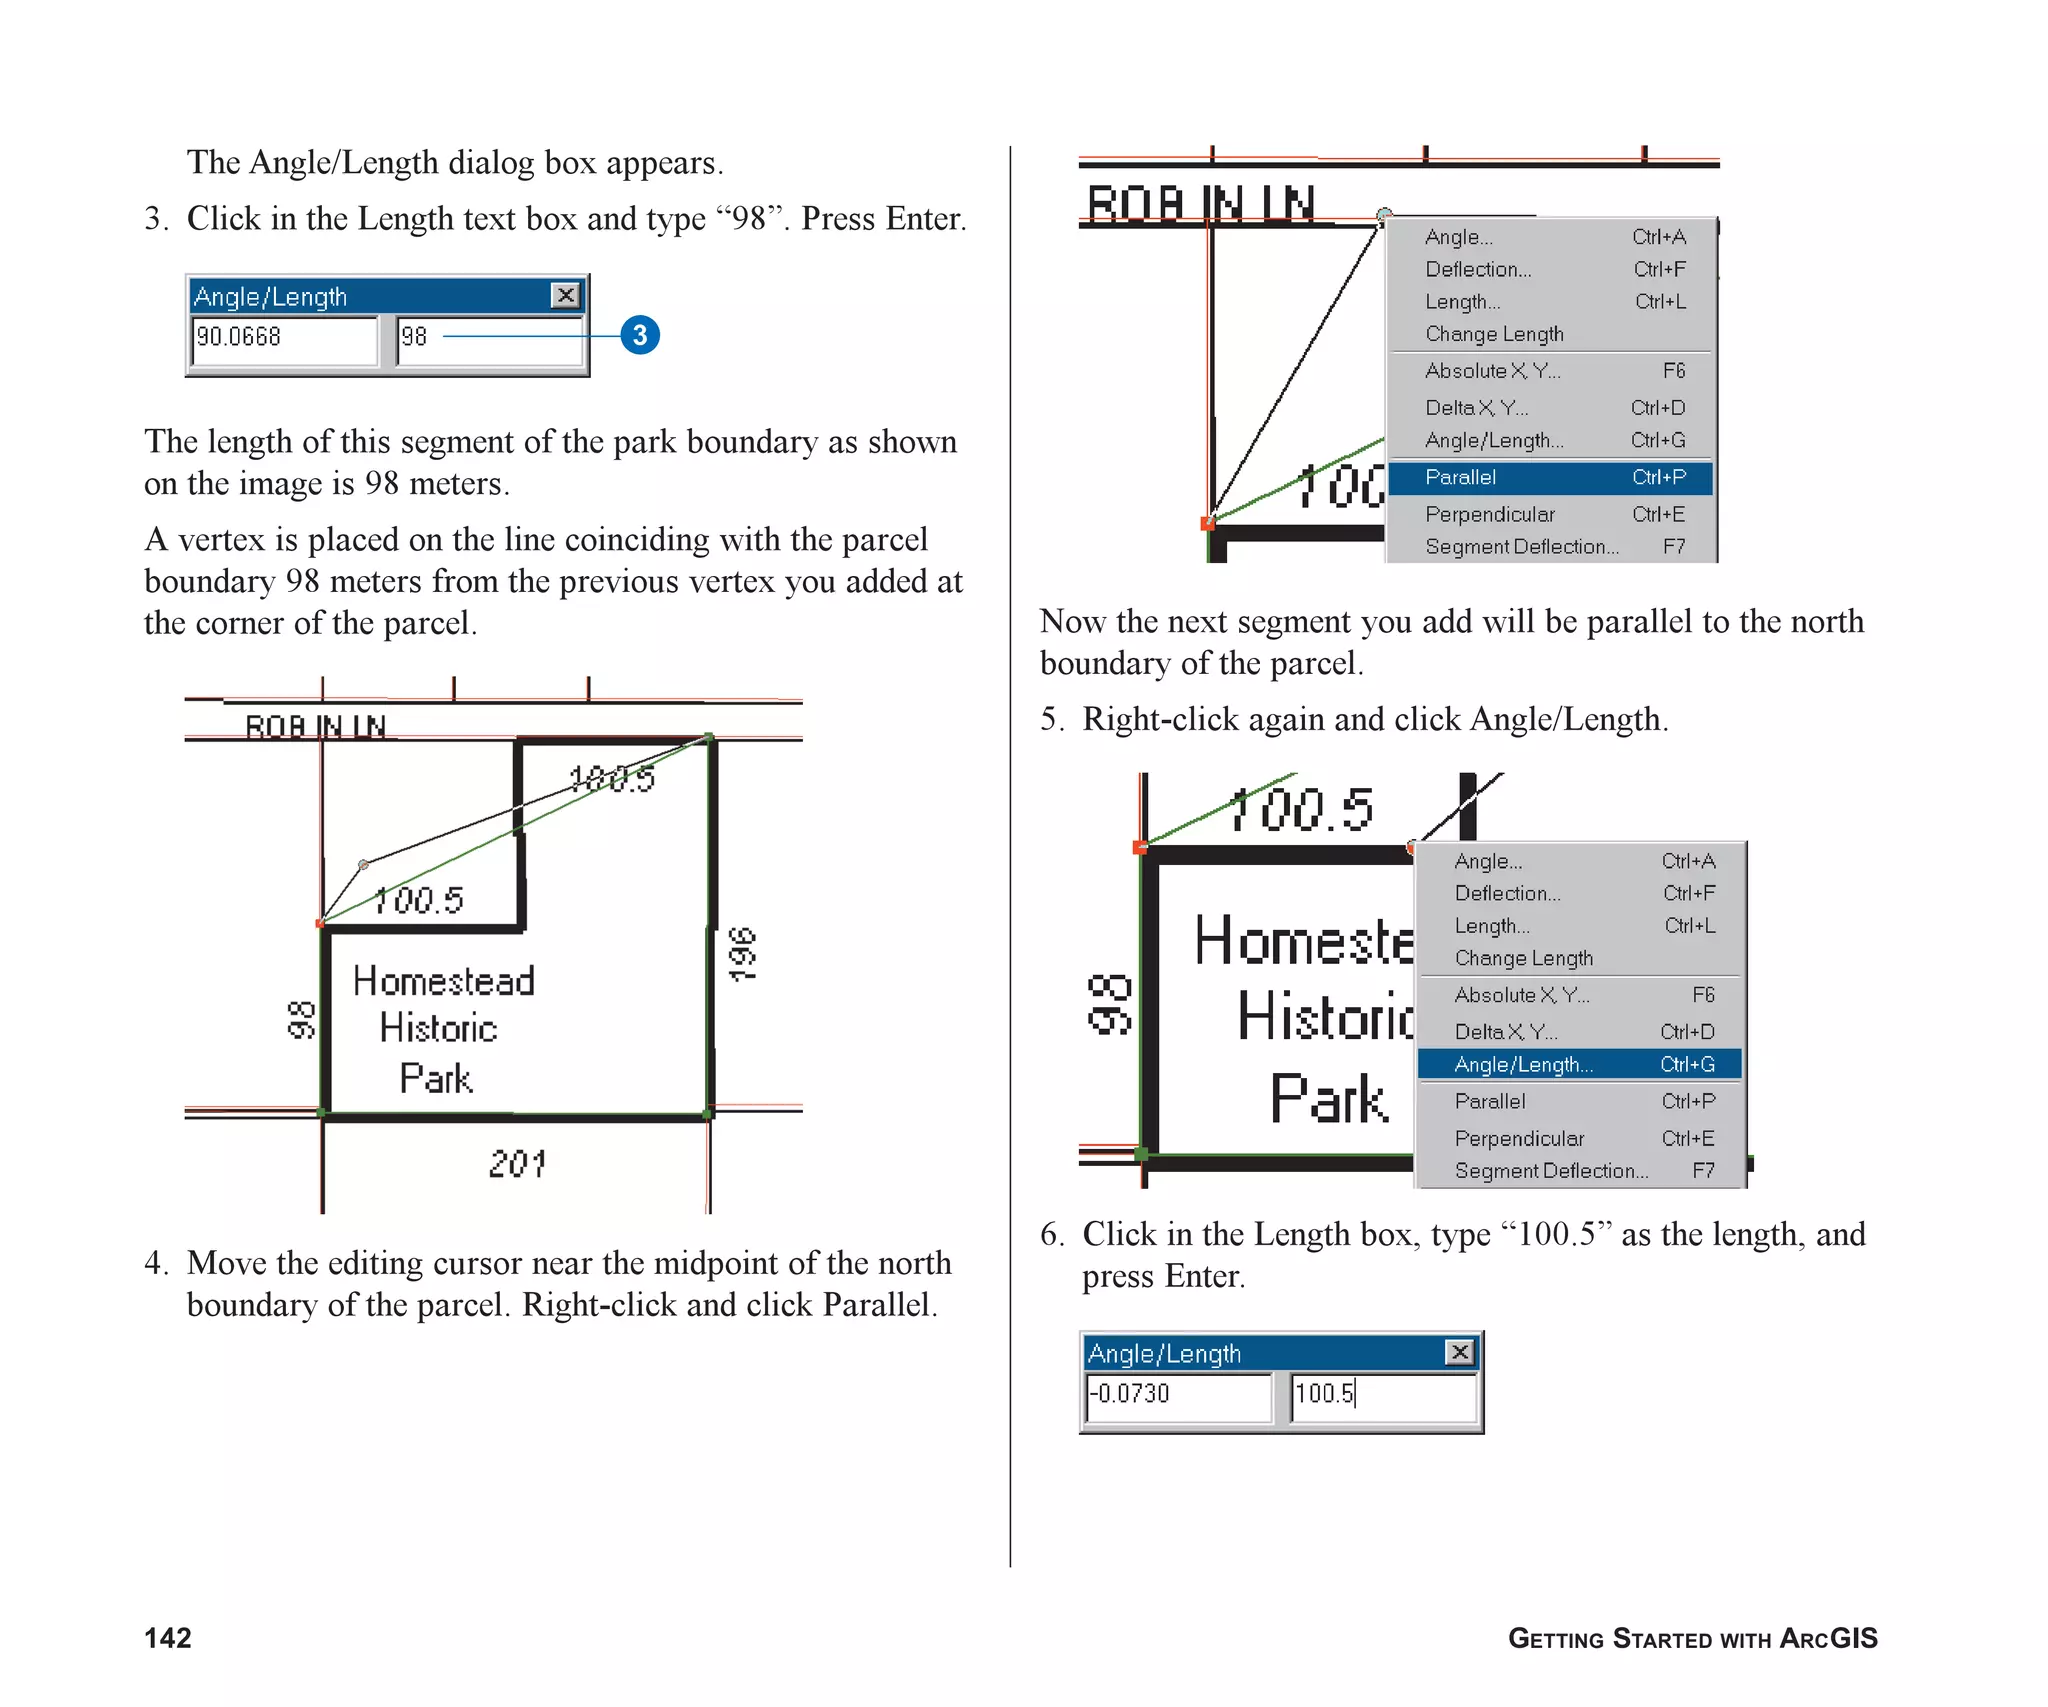
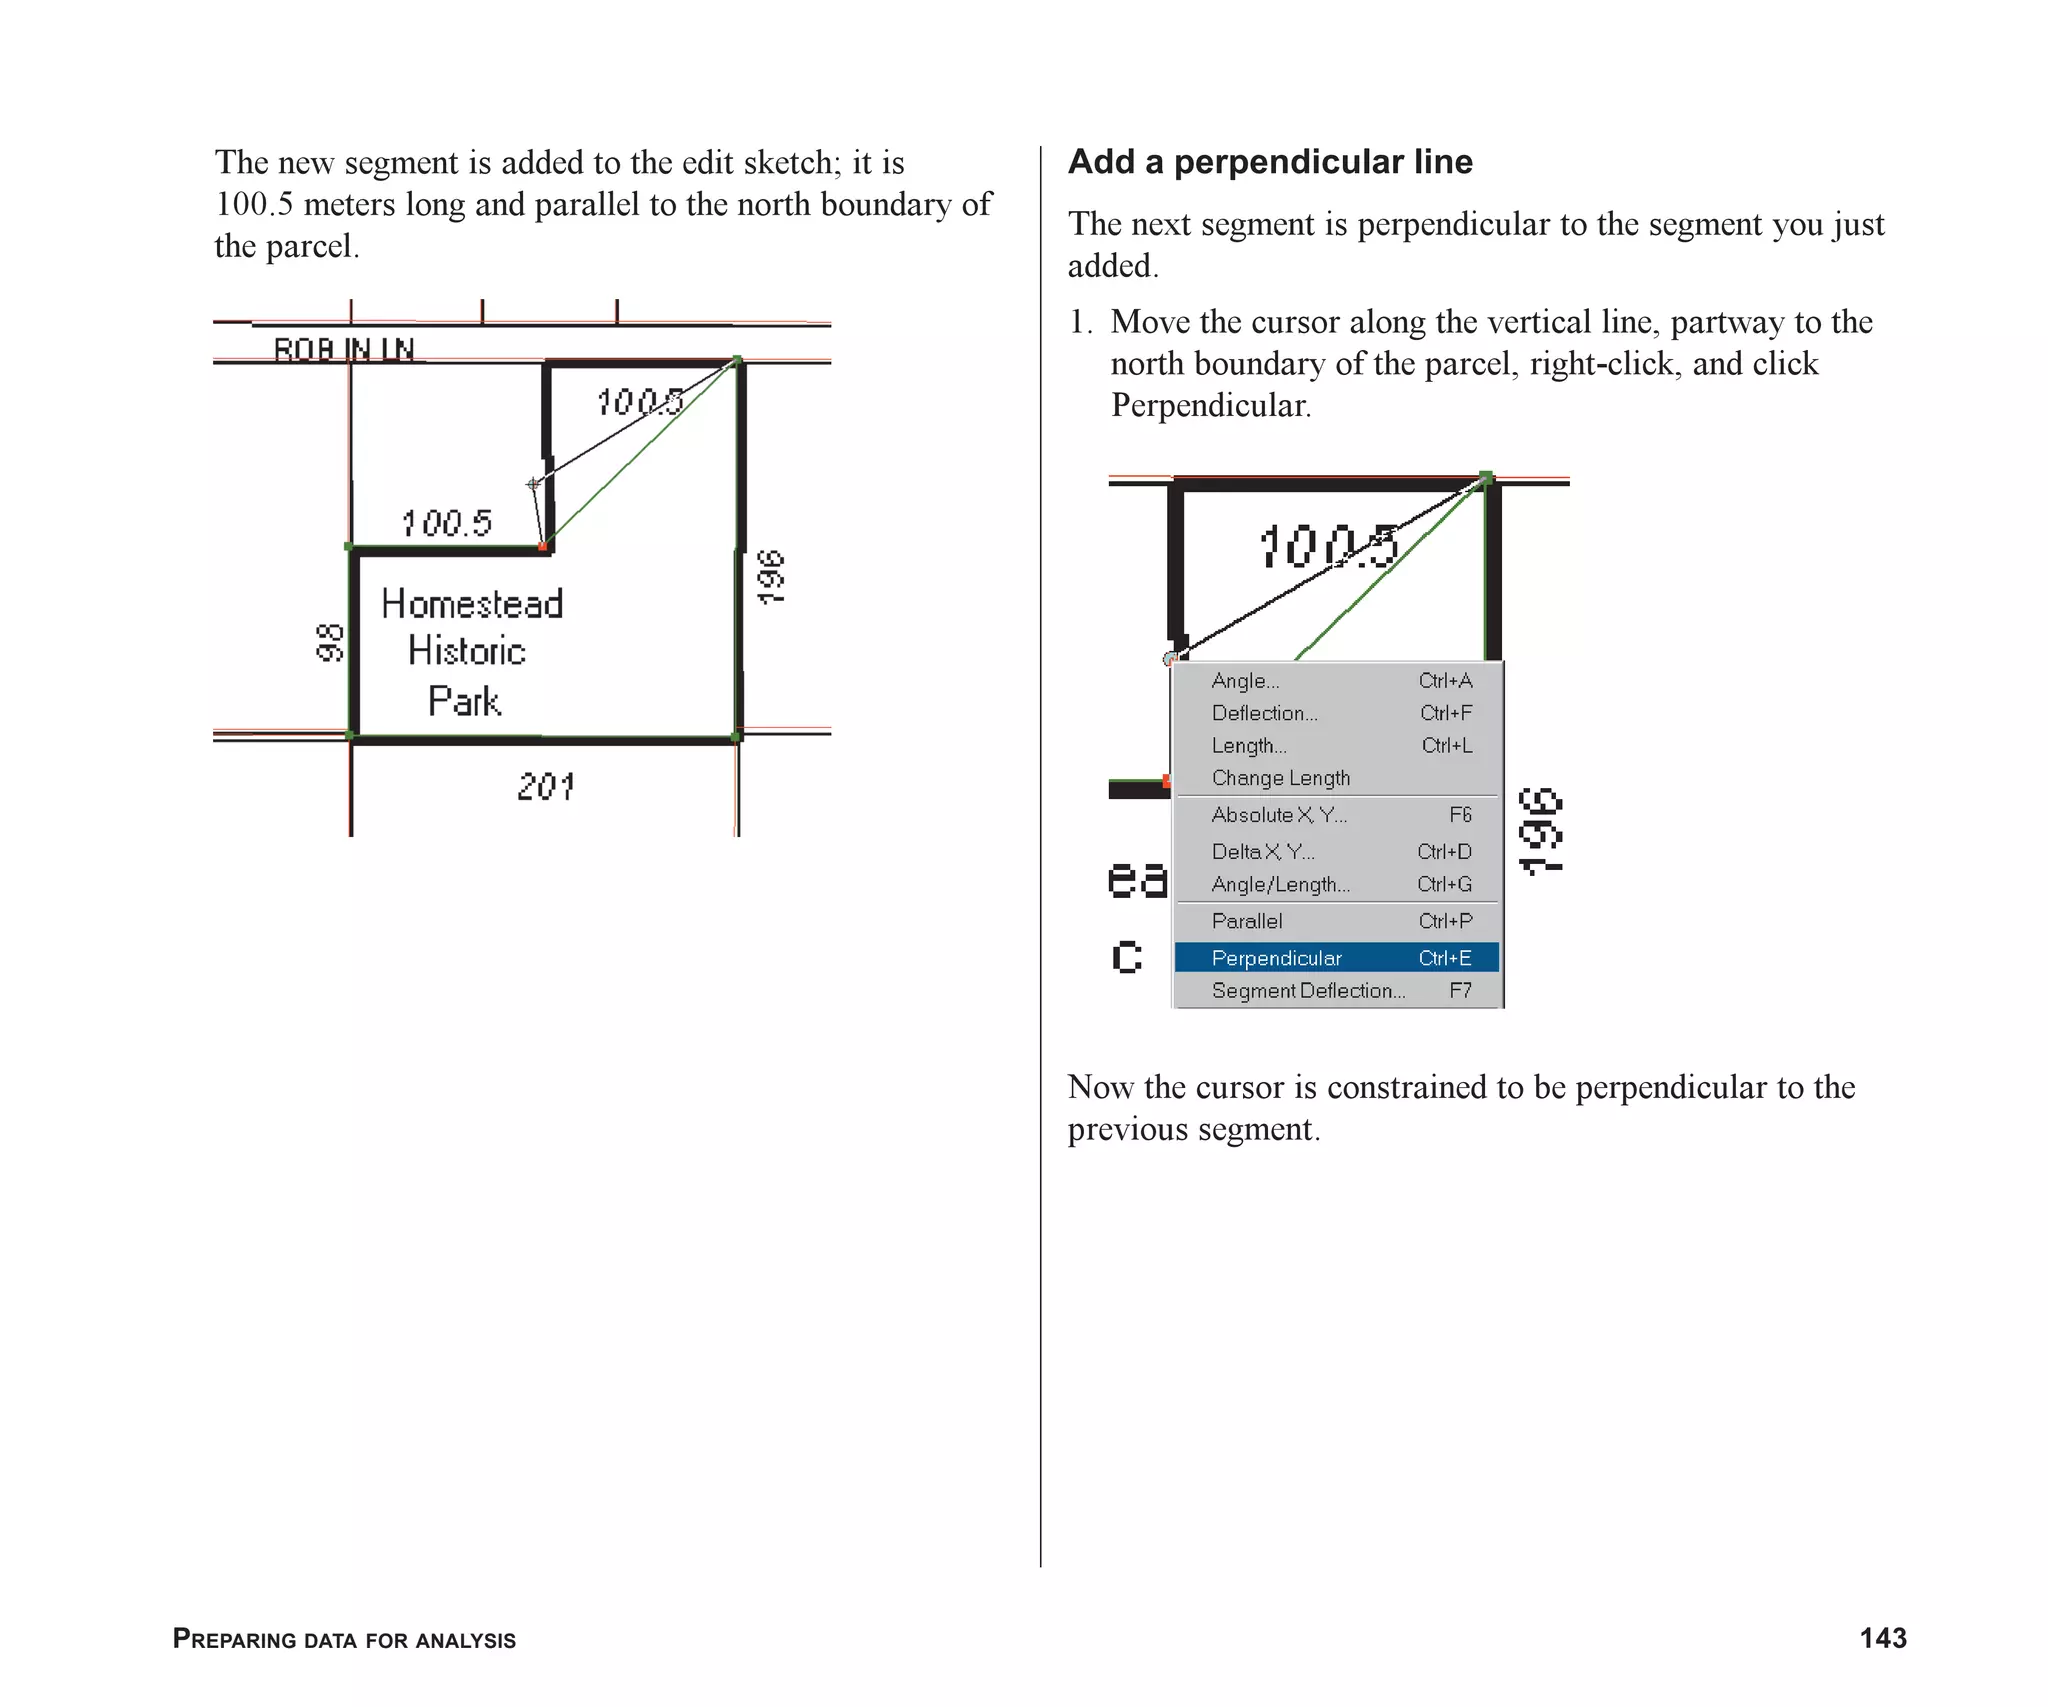
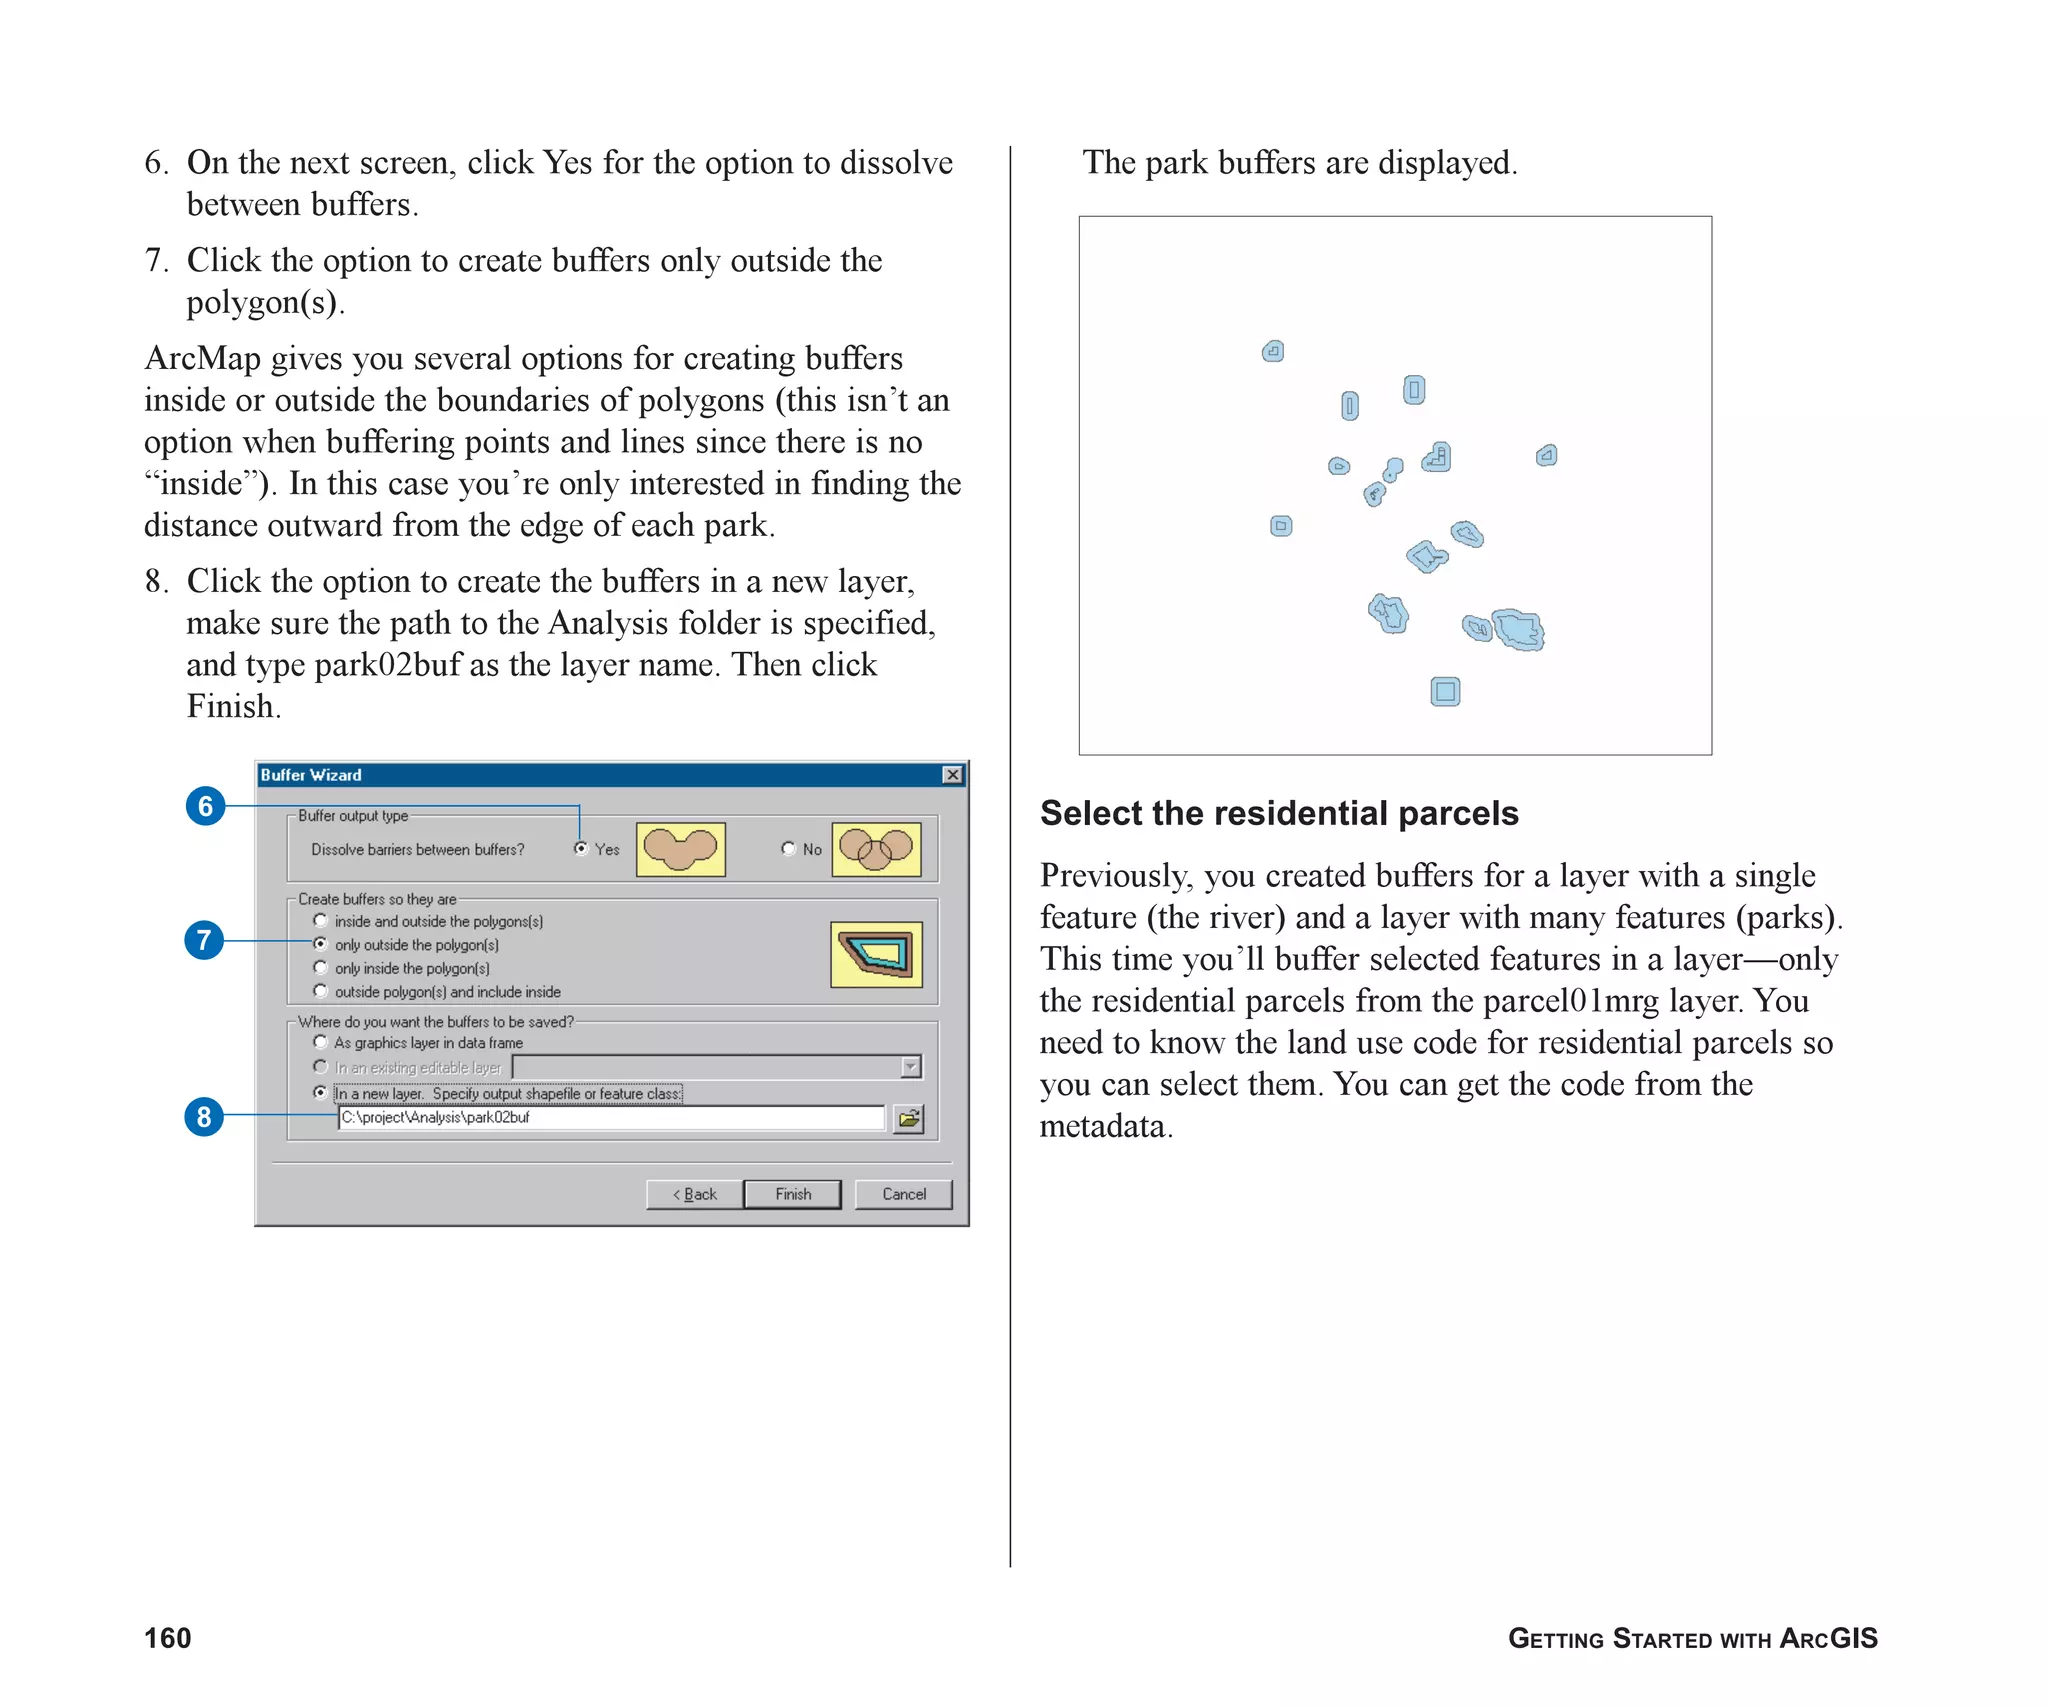
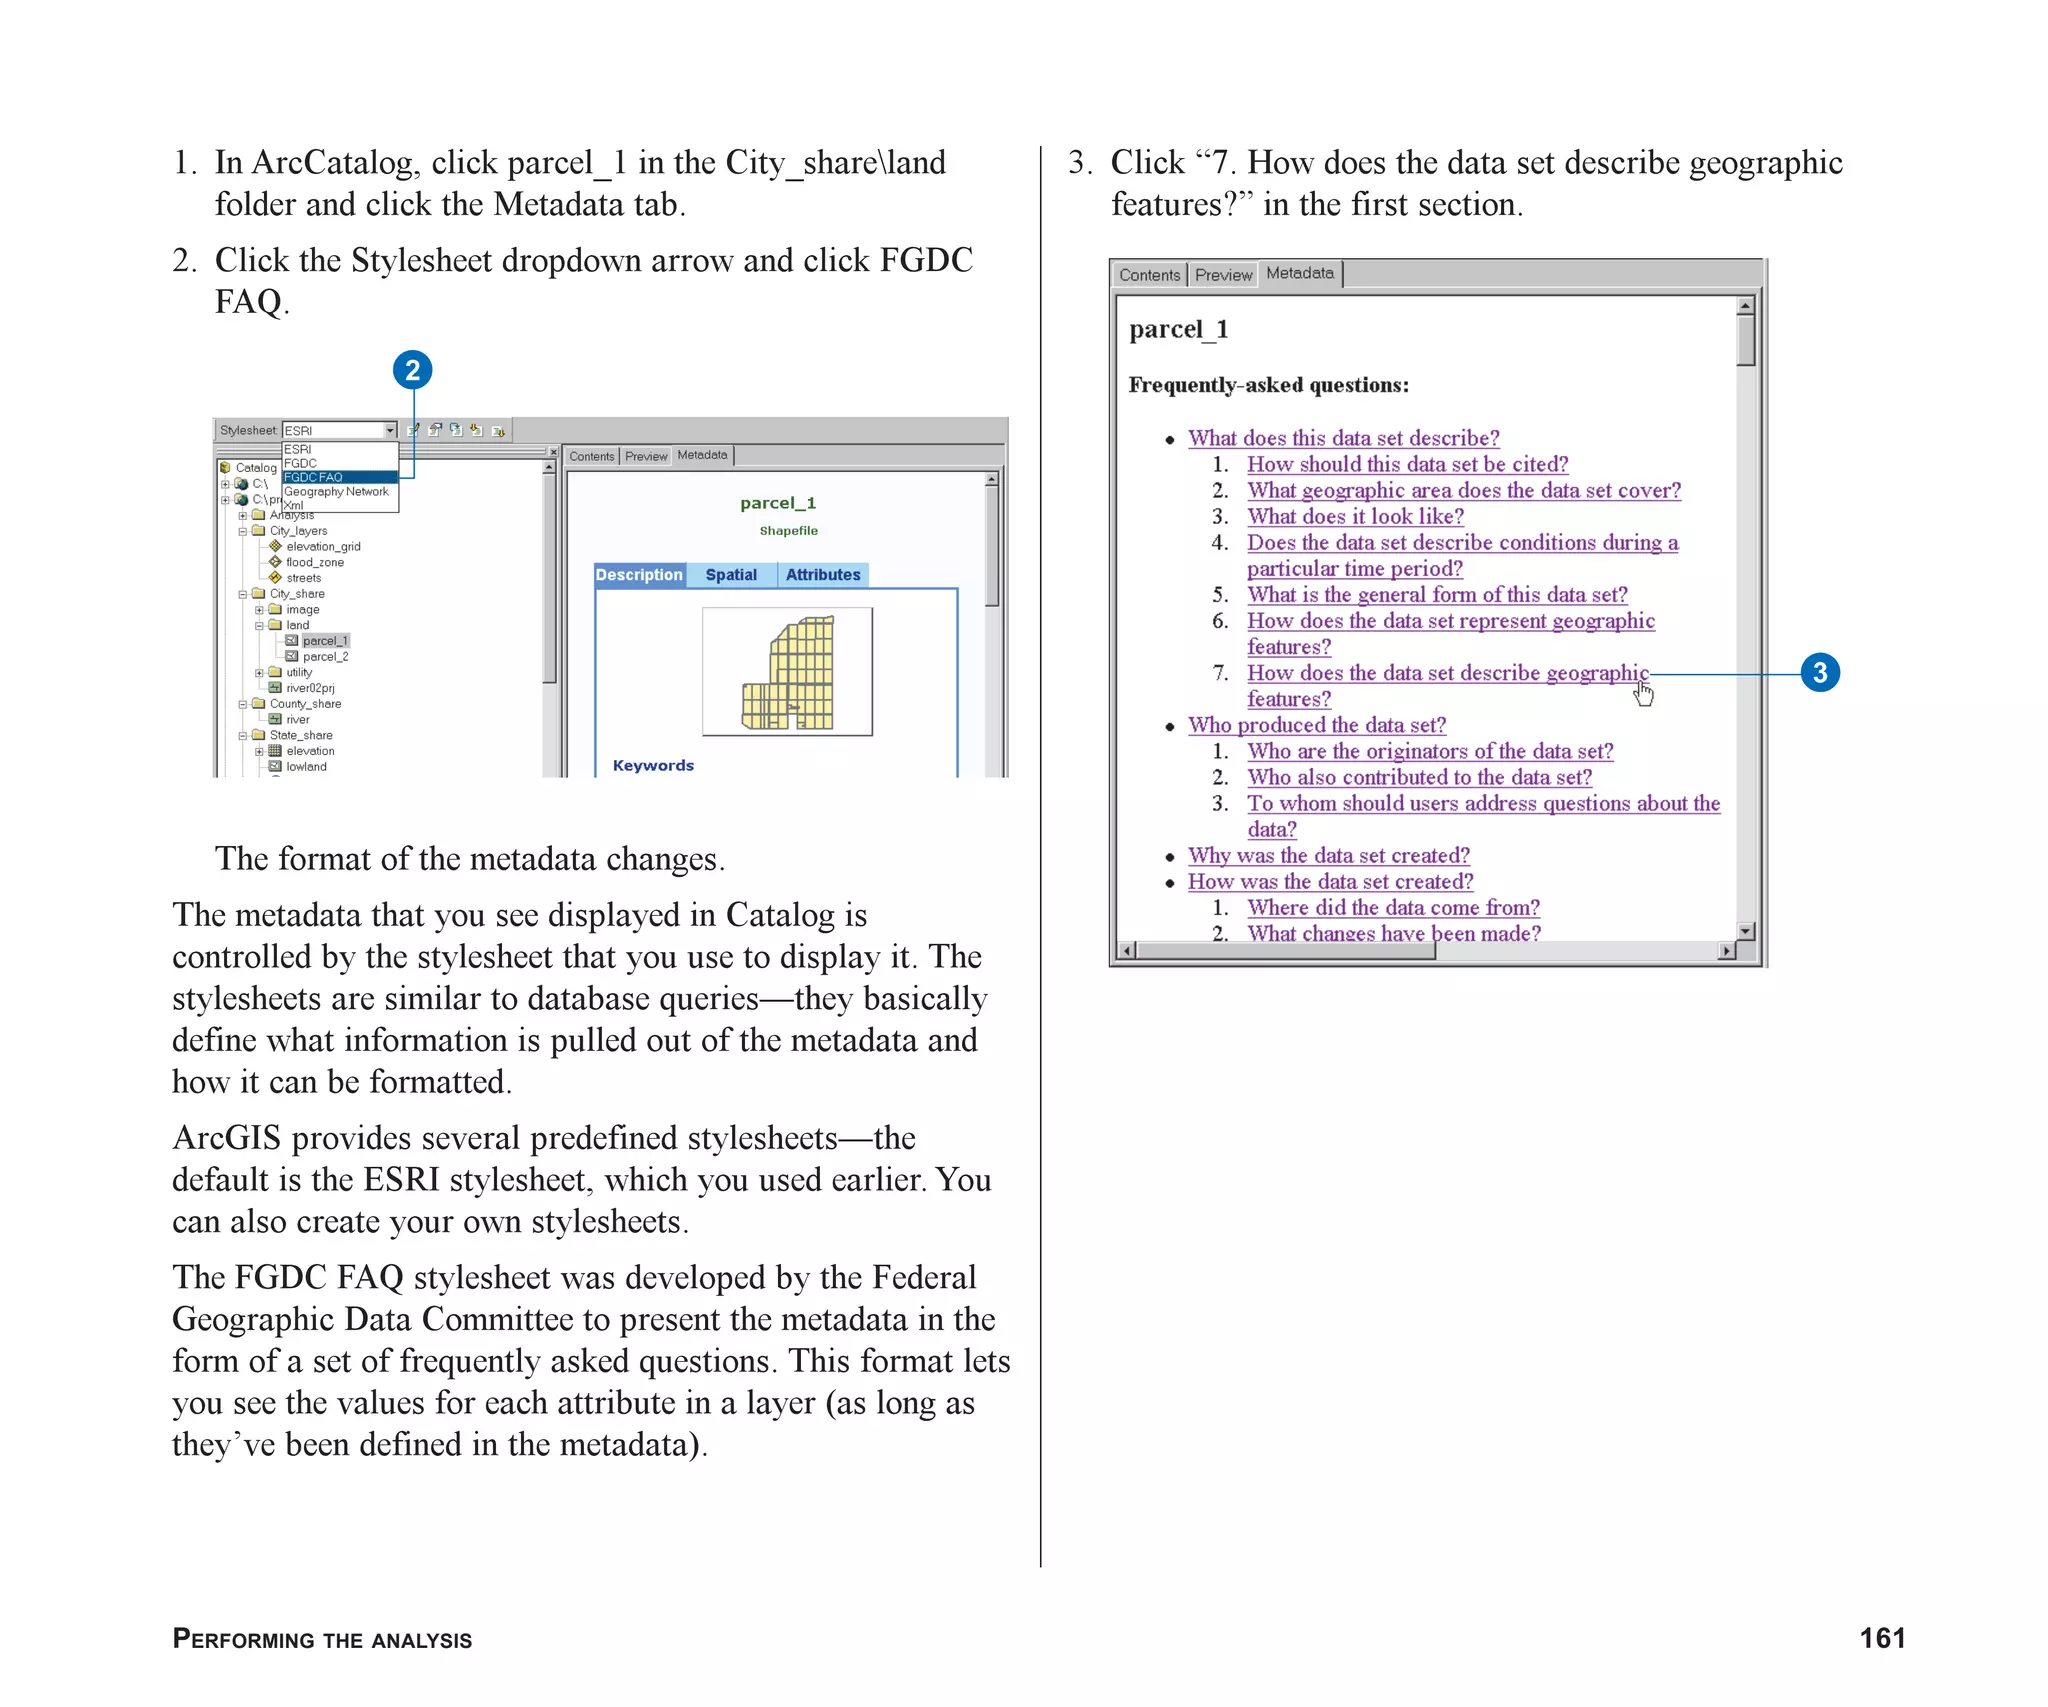
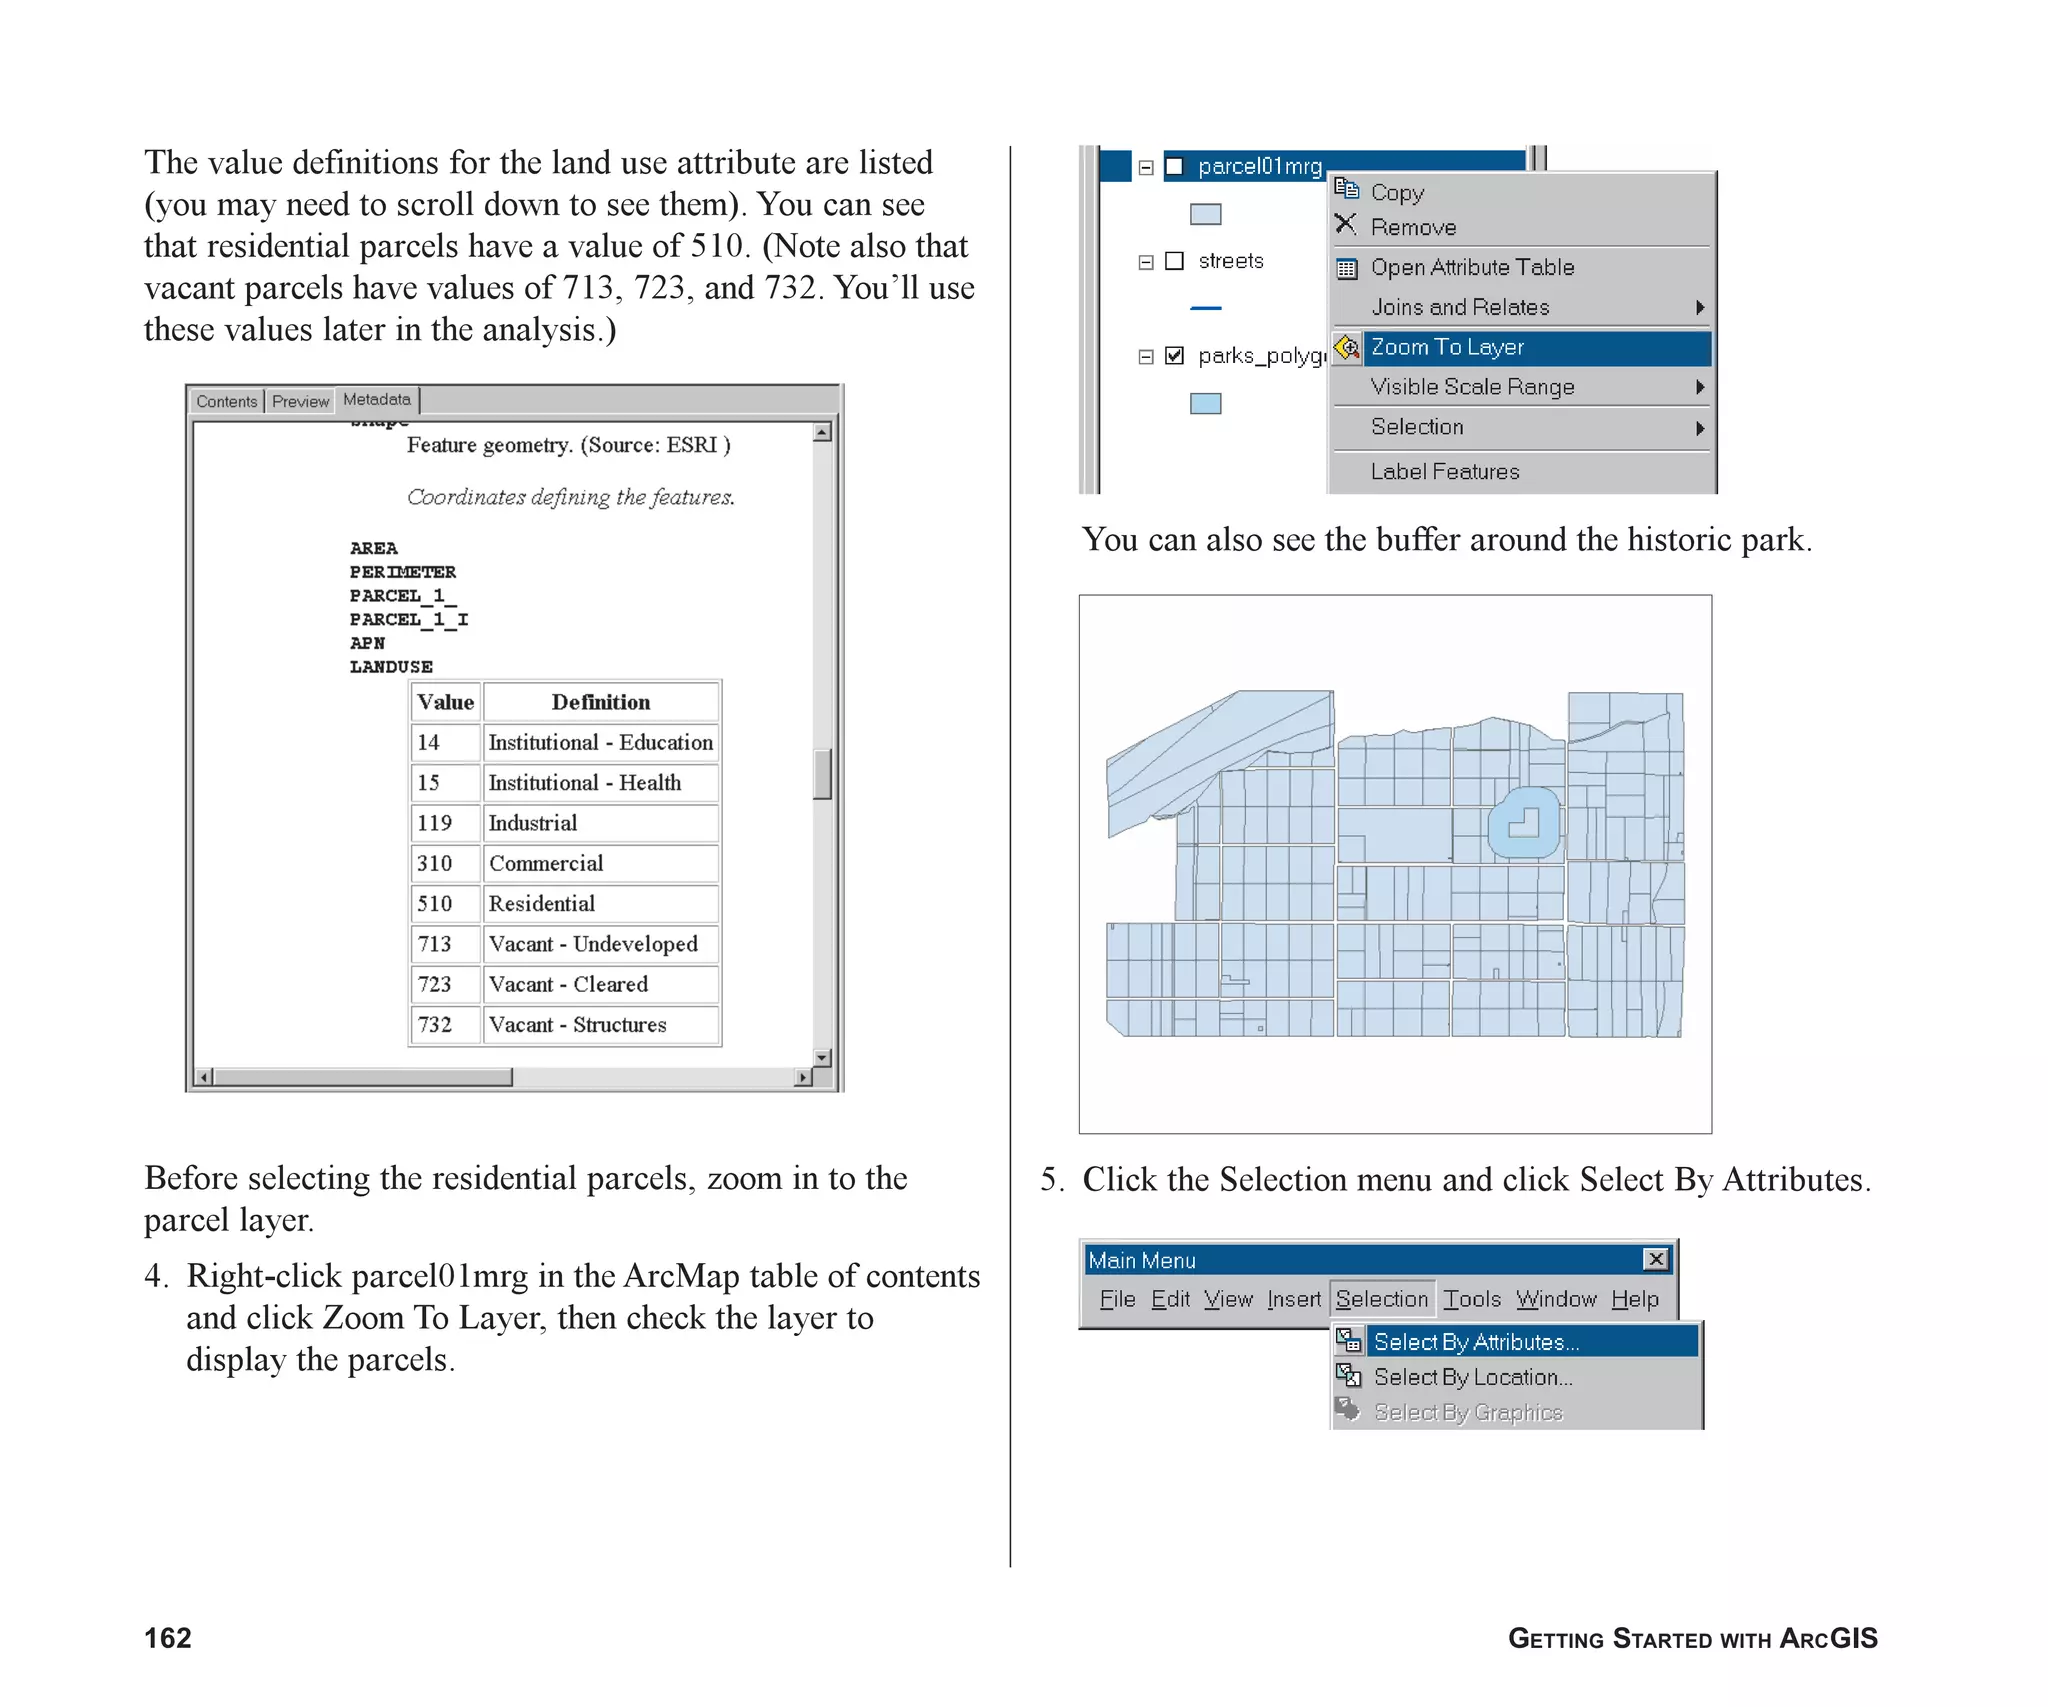
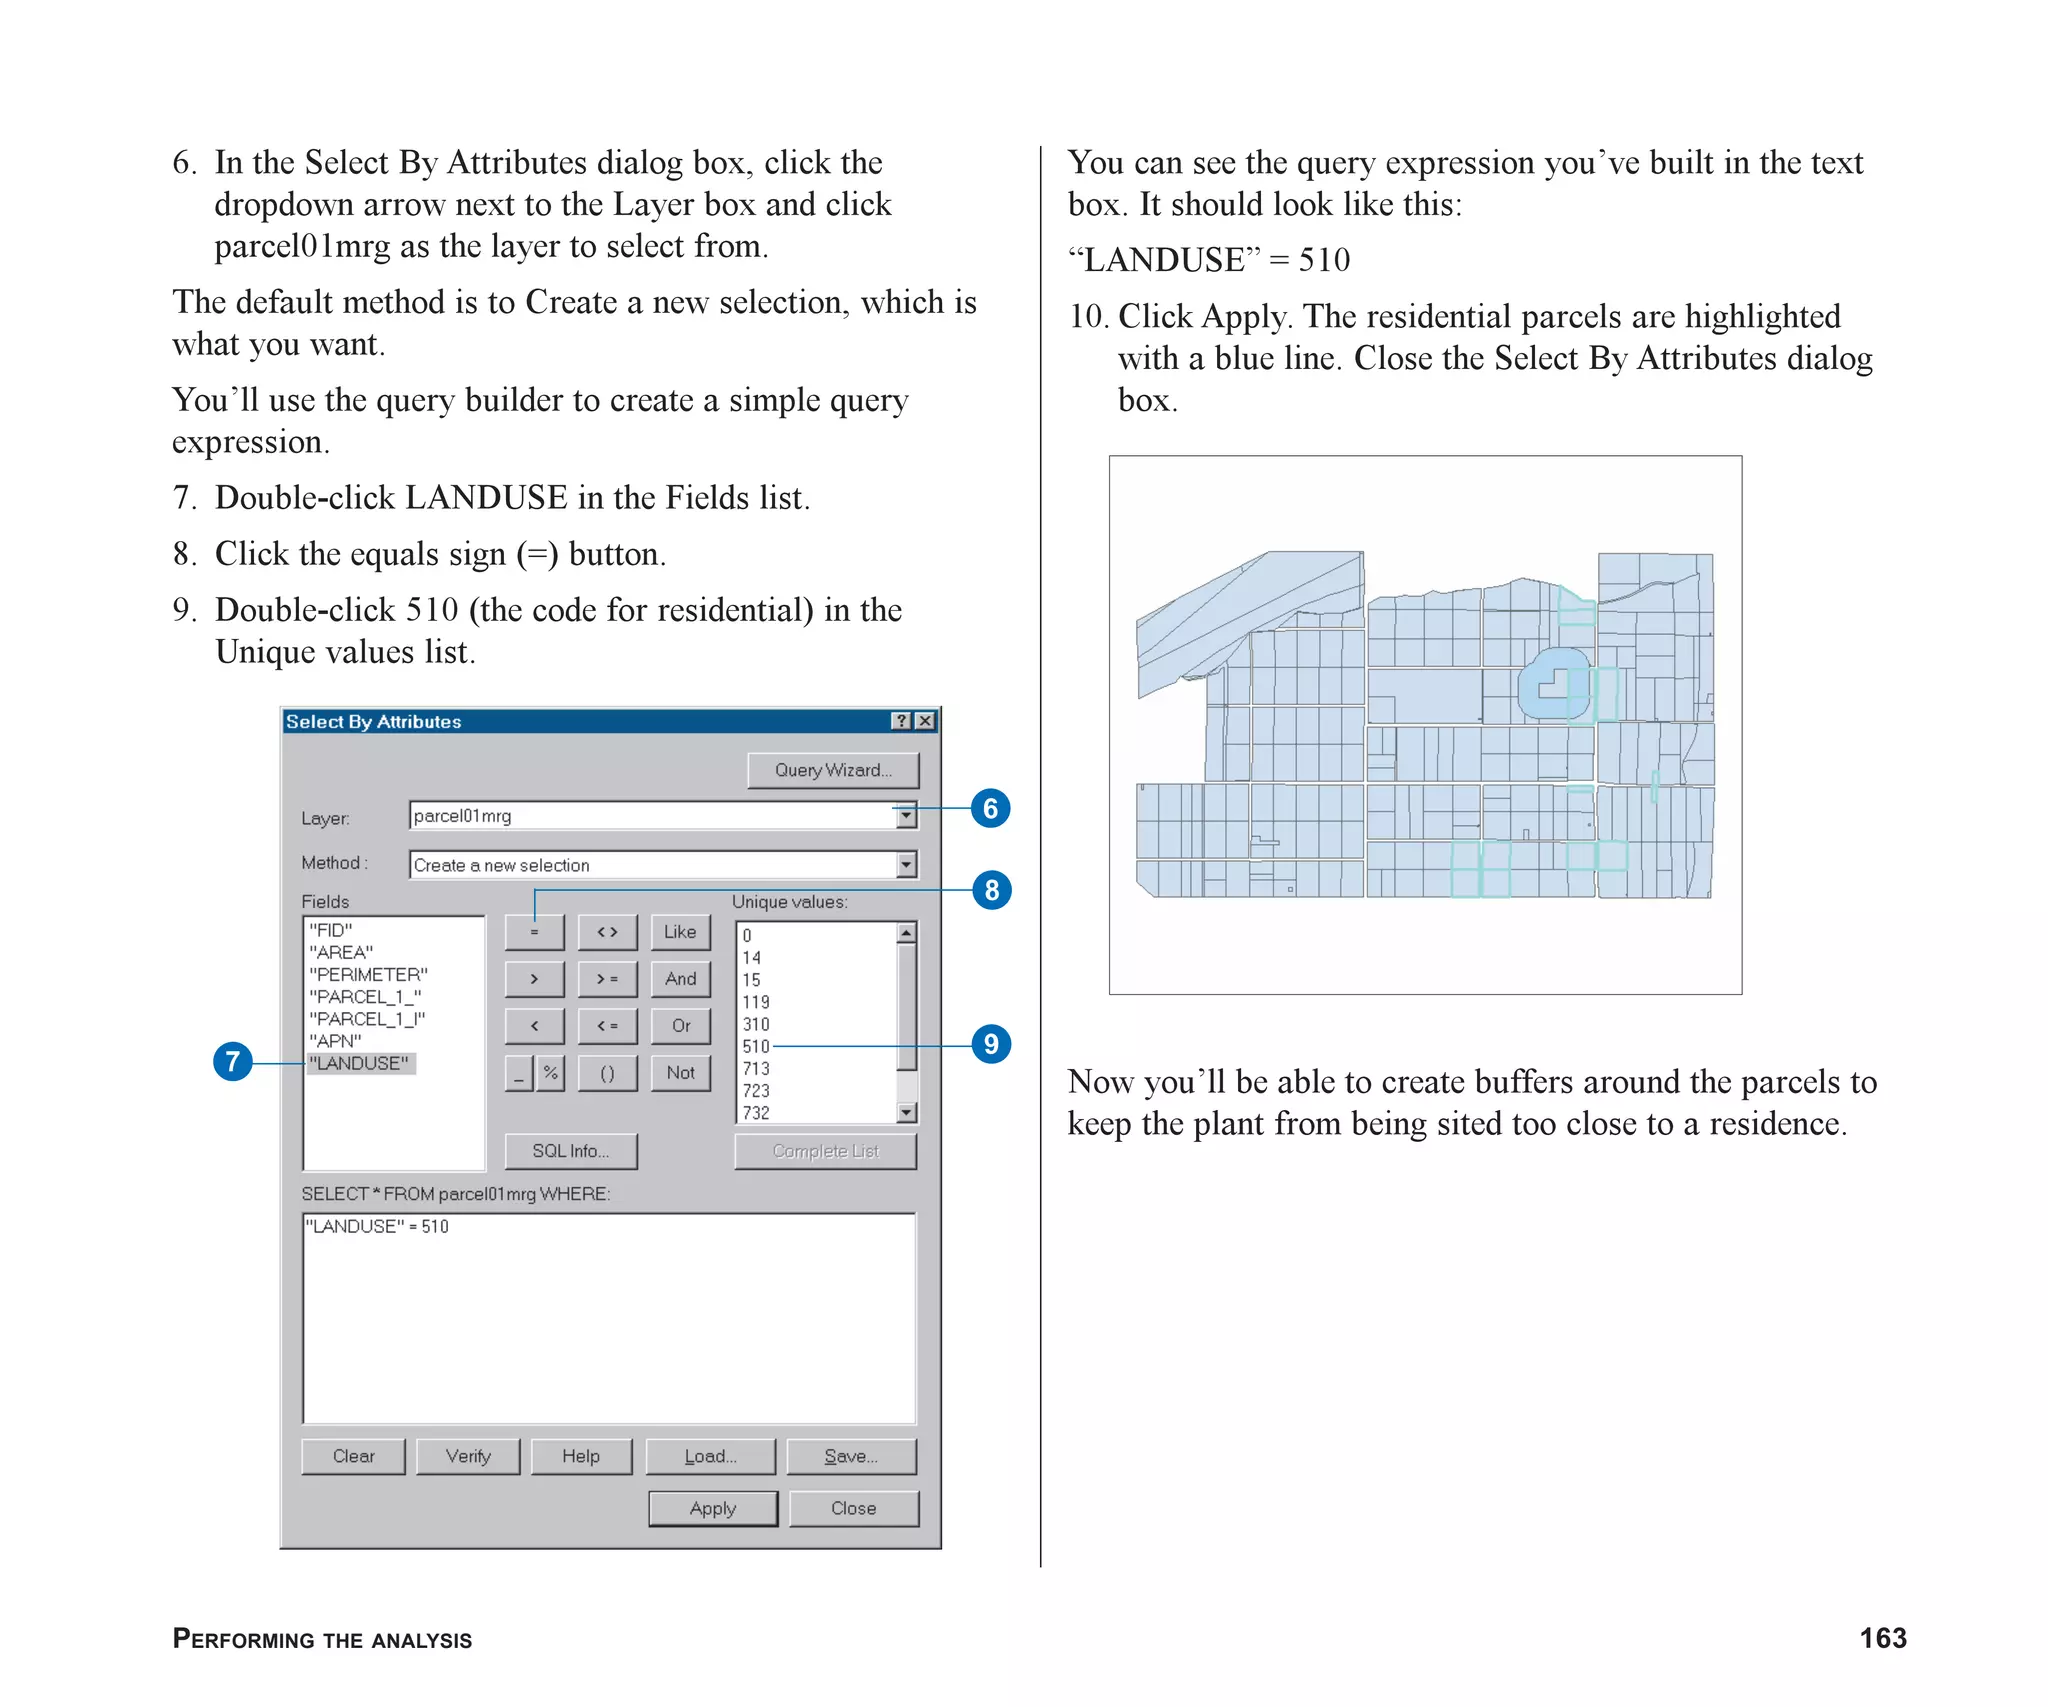
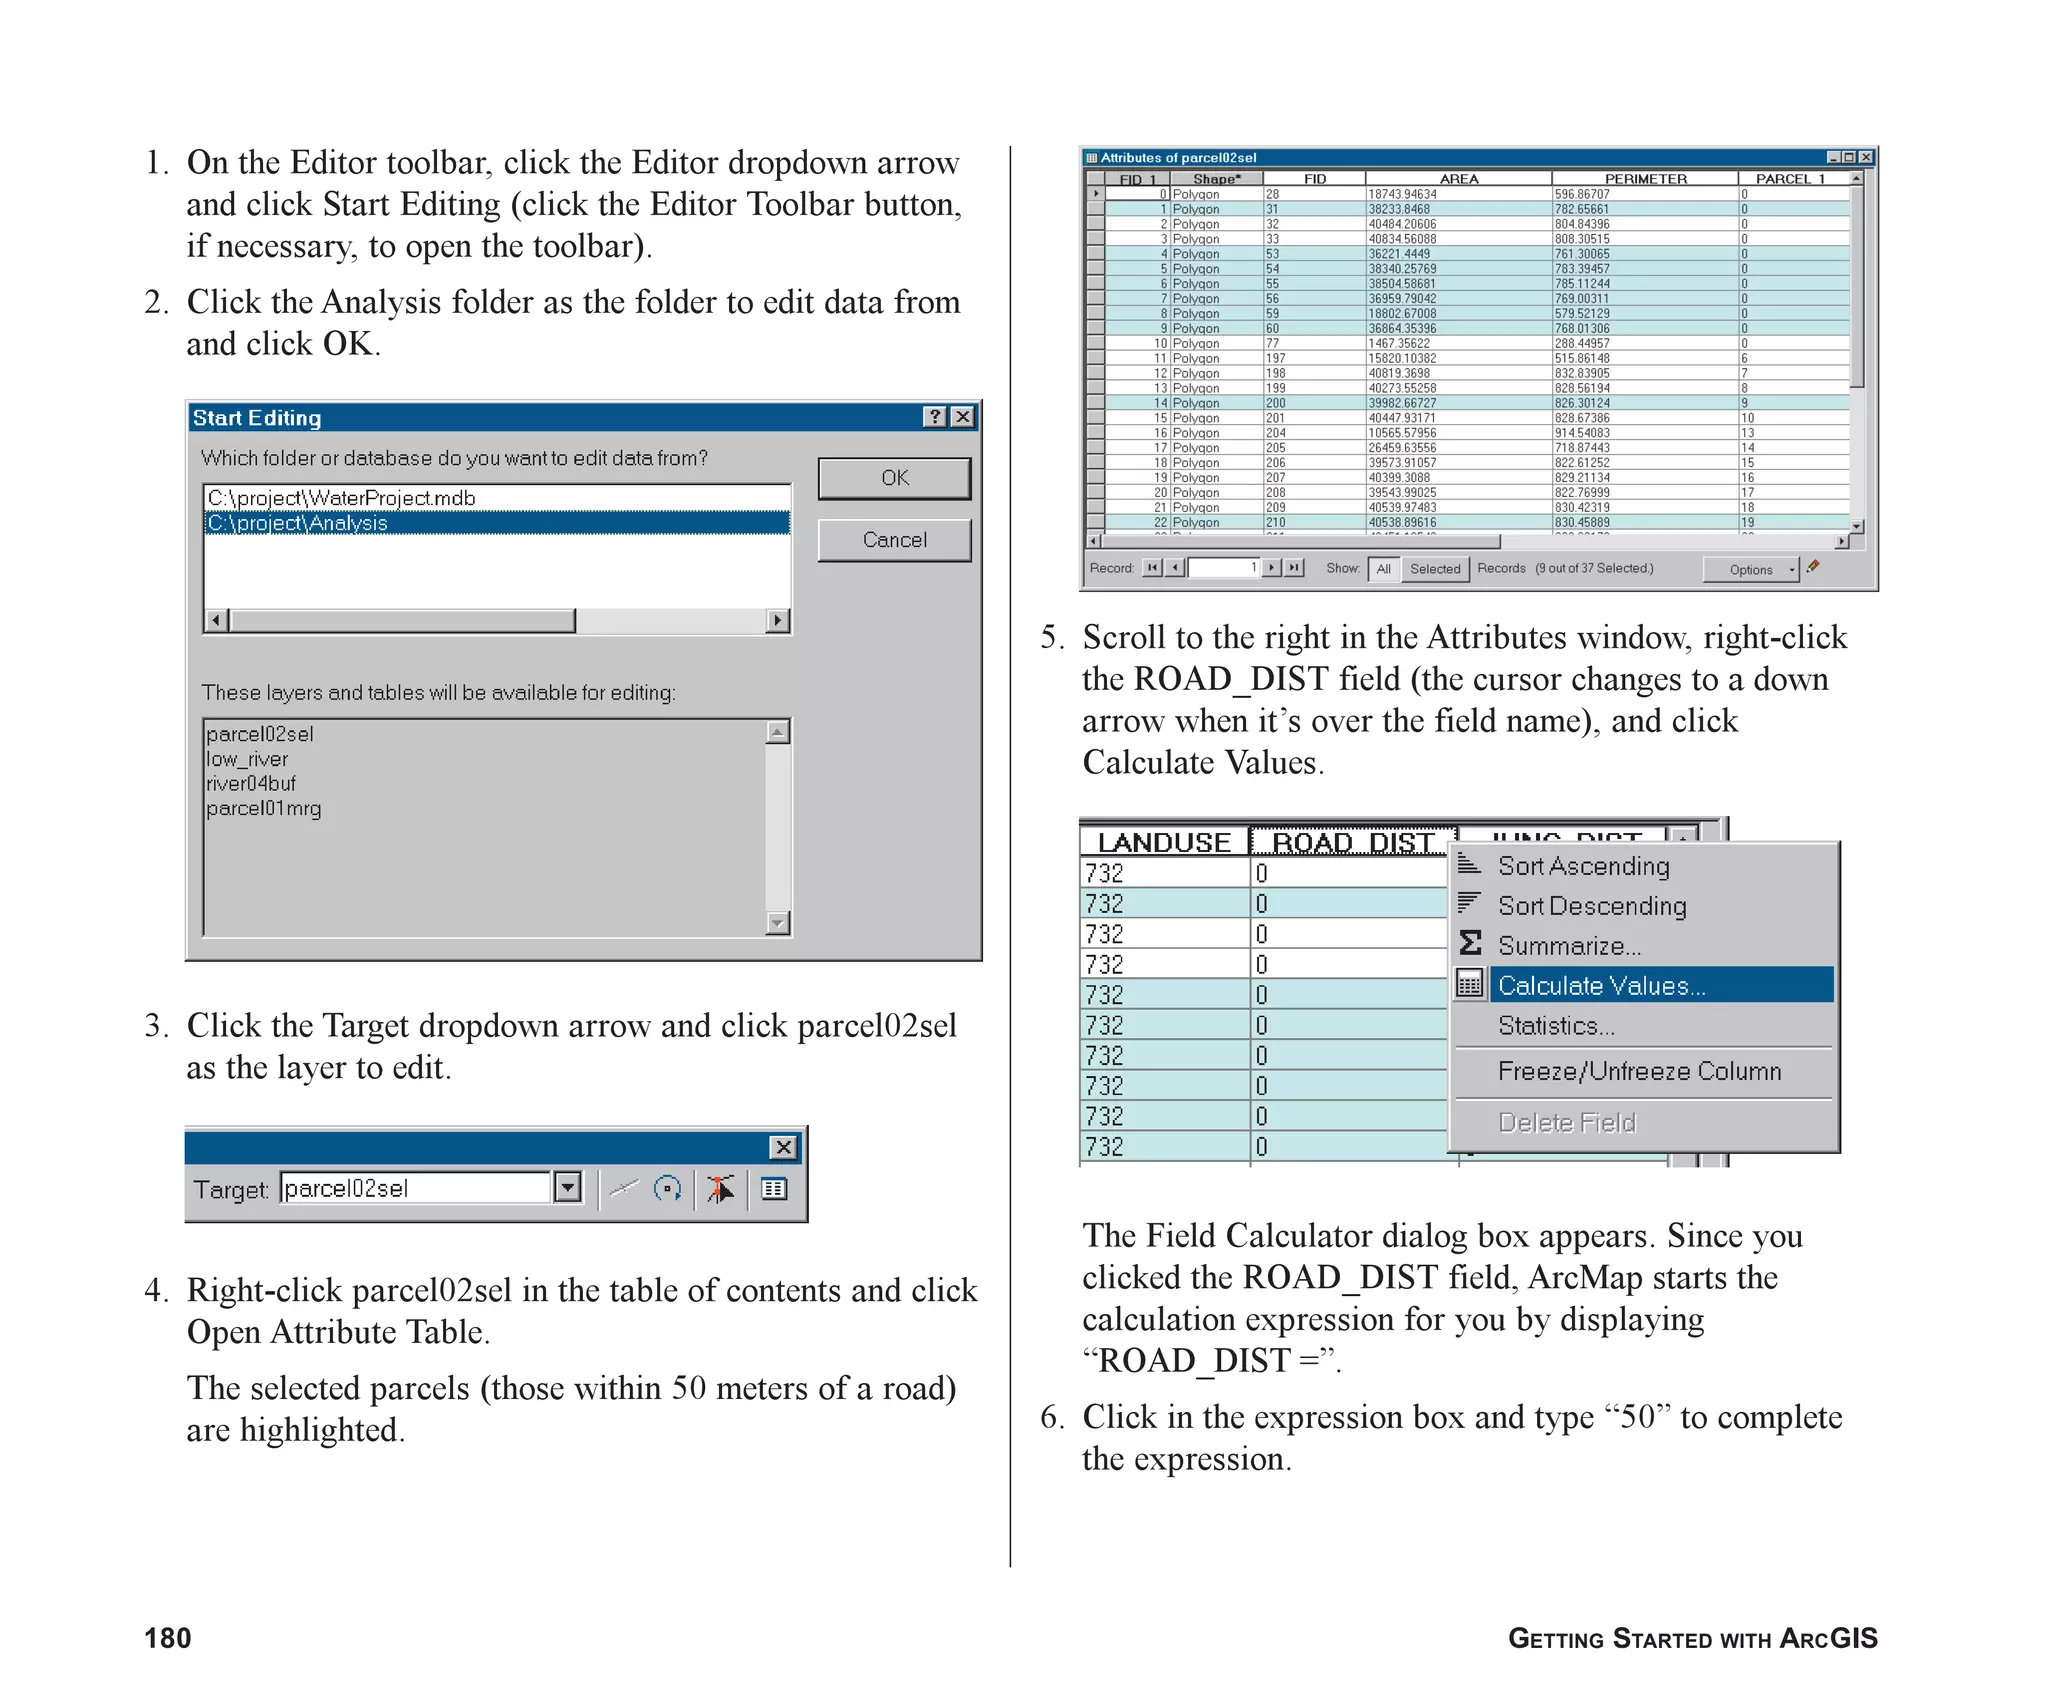
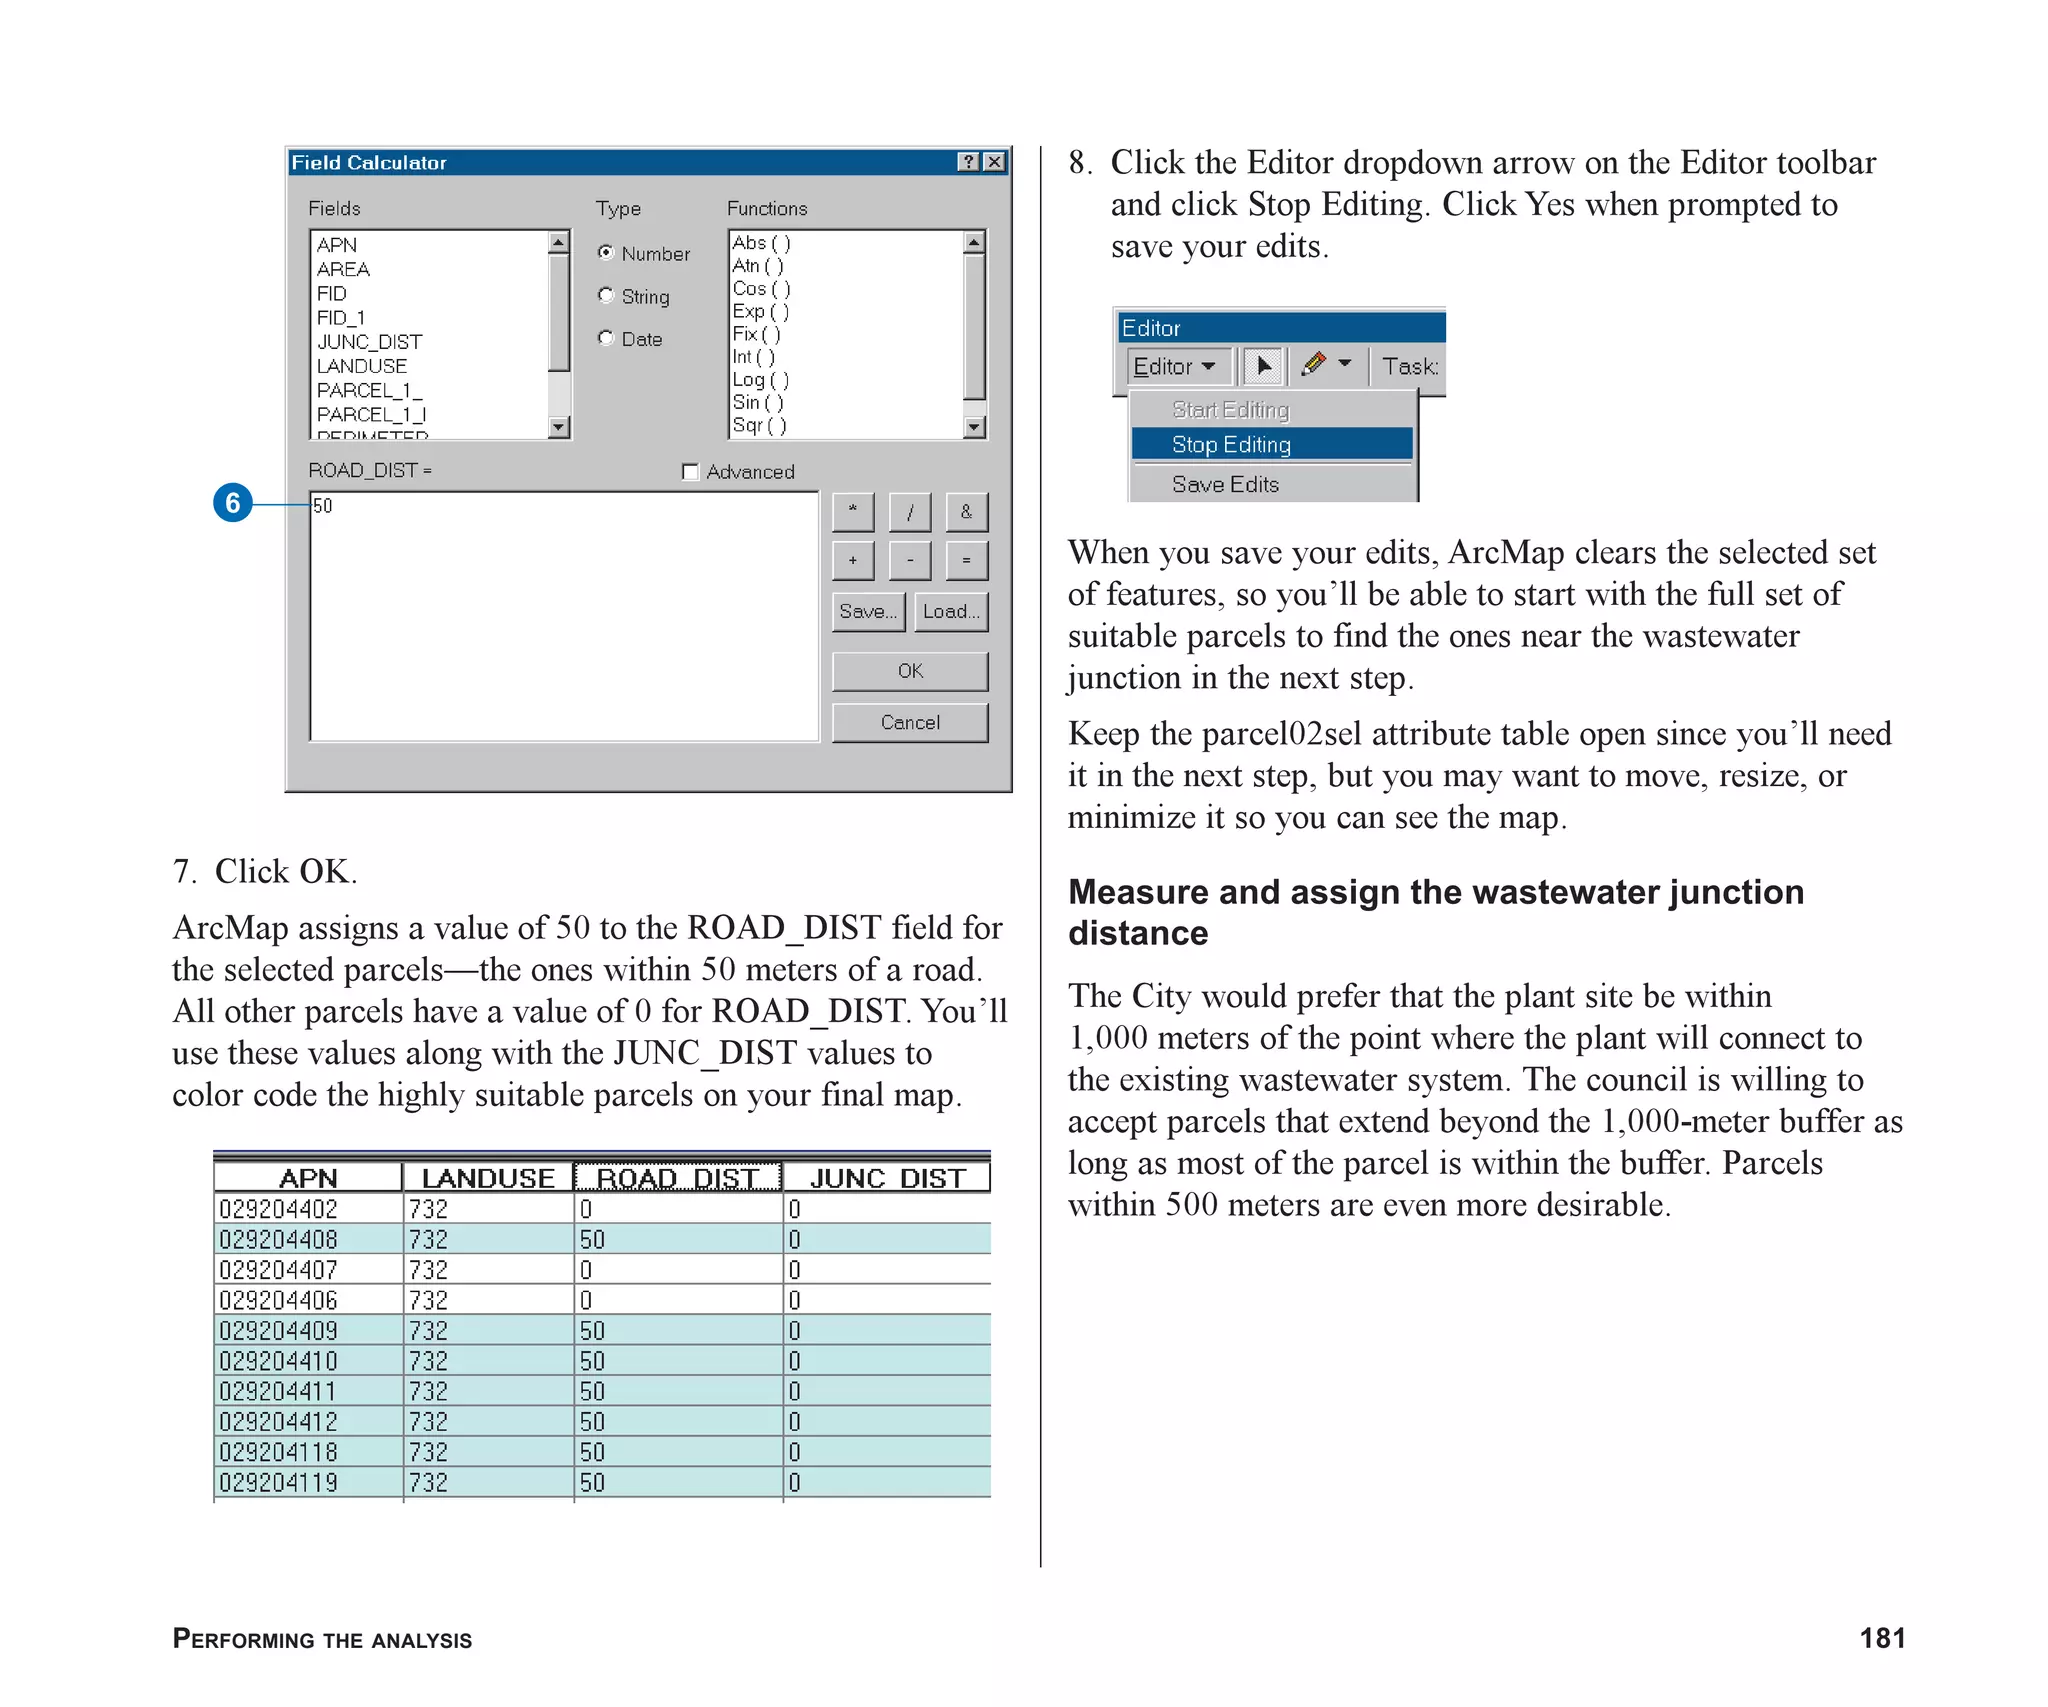
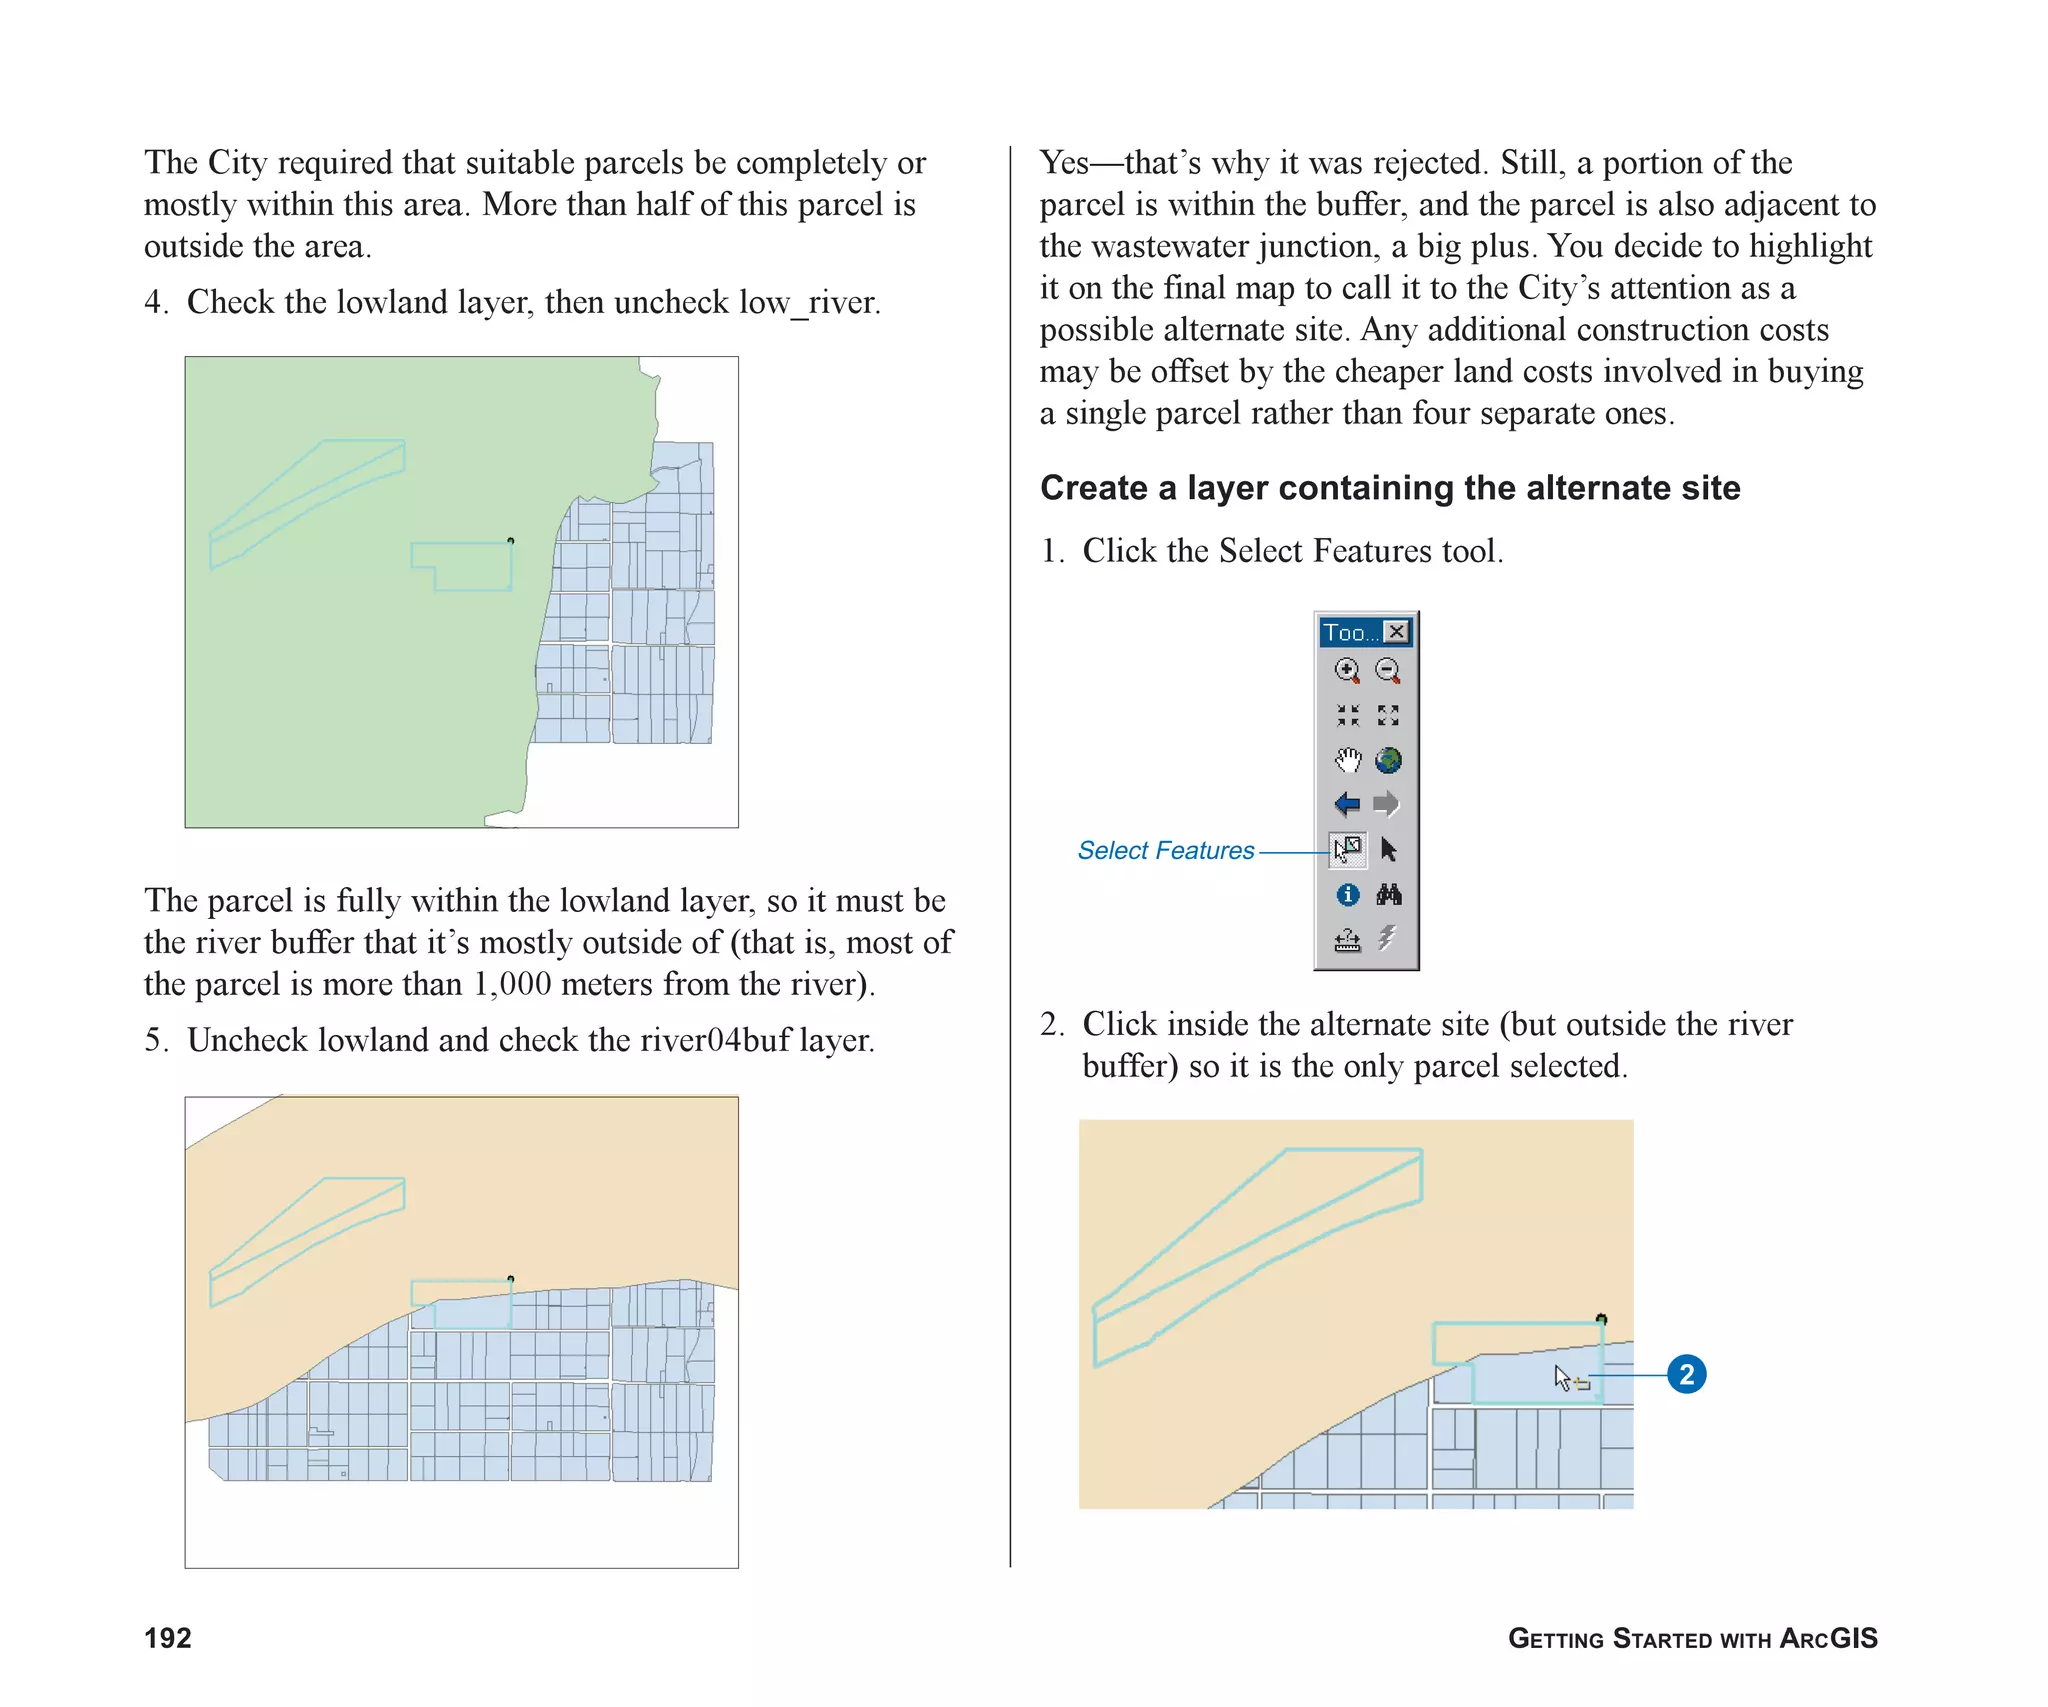
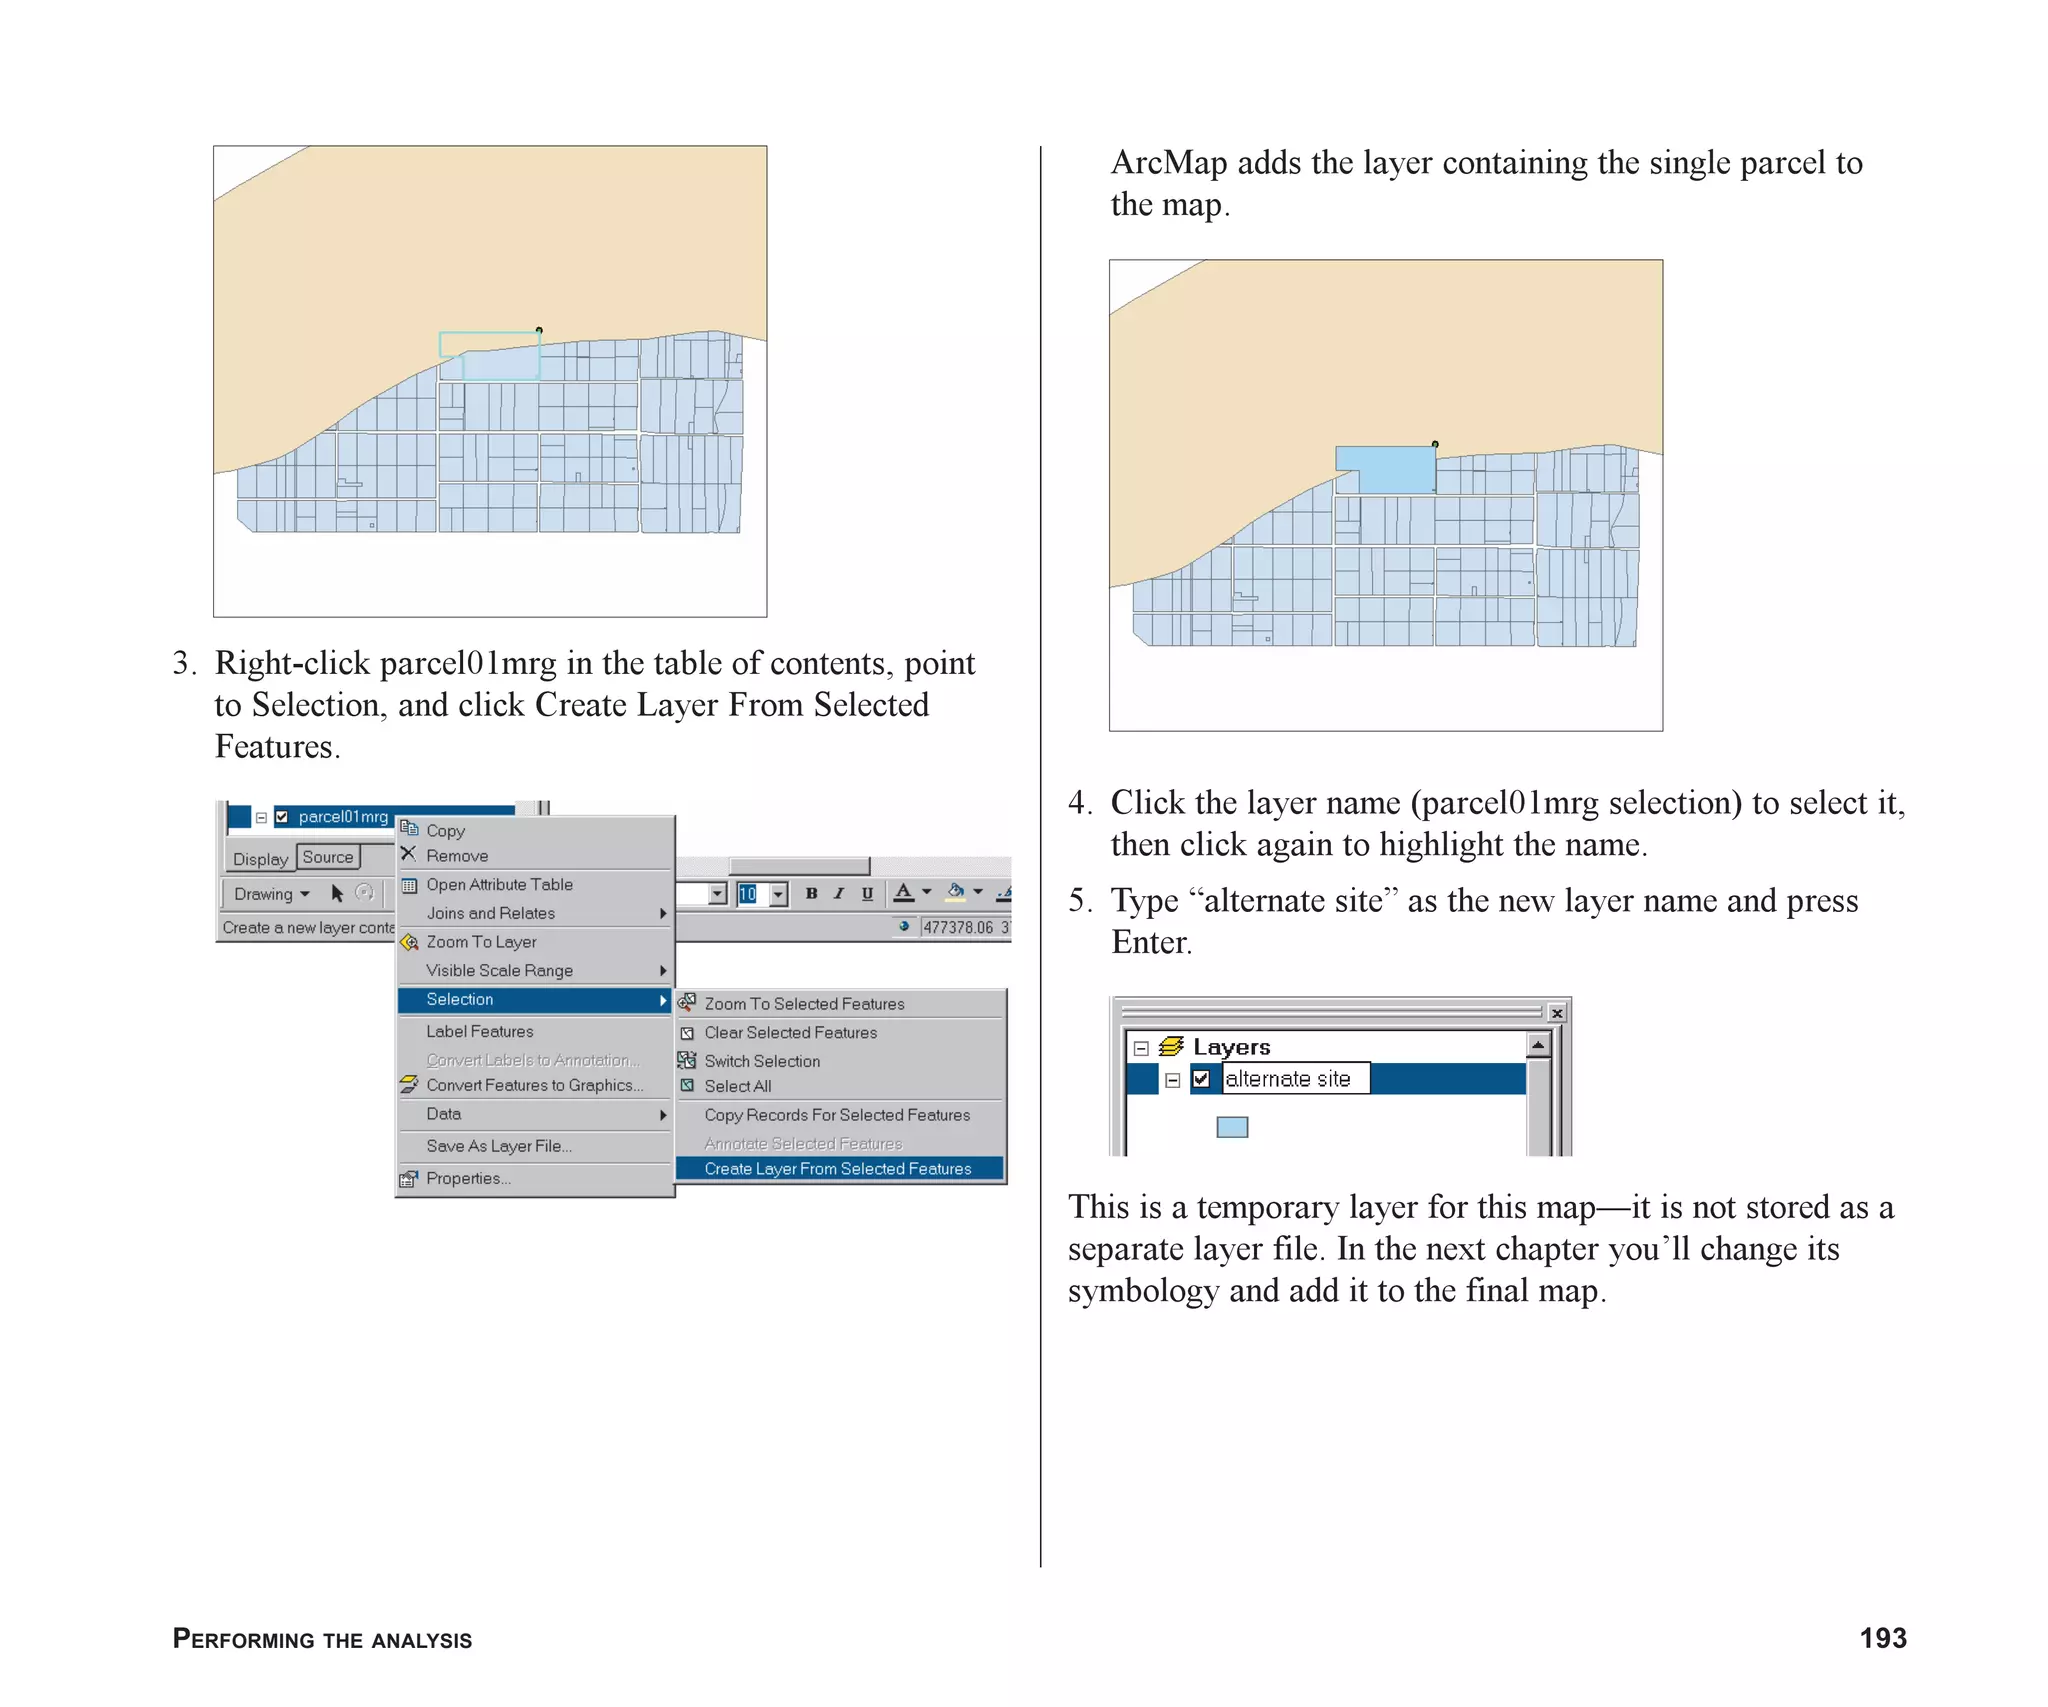
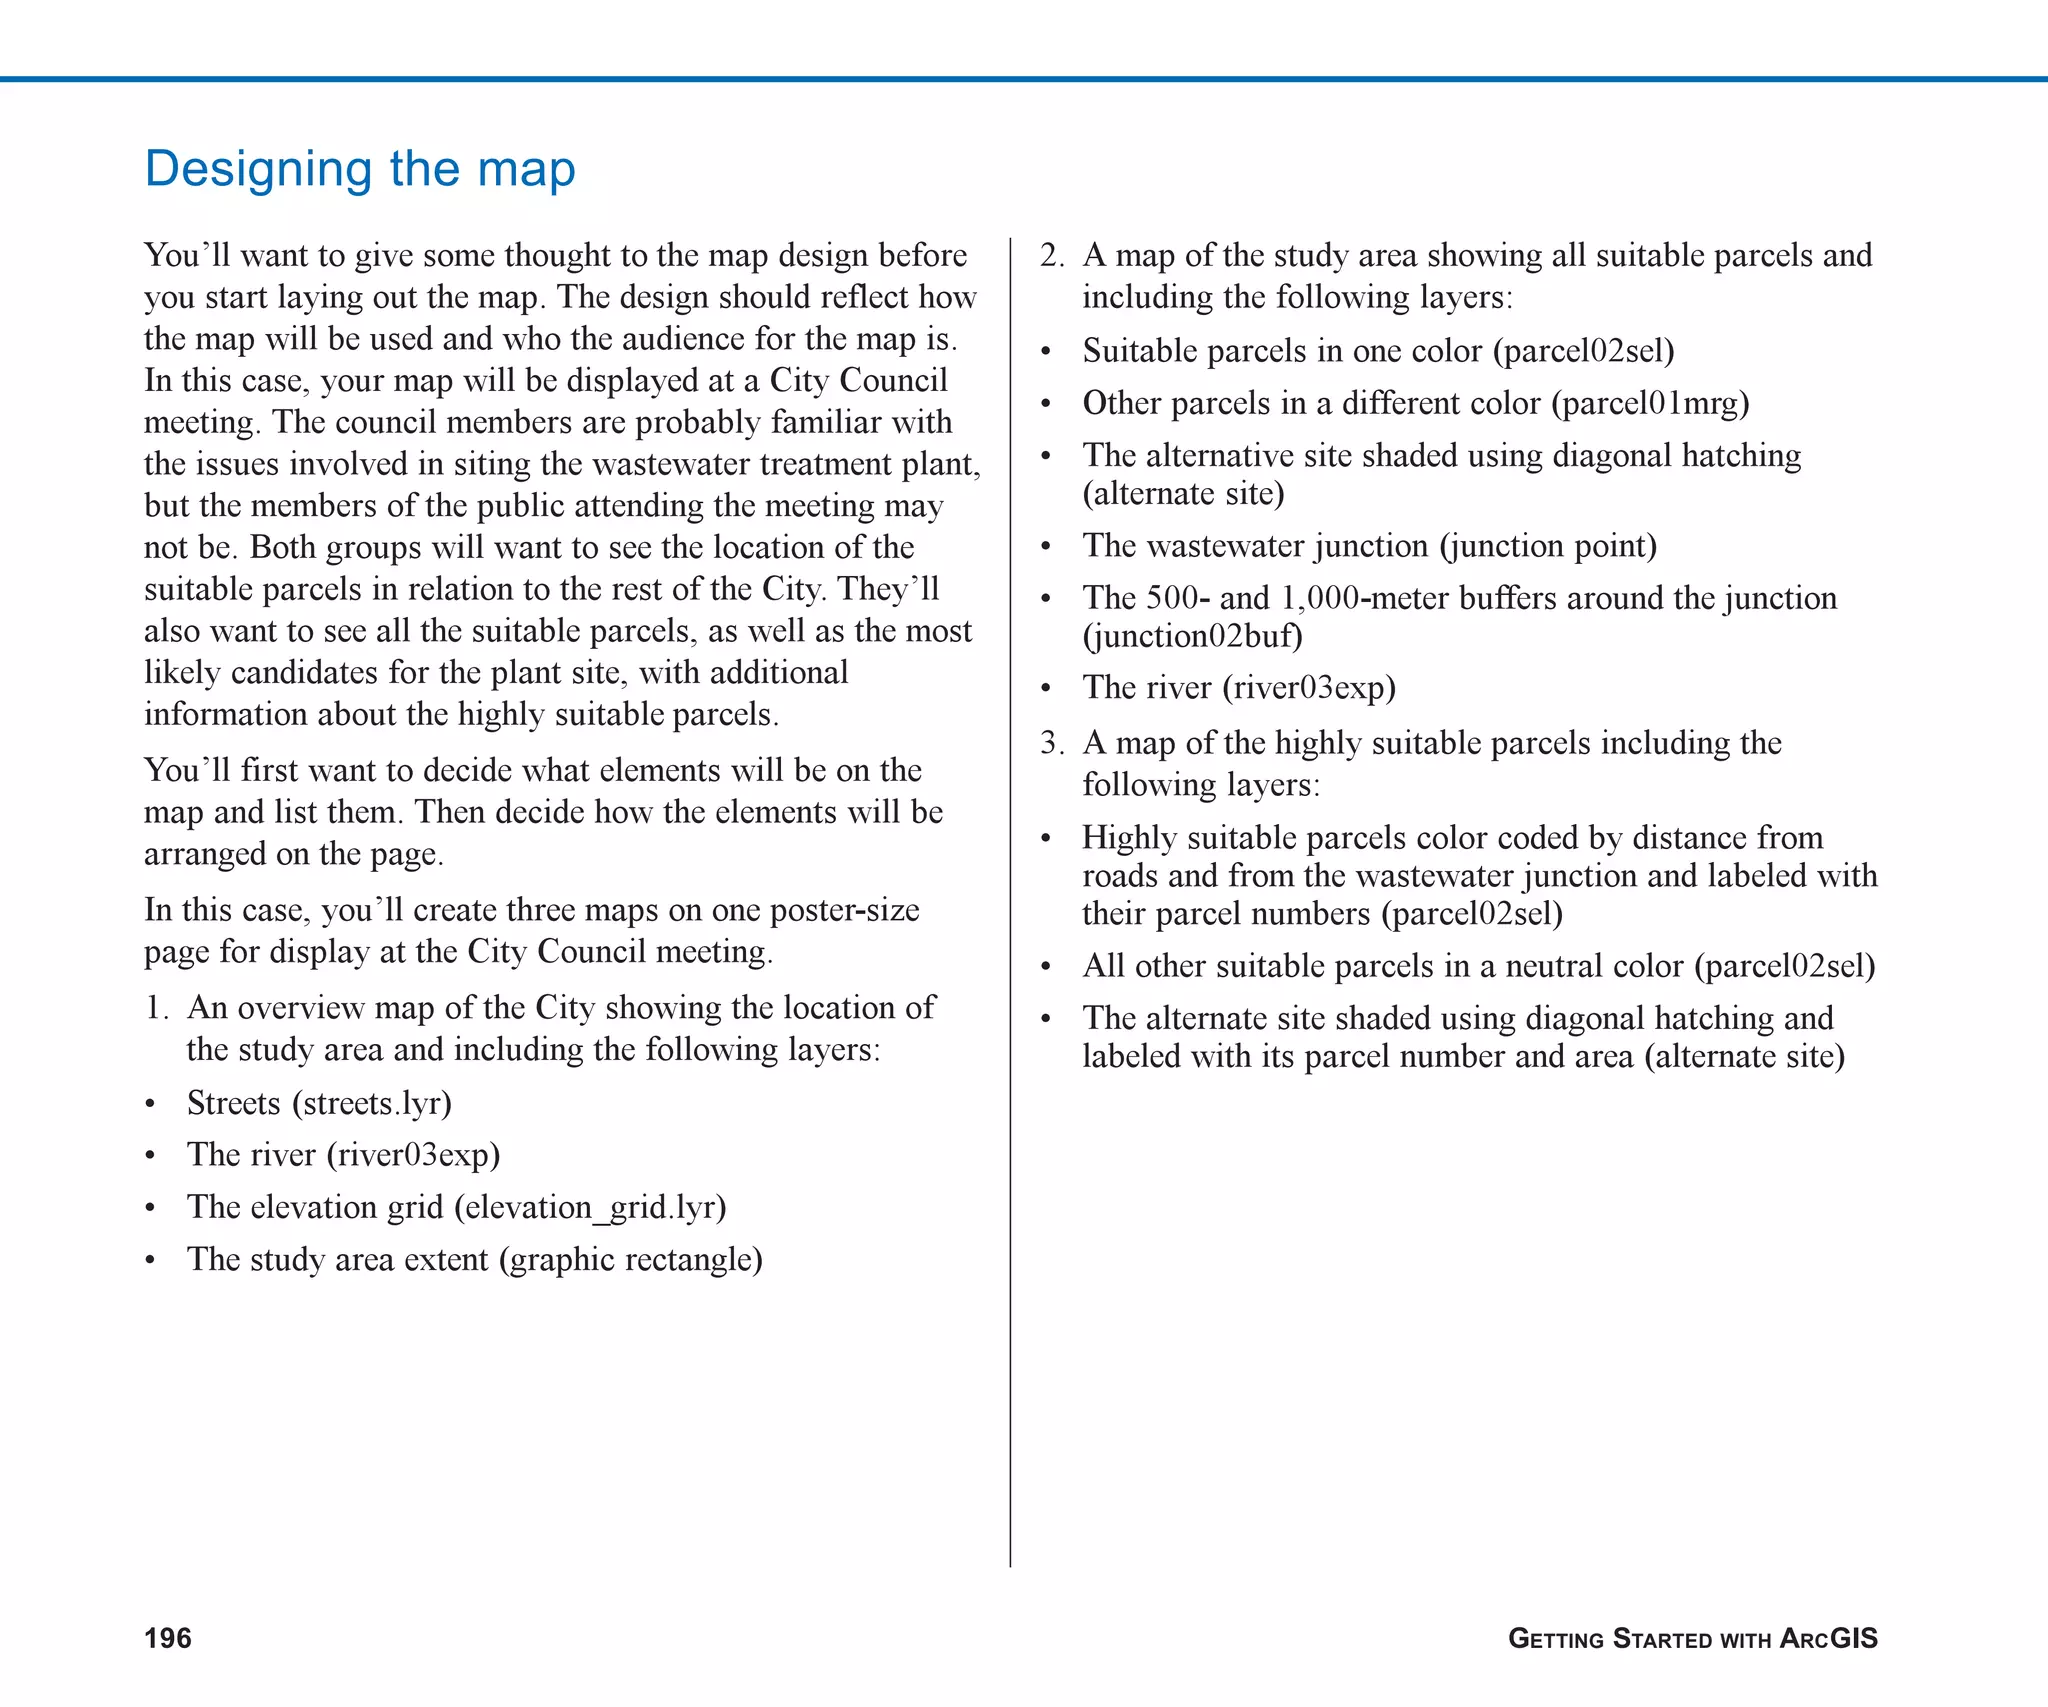
![208 GETTING STARTED WITH ARCGIS
1. Double-click streets under the City Overview data frame
in the table of contents.
Double-clicking a layer is a quick way to get to its Layer
Properties dialog box.
2. Click the Definition Query tab.
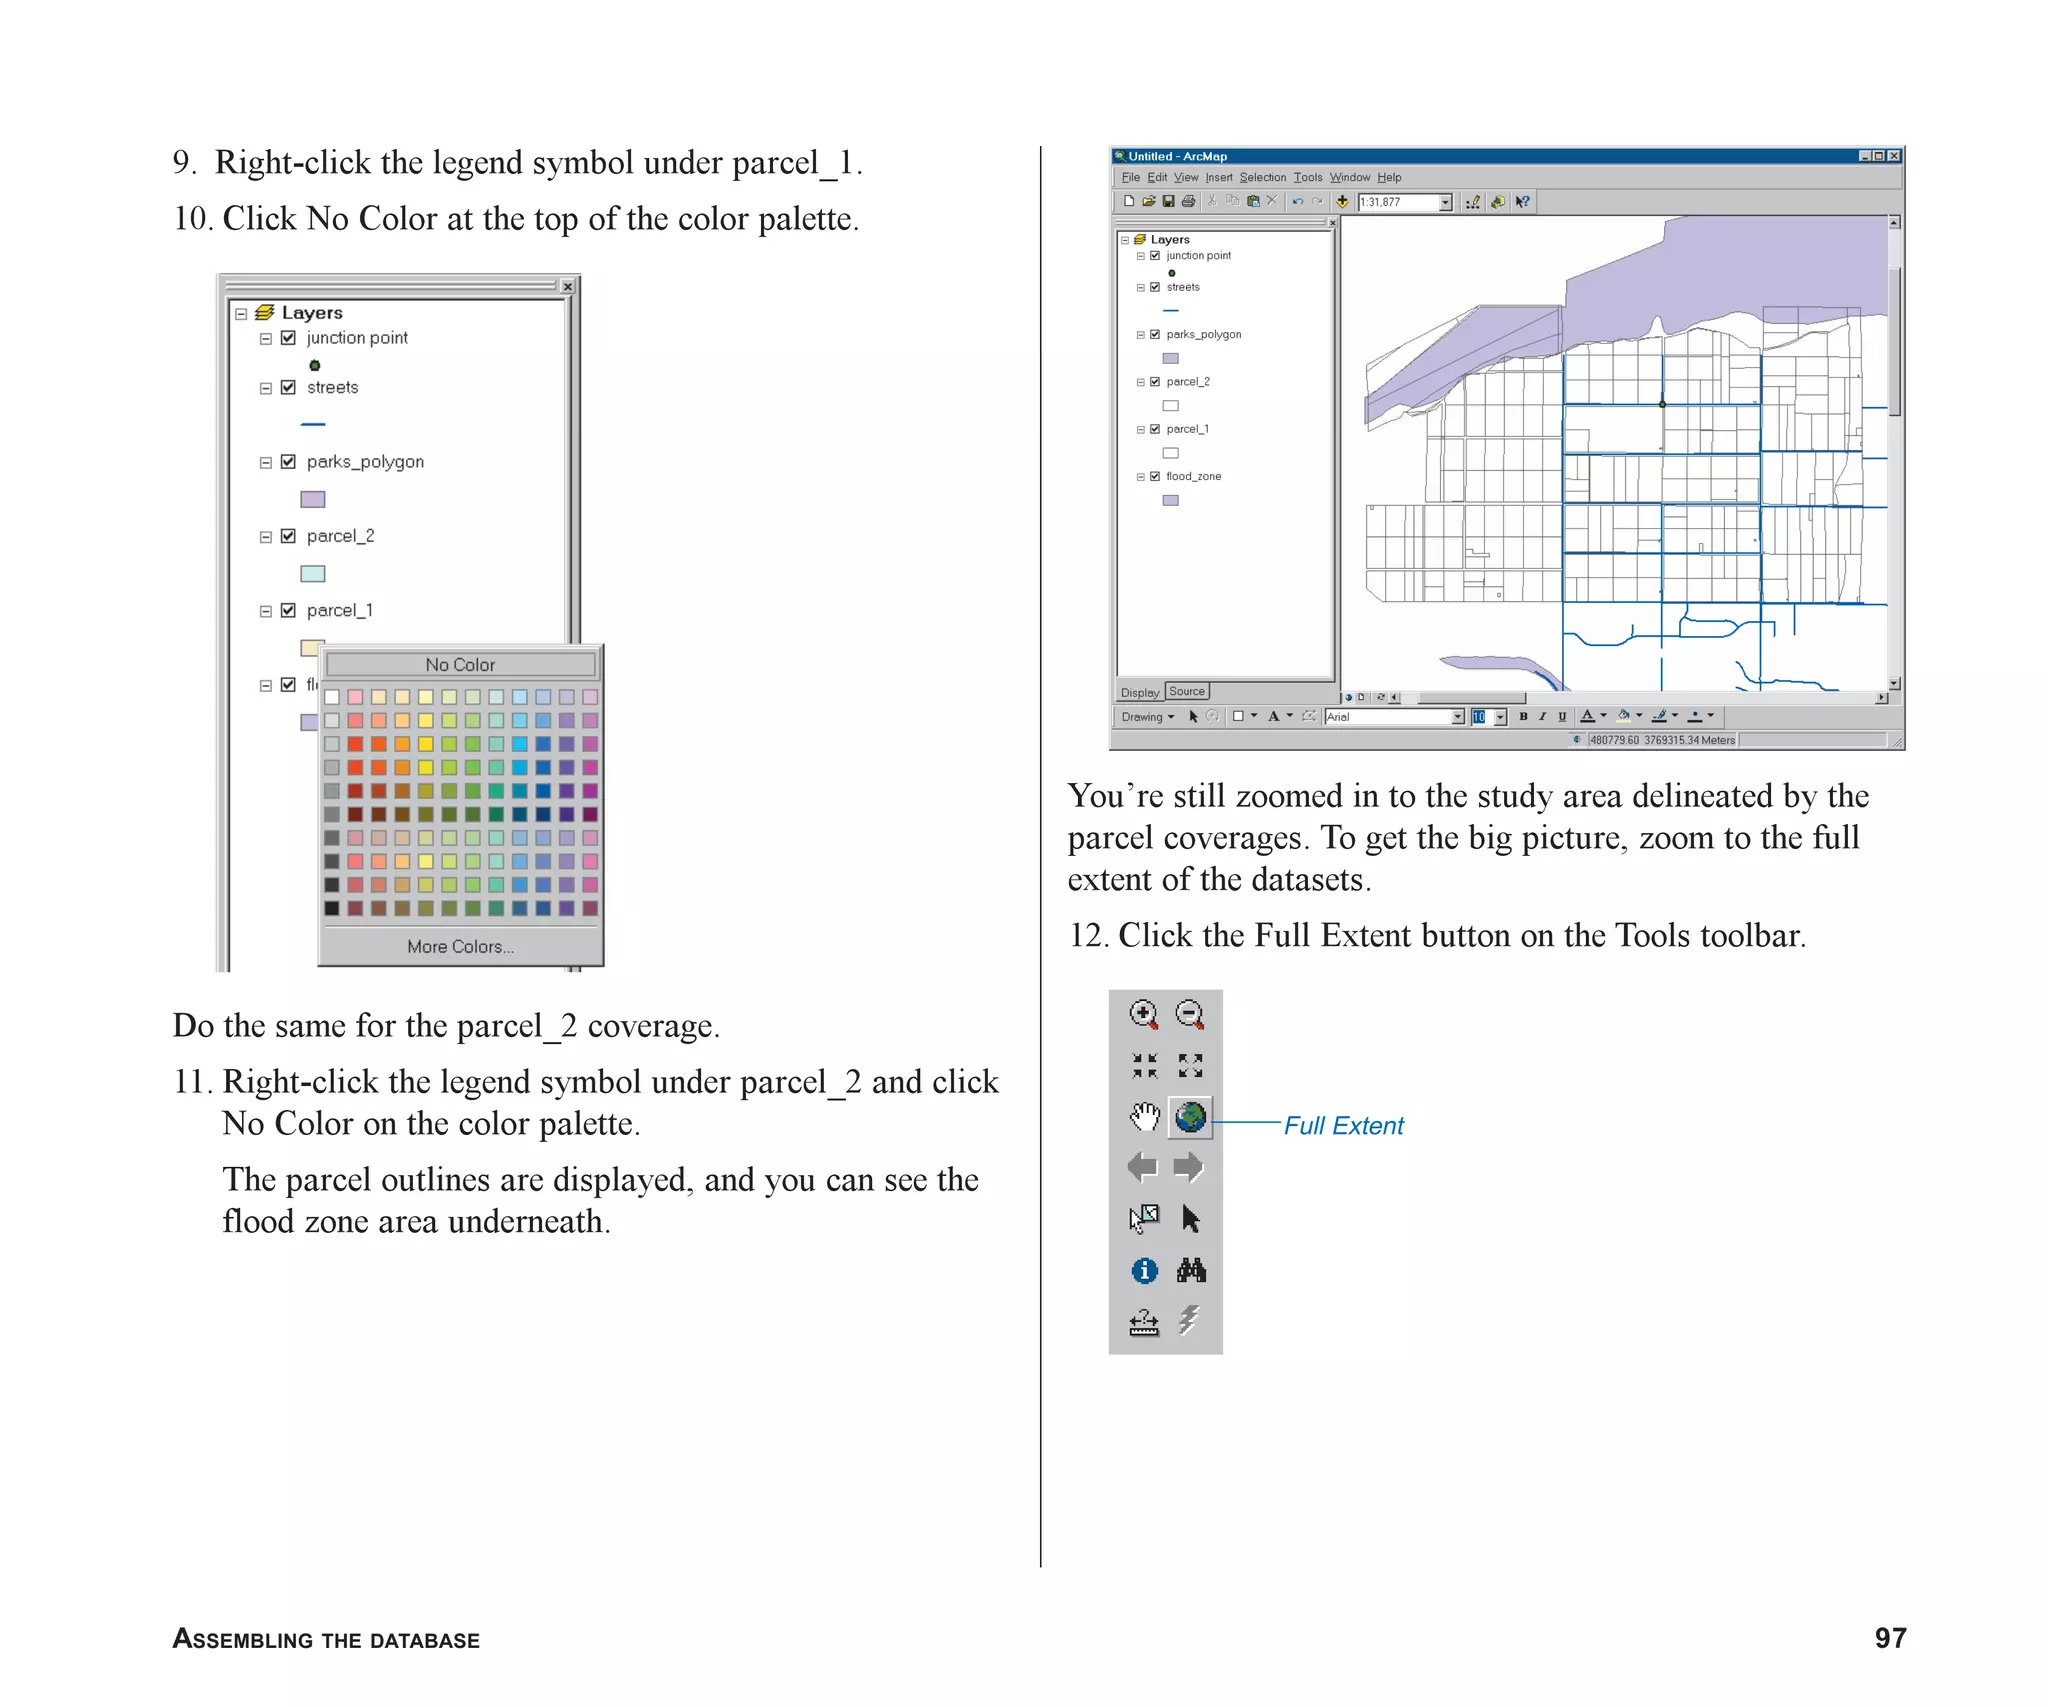
3. Click the Query Builder button.
The Query Builder dialog box appears. It’s similar to the
other query dialog boxes you’ve already seen.
The Greenvalley streets in this database belong
to three classes. Classes 3 and 4 are major streets; class 5
streets are smaller streets. You will select the major streets.
4. Double-click [Type].
5. Click the less than or equal to button (<=).
6. Double-click 4, review the query expression, and then
click OK.
The query expression is added to the Definition Query
tab of the Layer Properties dialog box. It should look
like this:
[TYPE] <= 4
3
ch08.p65 02/15/2001, 4:10 PM
208](https://image.slidesharecdn.com/gettingstartedwitharcgis-230824201747-f95af336/75/Getting_Started_with_ArcGIS-pdf-214-2048.jpg)

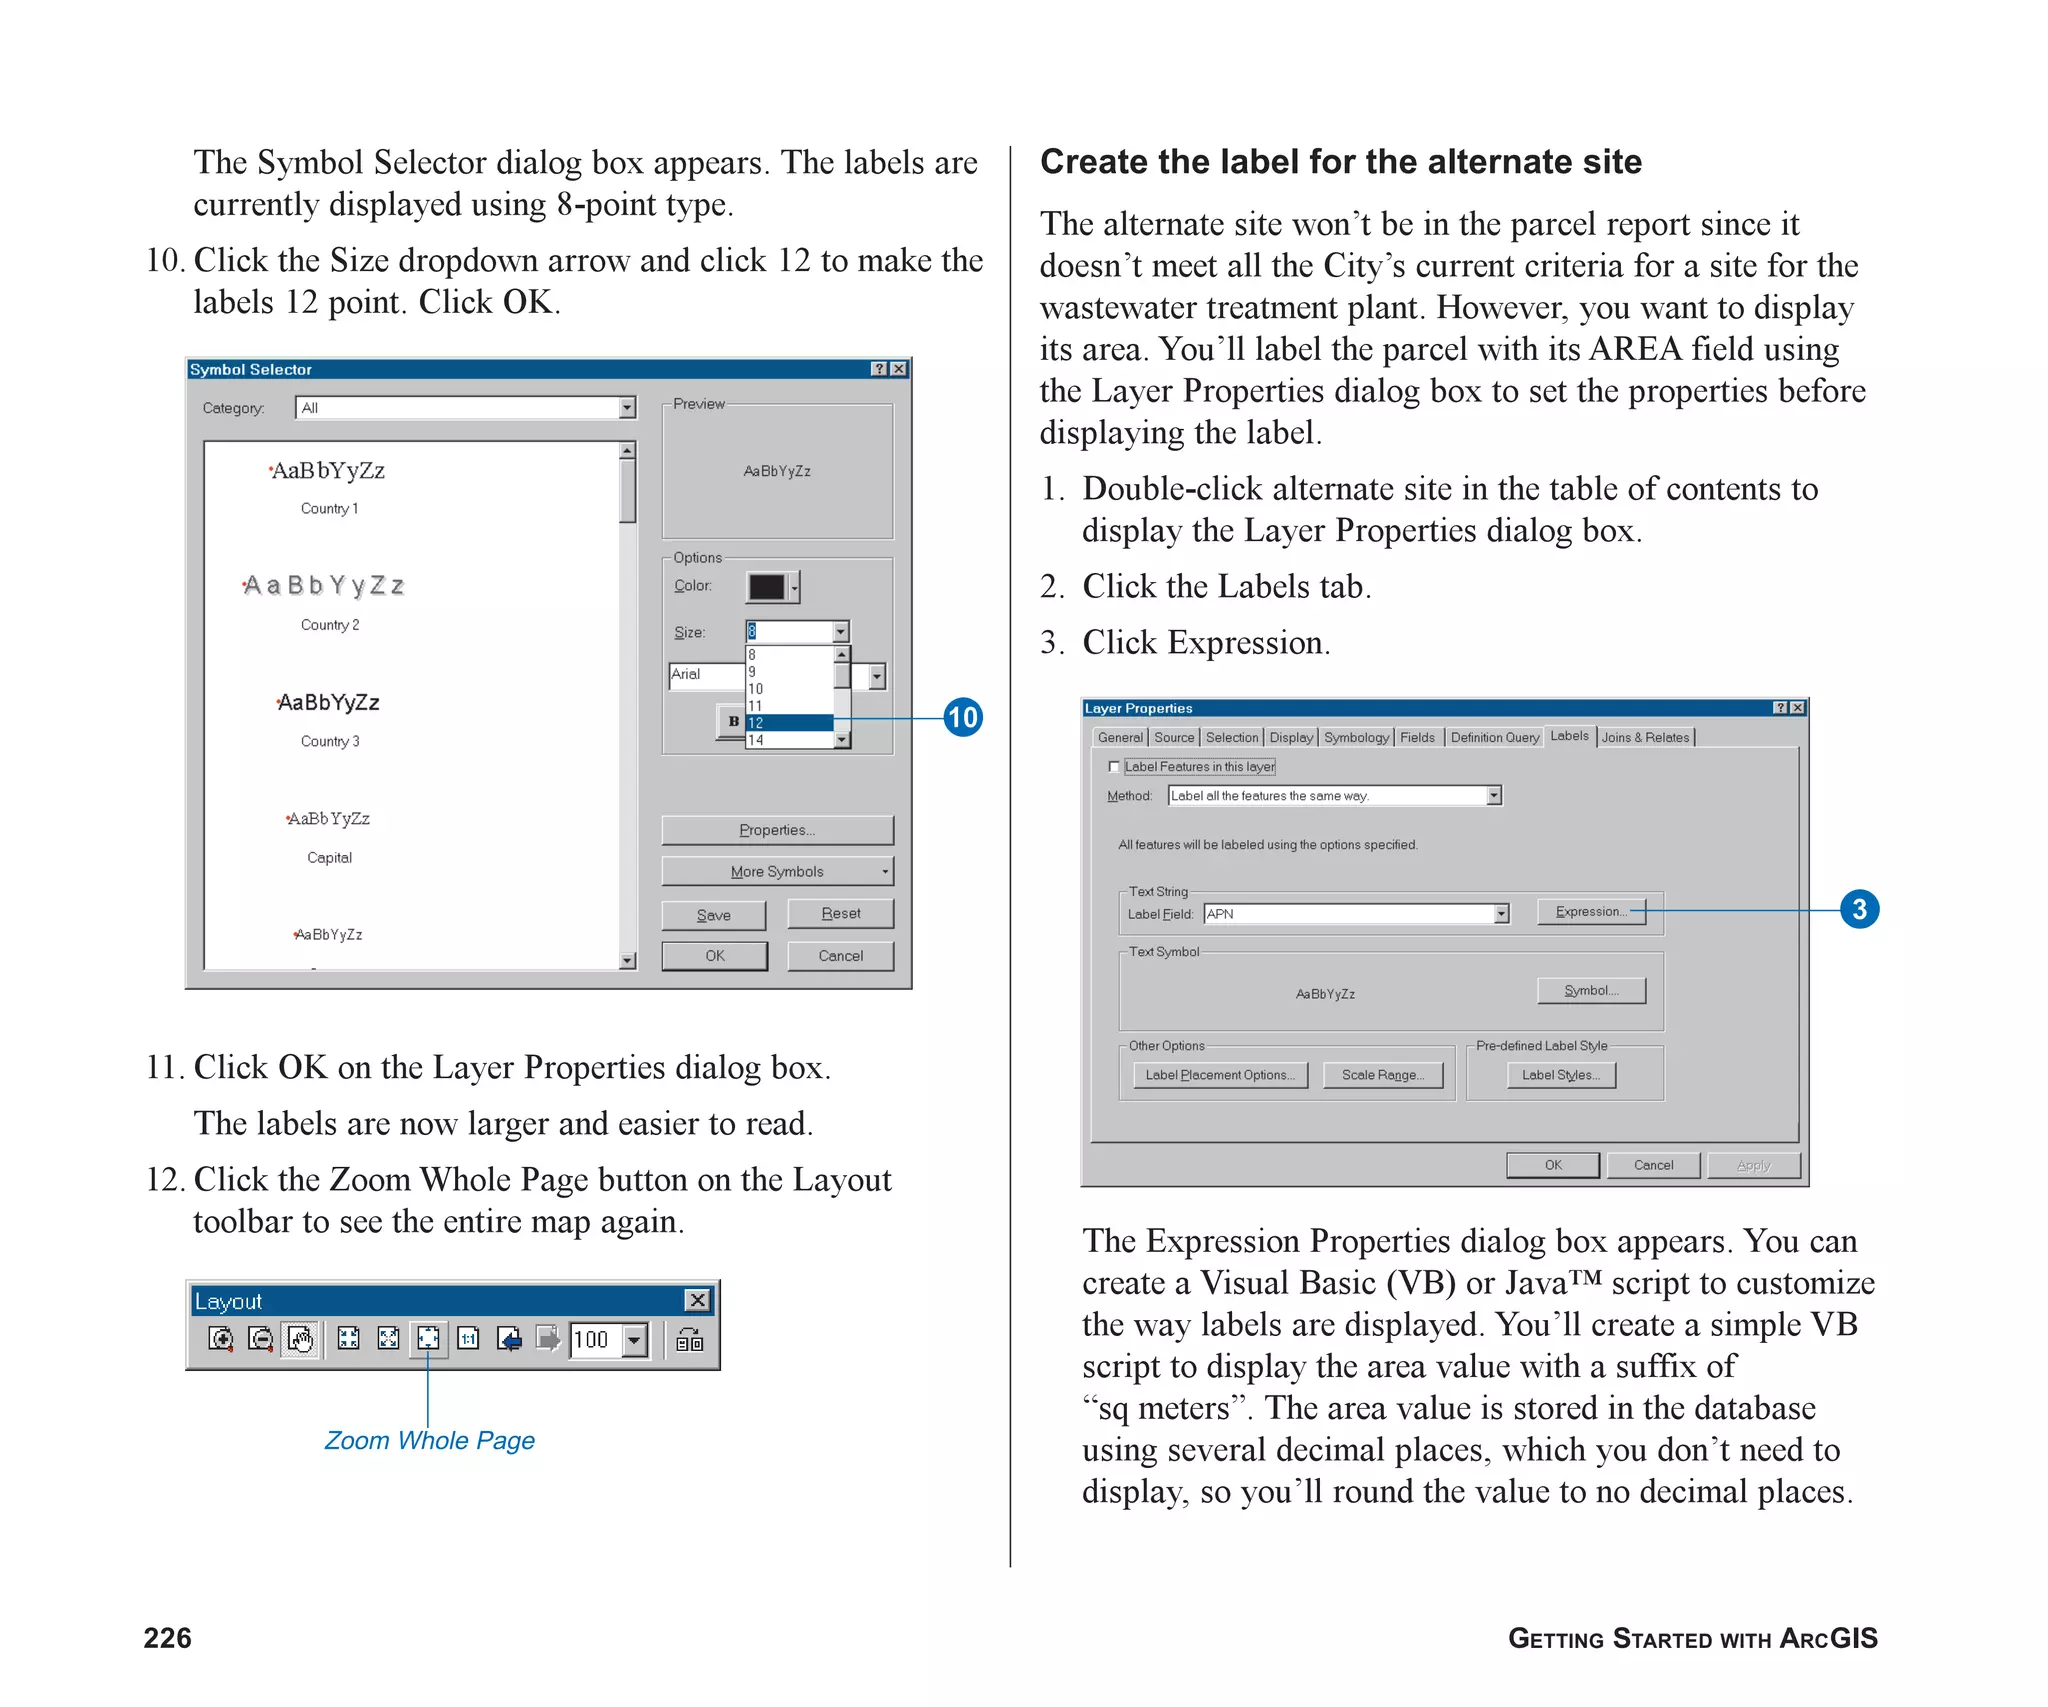
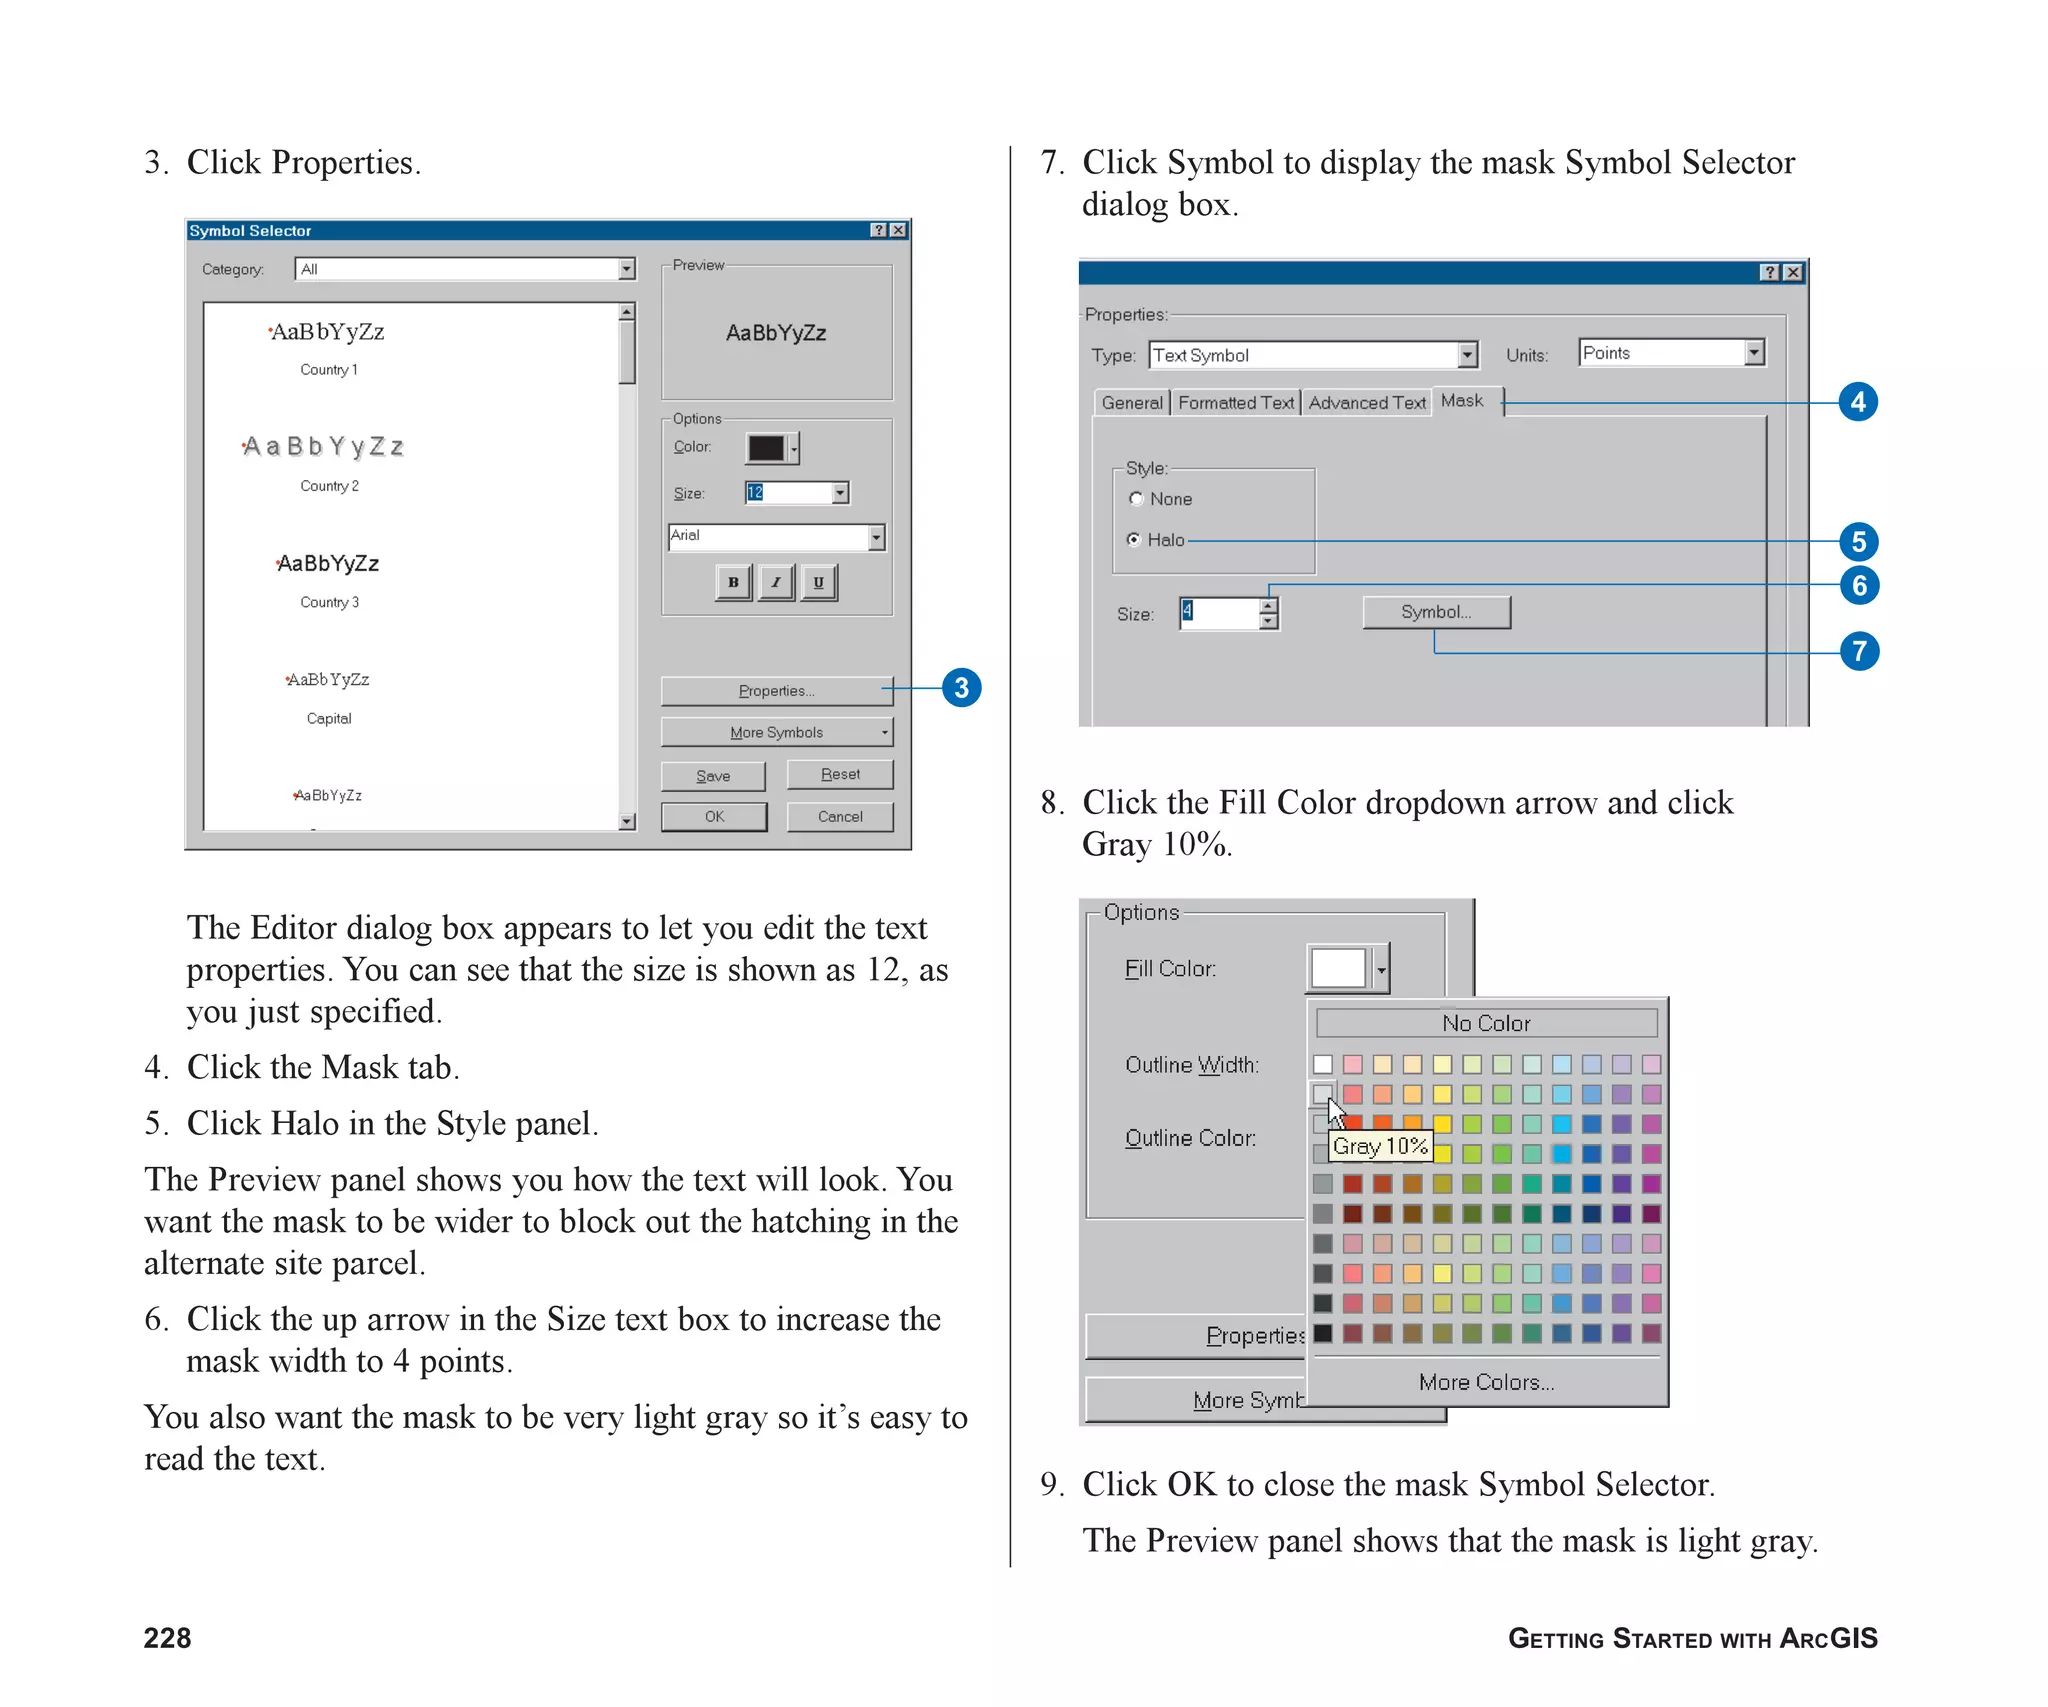
![PRESENTING THE RESULTS 227
You will need to create an expression that looks like
this:
Round( [AREA], 0) & “ “ & “sq meters”
4. Click in the Expression box.
5. Type the expression in full or type all the characters
except the field name, which you can drag from the
Label Fields box.
The VB Round command has two arguments, enclosed in
parentheses—the name of the field, AREA in this case, and
the number of decimal places to round to, 0 in this case.
You enclose in double quotes any text you want to display
as part of the label, in this case “sq meters”. The double
quotes with two spaces inside will ensure there is space
between the area value and the suffix when the label is
displayed. You use an ampersand (&) to connect the
elements of the script.
6. Click the Verify button to make sure you entered the
expression correctly.
The Sample label box appears and tells you the
expression is valid. It also shows you a sample of how
the label will look. (Note that the value displayed in the
Sample label box is not the actual value of the parcel.) If
you get an error message when you click Verify, just
check that you entered the expression correctly, make
any changes, and click Verify again.
7. Click OK to close the Sample label box and click OK to
close the Expression Properties dialog box.
Now you’ve specified what will be in the label. Next you’ll
want to change the way the label is displayed.
Change the label properties and display the label
1. Click Symbol on the Labels tab.
The Symbol Selector dialog box appears.
2. Click the Size dropdown arrow and click 12 to make the
label 12-point text.
Now the label will be large enough, but it will be drawn on
top of the diagonal hatching and might still be difficult to
read. You’ll add a mask around the text so it appears on a
solid background.
5
ch08.p65 02/15/2001, 4:11 PM
227](https://image.slidesharecdn.com/gettingstartedwitharcgis-230824201747-f95af336/75/Getting_Started_with_ArcGIS-pdf-233-2048.jpg)