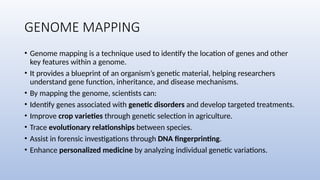
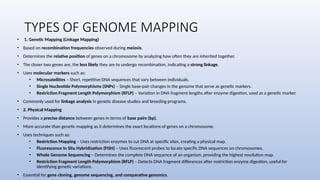
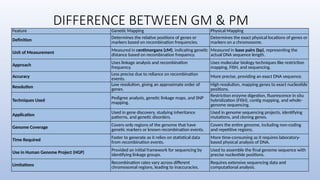
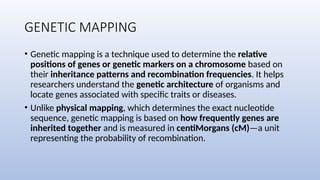
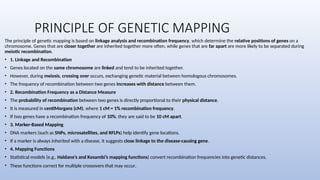
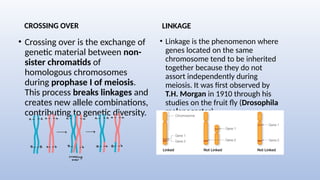
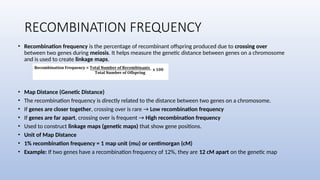
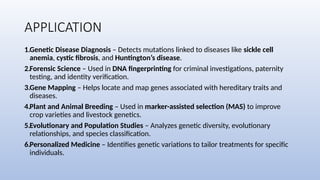
GENETIC MAPPING
BY
TEJASWINI.M
ETHIRAJ COLLEGE FOR WOMEN
GENOME MAPPING
• Genome mapping is a technique used to identify the location of genes and other
key features within a genome.
• It provides a blueprint of an organism’s genetic material, helping researchers
understand gene function, inheritance, and disease mechanisms.
• By mapping the genome, scientists can:
• Identify genes associated with genetic disorders and develop targeted treatments.
• Improve crop varieties through genetic selection in agriculture.
• Trace evolutionary relationships between species.
• Assist in forensic investigations through DNA fingerprinting.
• Enhance personalized medicine by analyzing individual genetic variations.
TYPES OF GENOME MAPPING
• 1. Genetic Mapping (Linkage Mapping)
• Based on recombination frequencies observed during meiosis.
• Determines the relative position of genes on a chromosome by analyzing how often they are inherited together.
• The closer two genes are, the less likely they are to undergo recombination, indicating a strong linkage.
• Uses molecular markers such as:
• Microsatellites – Short, repetitive DNA sequences that vary between individuals.
• Single Nucleotide Polymorphisms (SNPs) – Single base-pair changes in the genome that serve as genetic markers.
• Restriction Fragment Length Polymorphism (RFLP) – Variation in DNA fragment lengths after enzyme digestion, used as a genetic marker.
• Commonly used for linkage analysis in genetic disease studies and breeding programs.
• 2. Physical Mapping
• Provides a precise distance between genes in terms of base pairs (bp).
• More accurate than genetic mapping as it determines the exact locations of genes on a chromosome.
• Uses techniques such as:
• Restriction Mapping – Uses restriction enzymes to cut DNA at specific sites, creating a physical map.
• Fluorescence In Situ Hybridization (FISH) – Uses fluorescent probes to locate specific DNA sequences on chromosomes.
• Whole Genome Sequencing – Determines the complete DNA sequence of an organism, providing the highest resolution map.
• Restriction Fragment Length Polymorphism (RFLP) – Detects DNA fragment differences after restriction enzyme digestion, useful for
identifying genetic variations.
• Essential for gene cloning, genome sequencing, and comparative genomics.
DIFFERENCE BETWEEN GM & PM
Feature Genetic Mapping Physical Mapping
Definition
Determines the relative positions of genes or
markers based on recombination frequencies.
Determines the exact physical locations of genes or
markers on a chromosome.
Unit of Measurement Measured in centimorgans (cM), indicating genetic
distance based on recombination frequency.
Measured in base pairs (bp), representing the
actual DNA sequence length.
Approach
Uses linkage analysis and recombination
frequency.
Uses molecular biology techniques like restriction
mapping, FISH, and sequencing.
Accuracy Less precise due to reliance on recombination
events.
More precise, providing an exact DNA sequence.
Resolution
Low resolution, giving an approximate order of
genes.
High resolution, mapping genes to exact nucleotide
positions.
Techniques Used
Pedigree analysis, genetic linkage maps, and SNP
mapping.
Restriction enzyme digestion, fluorescence in situ
hybridization (FISH), contig mapping, and whole-
genome sequencing.
Application
Used in gene discovery, studying inheritance
patterns, and genetic disorders.
Used in genome sequencing projects, identifying
mutations, and cloning genes.
Genome Coverage Covers only regions of the genome that have
genetic markers or known recombination events.
Covers the entire genome, including non-coding
and repetitive regions.
Time Required
Faster to generate as it relies on statistical data
from recombination events.
More time-consuming as it requires laboratory-
based physical analysis of DNA.
Use in Human Genome Project (HGP) Provided an initial framework for sequencing by
identifying linkage groups.
Used to assemble the final genome sequence with
precise nucleotide positions.
Limitations
Recombination rates vary across different
chromosomal regions, leading to inaccuracies.
Requires extensive sequencing data and
computational analysis.
GENETIC MAPPING
• Genetic mapping is a technique used to determine the relative
positions of genes or genetic markers on a chromosome based on
their inheritance patterns and recombination frequencies. It helps
researchers understand the genetic architecture of organisms and
locate genes associated with specific traits or diseases.
• Unlike physical mapping, which determines the exact nucleotide
sequence, genetic mapping is based on how frequently genes are
inherited together and is measured in centiMorgans (cM)—a unit
representing the probability of recombination.
PRINCIPLE OF GENETIC MAPPING
The principle of genetic mapping is based on linkage analysis and recombination frequency, which determine the relative positions of genes on a
chromosome. Genes that are closer together are inherited together more often, while genes that are far apart are more likely to be separated during
meiotic recombination.
• 1. Linkage and Recombination
• Genes located on the same chromosome are linked and tend to be inherited together.
• However, during meiosis, crossing over occurs, exchanging genetic material between homologous chromosomes.
• The frequency of recombination between two genes increases with distance between them.
• 2. Recombination Frequency as a Distance Measure
• The probability of recombination between two genes is directly proportional to their physical distance.
• It is measured in centiMorgans (cM), where 1 cM = 1% recombination frequency.
• If two genes have a recombination frequency of 10%, they are said to be 10 cM apart.
• 3. Marker-Based Mapping
• DNA markers (such as SNPs, microsatellites, and RFLPs) help identify gene locations.
• If a marker is always inherited with a disease, it suggests close linkage to the disease-causing gene.
• 4. Mapping Functions
• Statistical models (e.g., Haldane’s and Kosambi’s mapping functions) convert recombination frequencies into genetic distances.
• These functions correct for multiple crossovers that may occur.
CROSSING OVER
• Crossing over is the exchange of
genetic material between non-
sister chromatids of
homologous chromosomes
during prophase I of meiosis.
This process breaks linkages and
creates new allele combinations,
contributing to genetic diversity.
LINKAGE
• Linkage is the phenomenon where
genes located on the same
chromosome tend to be inherited
together because they do not
assort independently during
meiosis. It was first observed by
T.H. Morgan in 1910 through his
studies on the fruit fly (Drosophila
melanogaster).
RECOMBINATION FREQUENCY
• Recombination frequency is the percentage of recombinant offspring produced due to crossing over
between two genes during meiosis. It helps measure the genetic distance between genes on a chromosome
and is used to create linkage maps.
• Map Distance (Genetic Distance)
• The recombination frequency is directly related to the distance between two genes on a chromosome.
• If genes are closer together, crossing over is rare → Low recombination frequency
• If genes are far apart, crossing over is frequent → High recombination frequency
• Used to construct linkage maps (genetic maps) that show gene positions.
• Unit of Map Distance
• 1% recombination frequency = 1 map unit (mu) or centimorgan (cM)
• Example: If two genes have a recombination frequency of 12%, they are 12 cM apart on the genetic map
Genetic Markers
• Genetic markers are specific DNA sequences or variations that serve as identifiable
landmarks on a chromosome.
• They are used to track inheritance patterns, map genes, and study genetic diseases.
• These markers can be genes or non-coding DNA sequences that show variations
(polymorphisms) between individuals.
Feature Gene 🧬 Genetic Marker️🏷️
Definition
A segment of DNA that codes
for a protein or functional RNA.
A specific DNA sequence used
as a reference point in genetic
studies.
Function
Determines traits by coding for
proteins or regulating biological
processes.
Helps track inheritance, locate
genes, and study genetic
variations.
Presence
Found throughout the genome,
both coding and non-coding
regions.
Usually found in variable
(polymorphic) regions of DNA.
Examples
BRCA1 (linked to breast
cancer), Hemoglobin gene
(HBB), Insulin gene.
RFLP, SNPs, Microsatellites
(SSRs), AFLP.
Use in Research
Studied to understand genetic
diseases, evolution, and
biological functions.
Used in DNA fingerprinting,
gene mapping, forensic
science, and plant breeding.
TYPES OF MARKERS
• Types of Genetic Markers
• Genetic markers can be broadly classified into three categories:
• 1. Morphological Markers (Classical Markers)
• Based on visible traits such as eye color, plant height, or seed shape.
• Limitations: Subject to environmental influence and not always reliable for genetic studies.
• 2. Biochemical Markers
• Involve proteins or enzymes that show genetic variation.
• Example: Isozymes – Different forms of enzymes encoded by different alleles.
• 3. Molecular Markers (DNA Markers) 🔬
• Molecular markers are the most widely used because they provide precise genetic information. They are classified into:
a) RFLP (Restriction Fragment Length Polymorphism)
• Based on differences in DNA sequences detected by cutting DNA with restriction enzymes.
• Used in genetic mapping and disease identification.
b) SNP (Single Nucleotide Polymorphism)
• Single base pair variations in DNA sequences.
• Commonly used in genome-wide association studies (GWAS) to identify disease-related genes.
RFLP-Restriction Fragment Length
Polymorphism
• RFLP (Restriction Fragment Length Polymorphism) is a molecular technique used
to identify variations in DNA sequences by cutting DNA with restriction enzymes
and analyzing the resulting fragment lengths. These variations are useful as
genetic markers for gene mapping, disease diagnosis, and forensic analysis.
• Steps in RFLP Analysis
1.DNA Extraction
2.Digestion with Restriction Enzymes
3.Gel Electrophoresis
4.Southern Blotting & Hybridization
5.Analysis of Band Patterns
STEPS IN RFLP
1. DNA Extraction
• Cells are lysed to release DNA.
• Proteins and lipids are removed using enzymes and organic solvents.
• DNA is precipitated using alcohol and stored in a buffer.
2. Digestion with Restriction Enzymes
• DNA is incubated with a specific restriction enzyme at 37°C.
• The enzyme recognizes and cuts palindromic sequences.
• Digestion produces DNA fragments of varying lengths.
3. Gel Electrophoresis
• DNA fragments are loaded into an agarose gel.
• An electric current is applied, causing DNA to migrate towards the positive electrode.
• Smaller fragments move faster, separating DNA based on size.
• The gel is stained, and bands are visualized under UV light.
4. Southern Blotting & Hybridization
• DNA fragments are transferred from the gel to a nitrocellulose or nylon membrane.
• DNA is denatured into single strands using an alkaline solution.
• A labeled DNA probe complementary to the target sequence is added.
• The probe binds to the target sequence, and unbound probes are washed off.
• Detection is done using autoradiography or fluorescent imaging.
5. Analysis of Band Patterns
• Band patterns of individuals are compared to detect genetic variations.
• Differences in fragment sizes indicate the presence or absence of restriction sites.
• Used for genotyping, disease detection, forensic analysis, and gene mapping.
APPLICATION
1.Genetic Disease Diagnosis – Detects mutations linked to diseases like sickle cell
anemia, cystic fibrosis, and Huntington’s disease.
2.Forensic Science – Used in DNA fingerprinting for criminal investigations, paternity
testing, and identity verification.
3.Gene Mapping – Helps locate and map genes associated with hereditary traits and
diseases.
4.Plant and Animal Breeding – Used in marker-assisted selection (MAS) to improve
crop varieties and livestock genetics.
5.Evolutionary and Population Studies – Analyzes genetic diversity, evolutionary
relationships, and species classification.
6.Personalized Medicine – Identifies genetic variations to tailor treatments for specific
individuals.
Advantages and Disadvantages of RFLP
• Advantages
1. High Accuracy – Provides precise identification of genetic variations.
2. Reliable and Reproducible – Produces consistent results when performed correctly.
3. Useful for Genetic Mapping – Helps determine the location of genes and genetic markers.
4. Can Analyze Any DNA Sample – Works on various sources like blood, tissues, and plants.
5. Detects Both Small and Large Mutations – Can identify single nucleotide changes, insertions, or deletions.
• Disadvantages
1. Time-Consuming – Requires multiple steps like digestion, electrophoresis, blotting, and hybridization.
2. Labor-Intensive – Involves complex procedures and requires skilled personnel.
3. Requires Large DNA Samples – Not suitable for degraded or low-quality DNA.
4. Expensive – Needs restriction enzymes, probes, and specialized equipment.
5. Limited Sensitivity – Cannot detect very small genetic variations as efficiently as modern techniques.
6. Largely Replaced by PCR-Based Methods – Faster techniques like SNP analysis, STR analysis, and AFLP are now
preferred.
SNP(Single Nucleotide Polymorphism)
• SNP stands for Single Nucleotide Polymorphism. It is a type of genetic
variation that occurs when a single nucleotide (A, T, C, or G) in the DNA
sequence is altered at a specific position in the genome. These
variations are common in the population and can be found throughout
the genome, both in coding (gene) and non-coding regions.
DETECTION OF SNP
• 1. Hybridization-Based SNP Detection
• Steps:
• Design a probe (short DNA or RNA sequence) complementary to the target SNP.
• A probe (a short, single-stranded DNA or RNA sequence)
complementary to the target SNP site is designed.
•The sample DNA is denatured (separated into single strands) and allowed
to hybridize with the probe.
•If the target sequence perfectly matches the probe, strong hybridization
occurs. If there is an SNP mismatch, hybridization may be weaker or
absent.
•Differences in hybridization strength are detected using fluorescence, radioactive
labeling, or changes in electrical signals.
DNA Microarray
• Microarrays are solid surfaces (such as glass
slides or silicon chips) containing thousands of
immobilized probes that hybridize with DNA
samples to detect SNPs at multiple loci
simultaneously.
• The sample DNA is fragmented, labeled with a
fluorescent dye, and hybridized to the chip.
• A scanner detects fluorescence intensity,
indicating which probes have hybridized with
the sample DNA.
Solution hybridization
1. Preparation of Microtiter Tray Wells
 A microtiter tray is prepared, with each well containing a different oligonucleotide probe specific
to a target SNP.
• Labeling of Probes
 Each oligonucleotide is labeled at one end with a fluorescent dye and at the other end with a
quenching compound.
 In the unhybridized state, the oligonucleotide’s ends base-pair, keeping the quencher close to the
dye, preventing fluorescence.
2. Denaturation of Sample DNA
 The test DNA sample is denatured (heated to separate strands), allowing it to hybridize with
complementary probes.
3. Hybridization Process
 The single-stranded test DNA is added to the wells and incubated under controlled
conditions.
 If the test DNA matches the probe sequence, it hybridizes with the oligonucleotide
probe, disrupting the internal base pairing of the probe.
 This separation moves the quencher away from the fluorescent dye.
4. Detection of Fluorescence
 A fluorescence detector measures the signal in each well.
 Wells where hybridization occurs show increased fluorescence, indicating the presence
of a specific SNP.
5. Data Analysis
 The fluorescence intensity is analyzed to determine which SNP variant is present in the
sample.
 Results can be used for genotyping, disease association studies, or personalized
medicine applications.
Advantages of SNP
• Advantages of SNPs
1. High Stability – SNPs are more stable than other genetic variations, such as insertions or deletions, making
them ideal for genetic studies.
2. Abundant in the Genome – SNPs occur frequently (about every 300 nucleotides in the human genome),
providing a vast number of markers for analysis.
3. Useful in Disease Association Studies – SNPs help identify genetic risk factors for diseases like cancer,
diabetes, and cardiovascular conditions.
4. Key in Pharmacogenomics – SNPs influence how individuals respond to drugs, enabling personalized
medicine.
5. Efficient for Genetic Mapping – SNPs serve as excellent genetic markers for linkage and association studies.
6. Facilitates Ancestry and Evolutionary Studies – SNP analysis helps trace evolutionary relationships and
ancestry across populations.
7. Cost-Effective for Genotyping – SNP genotyping methods, such as microarrays and sequencing, are relatively
affordable and scalable for large studies.
Disadvantages of SNP
• 1. Limited Impact on Function – Many SNPs occur in non-coding regions and may not have a significant biological
effect.
• 2. Single Base Change May Not Be Significant – Unlike structural variations, a single nucleotide change often has a
minor effect on gene function.
• 3. Not Always Indicative of Disease – The presence of an SNP does not necessarily mean it causes a disease; it
may only be a marker.
• 4. Complex Interpretation – Some SNPs have weak associations with traits, making interpretation challenging in
genetic studies.
• 5. Ethnic Variability – SNP frequencies differ among populations, limiting their generalizability in genetic research.
• 6. Requires Advanced Detection Methods – SNP analysis relies on specialized techniques like microarrays,
sequencing, or PCR, requiring expertise and equipment.
REFERENCE
• https://www.ncbi.nlm.nih.gov/books/NBK21116/
• https://bio.libretexts.org/Bookshelves/Introductory_and_General_Bio
logy/General_Biology_(Boundless)/17%3A_Biotechnology_and_Geno
mics/17.02%3A_Mapping_Genomes/17.2A%3A_Genetic_Maps
• https://www.nature.com/articles/s41598-022-20999-7
• https://pubmed.ncbi.nlm.nih.gov/1991580/
Genetic mapping And Genetic markers.pptx

Genetic mapping And Genetic markers.pptx

  • 1.
  • 2.
    GENOME MAPPING • Genomemapping is a technique used to identify the location of genes and other key features within a genome. • It provides a blueprint of an organism’s genetic material, helping researchers understand gene function, inheritance, and disease mechanisms. • By mapping the genome, scientists can: • Identify genes associated with genetic disorders and develop targeted treatments. • Improve crop varieties through genetic selection in agriculture. • Trace evolutionary relationships between species. • Assist in forensic investigations through DNA fingerprinting. • Enhance personalized medicine by analyzing individual genetic variations.
  • 3.
    TYPES OF GENOMEMAPPING • 1. Genetic Mapping (Linkage Mapping) • Based on recombination frequencies observed during meiosis. • Determines the relative position of genes on a chromosome by analyzing how often they are inherited together. • The closer two genes are, the less likely they are to undergo recombination, indicating a strong linkage. • Uses molecular markers such as: • Microsatellites – Short, repetitive DNA sequences that vary between individuals. • Single Nucleotide Polymorphisms (SNPs) – Single base-pair changes in the genome that serve as genetic markers. • Restriction Fragment Length Polymorphism (RFLP) – Variation in DNA fragment lengths after enzyme digestion, used as a genetic marker. • Commonly used for linkage analysis in genetic disease studies and breeding programs. • 2. Physical Mapping • Provides a precise distance between genes in terms of base pairs (bp). • More accurate than genetic mapping as it determines the exact locations of genes on a chromosome. • Uses techniques such as: • Restriction Mapping – Uses restriction enzymes to cut DNA at specific sites, creating a physical map. • Fluorescence In Situ Hybridization (FISH) – Uses fluorescent probes to locate specific DNA sequences on chromosomes. • Whole Genome Sequencing – Determines the complete DNA sequence of an organism, providing the highest resolution map. • Restriction Fragment Length Polymorphism (RFLP) – Detects DNA fragment differences after restriction enzyme digestion, useful for identifying genetic variations. • Essential for gene cloning, genome sequencing, and comparative genomics.
  • 4.
    DIFFERENCE BETWEEN GM& PM Feature Genetic Mapping Physical Mapping Definition Determines the relative positions of genes or markers based on recombination frequencies. Determines the exact physical locations of genes or markers on a chromosome. Unit of Measurement Measured in centimorgans (cM), indicating genetic distance based on recombination frequency. Measured in base pairs (bp), representing the actual DNA sequence length. Approach Uses linkage analysis and recombination frequency. Uses molecular biology techniques like restriction mapping, FISH, and sequencing. Accuracy Less precise due to reliance on recombination events. More precise, providing an exact DNA sequence. Resolution Low resolution, giving an approximate order of genes. High resolution, mapping genes to exact nucleotide positions. Techniques Used Pedigree analysis, genetic linkage maps, and SNP mapping. Restriction enzyme digestion, fluorescence in situ hybridization (FISH), contig mapping, and whole- genome sequencing. Application Used in gene discovery, studying inheritance patterns, and genetic disorders. Used in genome sequencing projects, identifying mutations, and cloning genes. Genome Coverage Covers only regions of the genome that have genetic markers or known recombination events. Covers the entire genome, including non-coding and repetitive regions. Time Required Faster to generate as it relies on statistical data from recombination events. More time-consuming as it requires laboratory- based physical analysis of DNA. Use in Human Genome Project (HGP) Provided an initial framework for sequencing by identifying linkage groups. Used to assemble the final genome sequence with precise nucleotide positions. Limitations Recombination rates vary across different chromosomal regions, leading to inaccuracies. Requires extensive sequencing data and computational analysis.
  • 5.
    GENETIC MAPPING • Geneticmapping is a technique used to determine the relative positions of genes or genetic markers on a chromosome based on their inheritance patterns and recombination frequencies. It helps researchers understand the genetic architecture of organisms and locate genes associated with specific traits or diseases. • Unlike physical mapping, which determines the exact nucleotide sequence, genetic mapping is based on how frequently genes are inherited together and is measured in centiMorgans (cM)—a unit representing the probability of recombination.
  • 6.
    PRINCIPLE OF GENETICMAPPING The principle of genetic mapping is based on linkage analysis and recombination frequency, which determine the relative positions of genes on a chromosome. Genes that are closer together are inherited together more often, while genes that are far apart are more likely to be separated during meiotic recombination. • 1. Linkage and Recombination • Genes located on the same chromosome are linked and tend to be inherited together. • However, during meiosis, crossing over occurs, exchanging genetic material between homologous chromosomes. • The frequency of recombination between two genes increases with distance between them. • 2. Recombination Frequency as a Distance Measure • The probability of recombination between two genes is directly proportional to their physical distance. • It is measured in centiMorgans (cM), where 1 cM = 1% recombination frequency. • If two genes have a recombination frequency of 10%, they are said to be 10 cM apart. • 3. Marker-Based Mapping • DNA markers (such as SNPs, microsatellites, and RFLPs) help identify gene locations. • If a marker is always inherited with a disease, it suggests close linkage to the disease-causing gene. • 4. Mapping Functions • Statistical models (e.g., Haldane’s and Kosambi’s mapping functions) convert recombination frequencies into genetic distances. • These functions correct for multiple crossovers that may occur.
  • 7.
    CROSSING OVER • Crossingover is the exchange of genetic material between non- sister chromatids of homologous chromosomes during prophase I of meiosis. This process breaks linkages and creates new allele combinations, contributing to genetic diversity. LINKAGE • Linkage is the phenomenon where genes located on the same chromosome tend to be inherited together because they do not assort independently during meiosis. It was first observed by T.H. Morgan in 1910 through his studies on the fruit fly (Drosophila melanogaster).
  • 8.
    RECOMBINATION FREQUENCY • Recombinationfrequency is the percentage of recombinant offspring produced due to crossing over between two genes during meiosis. It helps measure the genetic distance between genes on a chromosome and is used to create linkage maps. • Map Distance (Genetic Distance) • The recombination frequency is directly related to the distance between two genes on a chromosome. • If genes are closer together, crossing over is rare → Low recombination frequency • If genes are far apart, crossing over is frequent → High recombination frequency • Used to construct linkage maps (genetic maps) that show gene positions. • Unit of Map Distance • 1% recombination frequency = 1 map unit (mu) or centimorgan (cM) • Example: If two genes have a recombination frequency of 12%, they are 12 cM apart on the genetic map
  • 9.
    Genetic Markers • Geneticmarkers are specific DNA sequences or variations that serve as identifiable landmarks on a chromosome. • They are used to track inheritance patterns, map genes, and study genetic diseases. • These markers can be genes or non-coding DNA sequences that show variations (polymorphisms) between individuals. Feature Gene 🧬 Genetic Marker️🏷️ Definition A segment of DNA that codes for a protein or functional RNA. A specific DNA sequence used as a reference point in genetic studies. Function Determines traits by coding for proteins or regulating biological processes. Helps track inheritance, locate genes, and study genetic variations. Presence Found throughout the genome, both coding and non-coding regions. Usually found in variable (polymorphic) regions of DNA. Examples BRCA1 (linked to breast cancer), Hemoglobin gene (HBB), Insulin gene. RFLP, SNPs, Microsatellites (SSRs), AFLP. Use in Research Studied to understand genetic diseases, evolution, and biological functions. Used in DNA fingerprinting, gene mapping, forensic science, and plant breeding.
  • 10.
    TYPES OF MARKERS •Types of Genetic Markers • Genetic markers can be broadly classified into three categories: • 1. Morphological Markers (Classical Markers) • Based on visible traits such as eye color, plant height, or seed shape. • Limitations: Subject to environmental influence and not always reliable for genetic studies. • 2. Biochemical Markers • Involve proteins or enzymes that show genetic variation. • Example: Isozymes – Different forms of enzymes encoded by different alleles. • 3. Molecular Markers (DNA Markers) 🔬 • Molecular markers are the most widely used because they provide precise genetic information. They are classified into: a) RFLP (Restriction Fragment Length Polymorphism) • Based on differences in DNA sequences detected by cutting DNA with restriction enzymes. • Used in genetic mapping and disease identification. b) SNP (Single Nucleotide Polymorphism) • Single base pair variations in DNA sequences. • Commonly used in genome-wide association studies (GWAS) to identify disease-related genes.
  • 11.
    RFLP-Restriction Fragment Length Polymorphism •RFLP (Restriction Fragment Length Polymorphism) is a molecular technique used to identify variations in DNA sequences by cutting DNA with restriction enzymes and analyzing the resulting fragment lengths. These variations are useful as genetic markers for gene mapping, disease diagnosis, and forensic analysis. • Steps in RFLP Analysis 1.DNA Extraction 2.Digestion with Restriction Enzymes 3.Gel Electrophoresis 4.Southern Blotting & Hybridization 5.Analysis of Band Patterns
  • 12.
    STEPS IN RFLP 1.DNA Extraction • Cells are lysed to release DNA. • Proteins and lipids are removed using enzymes and organic solvents. • DNA is precipitated using alcohol and stored in a buffer. 2. Digestion with Restriction Enzymes • DNA is incubated with a specific restriction enzyme at 37°C. • The enzyme recognizes and cuts palindromic sequences. • Digestion produces DNA fragments of varying lengths.
  • 13.
    3. Gel Electrophoresis •DNA fragments are loaded into an agarose gel. • An electric current is applied, causing DNA to migrate towards the positive electrode. • Smaller fragments move faster, separating DNA based on size. • The gel is stained, and bands are visualized under UV light. 4. Southern Blotting & Hybridization • DNA fragments are transferred from the gel to a nitrocellulose or nylon membrane. • DNA is denatured into single strands using an alkaline solution. • A labeled DNA probe complementary to the target sequence is added. • The probe binds to the target sequence, and unbound probes are washed off. • Detection is done using autoradiography or fluorescent imaging. 5. Analysis of Band Patterns • Band patterns of individuals are compared to detect genetic variations. • Differences in fragment sizes indicate the presence or absence of restriction sites. • Used for genotyping, disease detection, forensic analysis, and gene mapping.
  • 15.
    APPLICATION 1.Genetic Disease Diagnosis– Detects mutations linked to diseases like sickle cell anemia, cystic fibrosis, and Huntington’s disease. 2.Forensic Science – Used in DNA fingerprinting for criminal investigations, paternity testing, and identity verification. 3.Gene Mapping – Helps locate and map genes associated with hereditary traits and diseases. 4.Plant and Animal Breeding – Used in marker-assisted selection (MAS) to improve crop varieties and livestock genetics. 5.Evolutionary and Population Studies – Analyzes genetic diversity, evolutionary relationships, and species classification. 6.Personalized Medicine – Identifies genetic variations to tailor treatments for specific individuals.
  • 16.
    Advantages and Disadvantagesof RFLP • Advantages 1. High Accuracy – Provides precise identification of genetic variations. 2. Reliable and Reproducible – Produces consistent results when performed correctly. 3. Useful for Genetic Mapping – Helps determine the location of genes and genetic markers. 4. Can Analyze Any DNA Sample – Works on various sources like blood, tissues, and plants. 5. Detects Both Small and Large Mutations – Can identify single nucleotide changes, insertions, or deletions. • Disadvantages 1. Time-Consuming – Requires multiple steps like digestion, electrophoresis, blotting, and hybridization. 2. Labor-Intensive – Involves complex procedures and requires skilled personnel. 3. Requires Large DNA Samples – Not suitable for degraded or low-quality DNA. 4. Expensive – Needs restriction enzymes, probes, and specialized equipment. 5. Limited Sensitivity – Cannot detect very small genetic variations as efficiently as modern techniques. 6. Largely Replaced by PCR-Based Methods – Faster techniques like SNP analysis, STR analysis, and AFLP are now preferred.
  • 17.
    SNP(Single Nucleotide Polymorphism) •SNP stands for Single Nucleotide Polymorphism. It is a type of genetic variation that occurs when a single nucleotide (A, T, C, or G) in the DNA sequence is altered at a specific position in the genome. These variations are common in the population and can be found throughout the genome, both in coding (gene) and non-coding regions.
  • 18.
    DETECTION OF SNP •1. Hybridization-Based SNP Detection • Steps: • Design a probe (short DNA or RNA sequence) complementary to the target SNP. • A probe (a short, single-stranded DNA or RNA sequence) complementary to the target SNP site is designed. •The sample DNA is denatured (separated into single strands) and allowed to hybridize with the probe. •If the target sequence perfectly matches the probe, strong hybridization occurs. If there is an SNP mismatch, hybridization may be weaker or absent. •Differences in hybridization strength are detected using fluorescence, radioactive labeling, or changes in electrical signals.
  • 19.
    DNA Microarray • Microarraysare solid surfaces (such as glass slides or silicon chips) containing thousands of immobilized probes that hybridize with DNA samples to detect SNPs at multiple loci simultaneously. • The sample DNA is fragmented, labeled with a fluorescent dye, and hybridized to the chip. • A scanner detects fluorescence intensity, indicating which probes have hybridized with the sample DNA.
  • 20.
    Solution hybridization 1. Preparationof Microtiter Tray Wells  A microtiter tray is prepared, with each well containing a different oligonucleotide probe specific to a target SNP. • Labeling of Probes  Each oligonucleotide is labeled at one end with a fluorescent dye and at the other end with a quenching compound.  In the unhybridized state, the oligonucleotide’s ends base-pair, keeping the quencher close to the dye, preventing fluorescence. 2. Denaturation of Sample DNA  The test DNA sample is denatured (heated to separate strands), allowing it to hybridize with complementary probes.
  • 21.
    3. Hybridization Process The single-stranded test DNA is added to the wells and incubated under controlled conditions.  If the test DNA matches the probe sequence, it hybridizes with the oligonucleotide probe, disrupting the internal base pairing of the probe.  This separation moves the quencher away from the fluorescent dye. 4. Detection of Fluorescence  A fluorescence detector measures the signal in each well.  Wells where hybridization occurs show increased fluorescence, indicating the presence of a specific SNP. 5. Data Analysis  The fluorescence intensity is analyzed to determine which SNP variant is present in the sample.  Results can be used for genotyping, disease association studies, or personalized medicine applications.
  • 22.
    Advantages of SNP •Advantages of SNPs 1. High Stability – SNPs are more stable than other genetic variations, such as insertions or deletions, making them ideal for genetic studies. 2. Abundant in the Genome – SNPs occur frequently (about every 300 nucleotides in the human genome), providing a vast number of markers for analysis. 3. Useful in Disease Association Studies – SNPs help identify genetic risk factors for diseases like cancer, diabetes, and cardiovascular conditions. 4. Key in Pharmacogenomics – SNPs influence how individuals respond to drugs, enabling personalized medicine. 5. Efficient for Genetic Mapping – SNPs serve as excellent genetic markers for linkage and association studies. 6. Facilitates Ancestry and Evolutionary Studies – SNP analysis helps trace evolutionary relationships and ancestry across populations. 7. Cost-Effective for Genotyping – SNP genotyping methods, such as microarrays and sequencing, are relatively affordable and scalable for large studies.
  • 23.
    Disadvantages of SNP •1. Limited Impact on Function – Many SNPs occur in non-coding regions and may not have a significant biological effect. • 2. Single Base Change May Not Be Significant – Unlike structural variations, a single nucleotide change often has a minor effect on gene function. • 3. Not Always Indicative of Disease – The presence of an SNP does not necessarily mean it causes a disease; it may only be a marker. • 4. Complex Interpretation – Some SNPs have weak associations with traits, making interpretation challenging in genetic studies. • 5. Ethnic Variability – SNP frequencies differ among populations, limiting their generalizability in genetic research. • 6. Requires Advanced Detection Methods – SNP analysis relies on specialized techniques like microarrays, sequencing, or PCR, requiring expertise and equipment.
  • 24.