What is chromosomal
mapping?
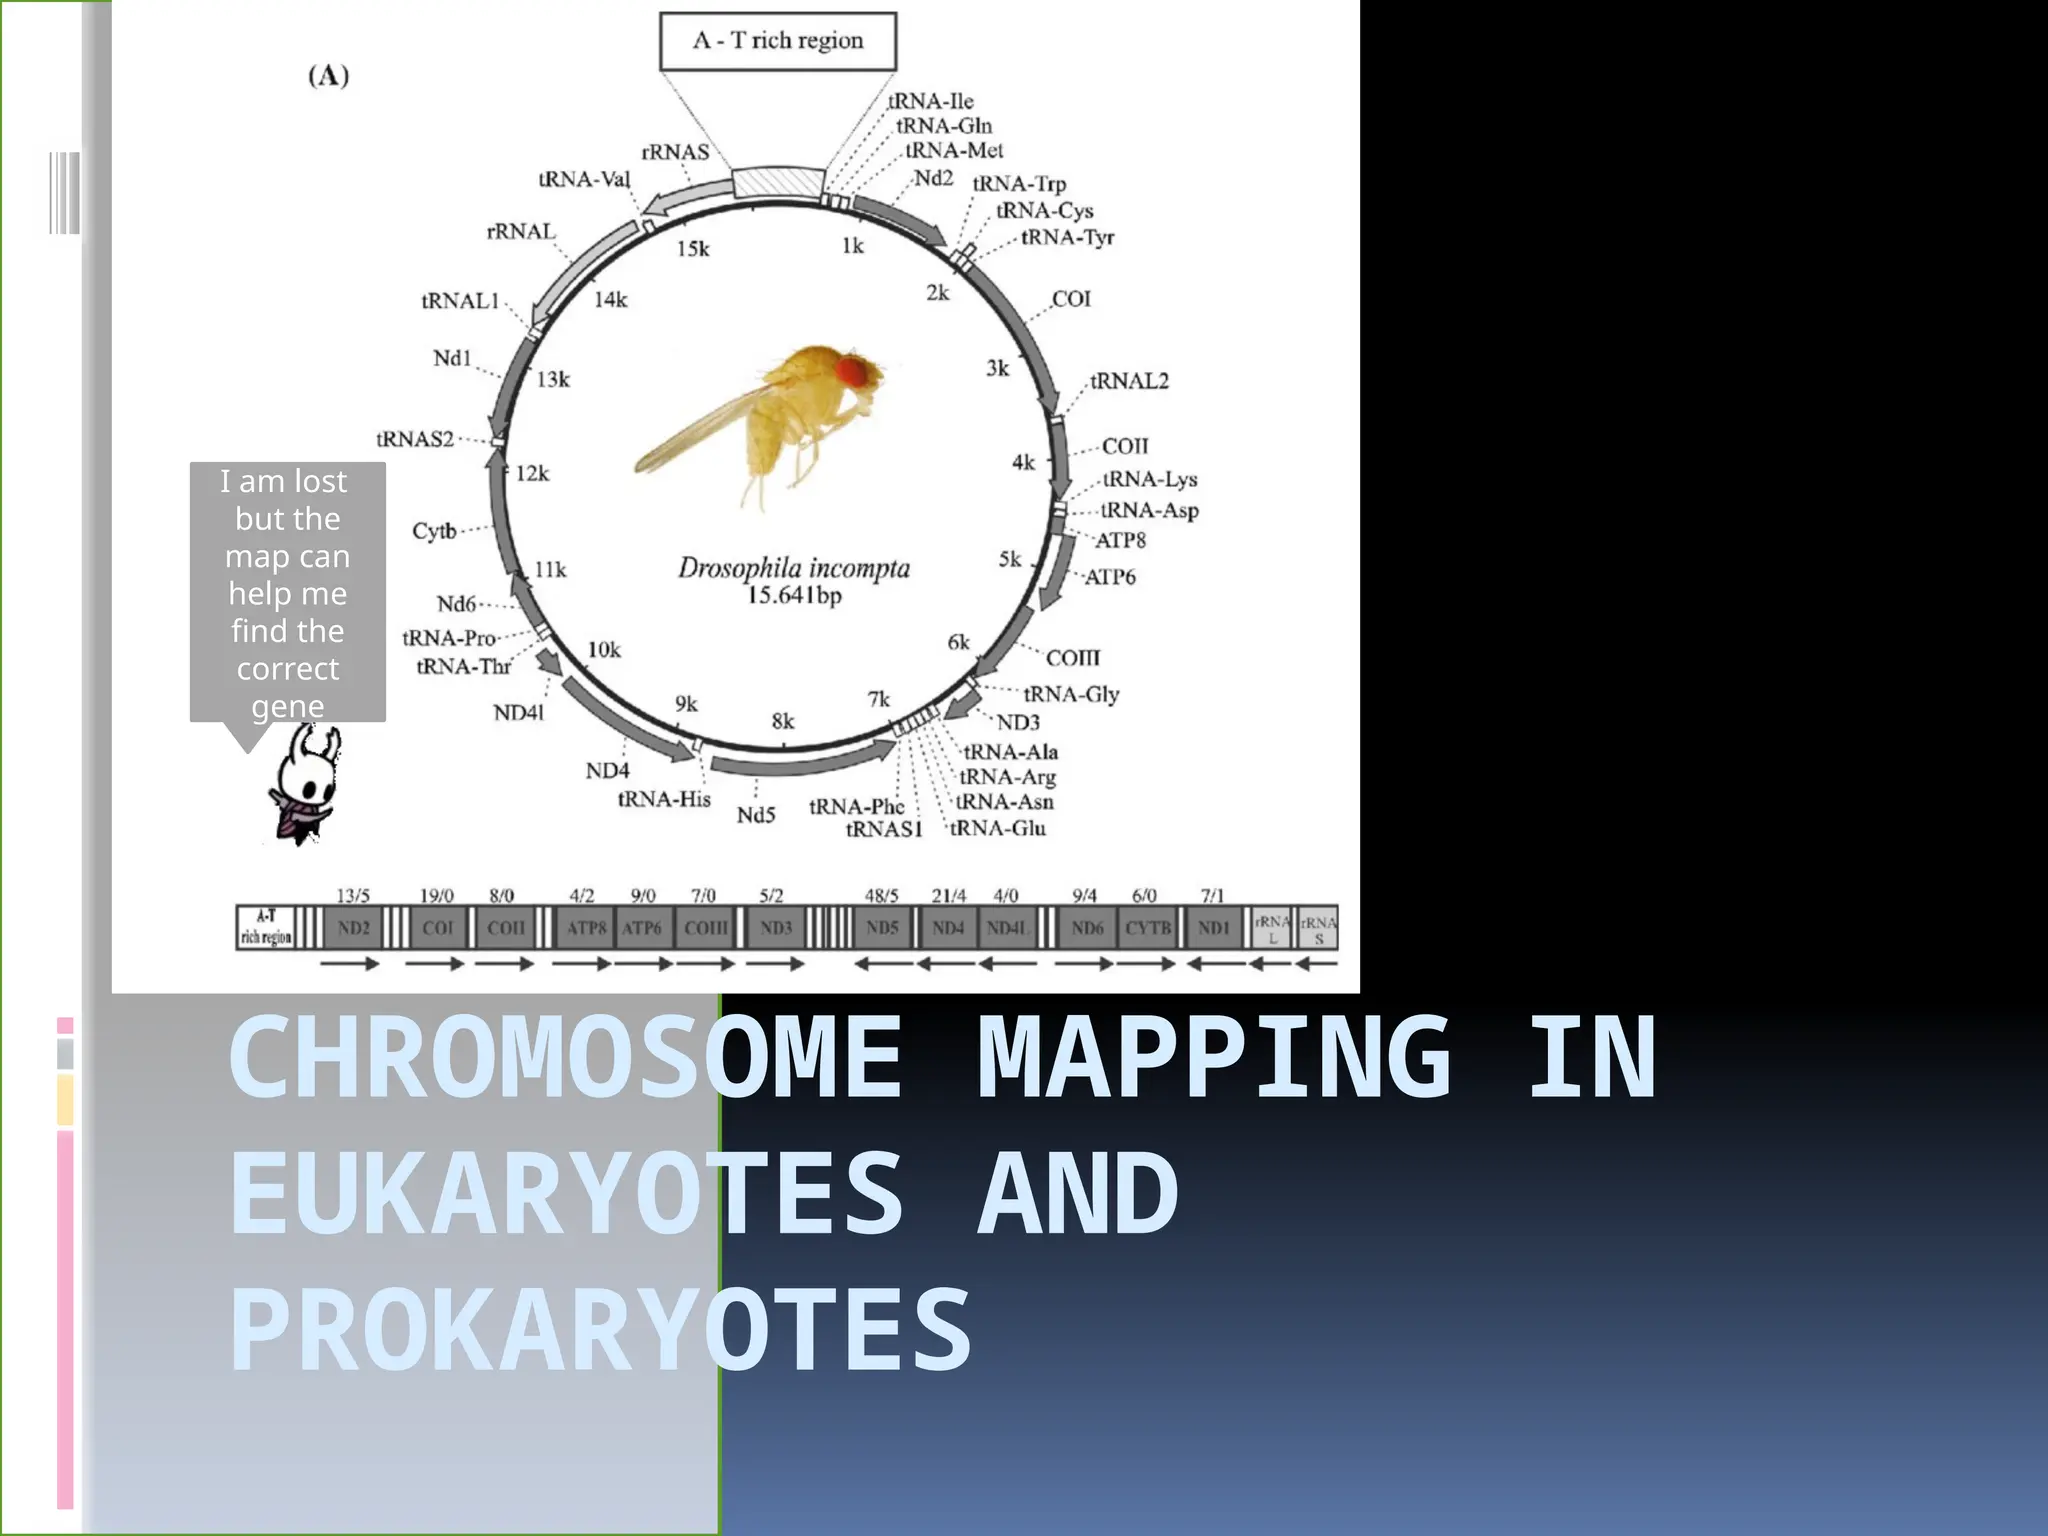
A chromosome is a thread like structure present in the
nucleus of a cell which is made of DNA and proteins
and has a heritable property
It is the method by which locations of genes in a
chromosome can be identified and a map genes are
produced
The genes are designated to specific locations called loci
It gives away the location(locus) of gene along with the
distance between genes
These gene maps are necessary as they provide crucial
information on structure ,function and location of genes
They provide a guide for sequencing experiments by
showing positions of genes and other notable features
It can be used to build family trees
3.
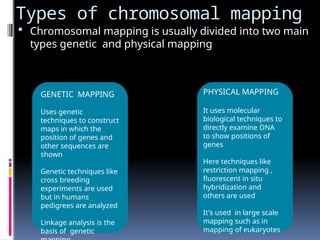
Types of chromosomalmapping
Chromosomal mapping is usually divided into two main
types genetic and physical mapping
GENETIC MAPPING
Uses genetic
techniques to construct
maps in which the
position of genes and
other sequences are
shown
Genetic techniques like
cross breeding
experiments are used
but in humans
pedigrees are analyzed
Linkage analysis is the
basis of genetic
PHYSICAL MAPPING
It uses molecular
biological techniques to
directly examine DNA
to show positions of
genes
Here techniques like
restriction mapping ,
fluorescent in situ
hybridization and
others are used
It's used in large scale
mapping such as in
mapping of eukaryotes
5.
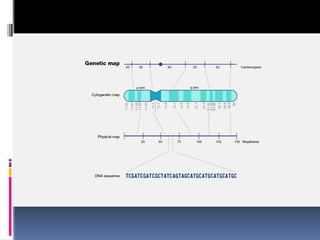
Genetic mapping
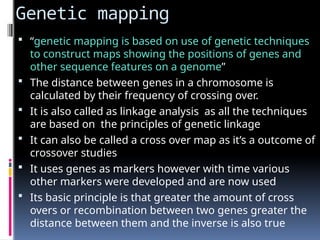
“geneticmapping is based on use of genetic techniques
to construct maps showing the positions of genes and
other sequence features on a genome”
The distance between genes in a chromosome is
calculated by their frequency of crossing over.
It is also called as linkage analysis as all the techniques
are based on the principles of genetic linkage
It can also be called a cross over map as it’s a outcome of
crossover studies
It uses genes as markers however with time various
other markers were developed and are now used
Its basic principle is that greater the amount of cross
overs or recombination between two genes greater the
distance between them and the inverse is also true
6.
Construction of agenetic or
linkage map
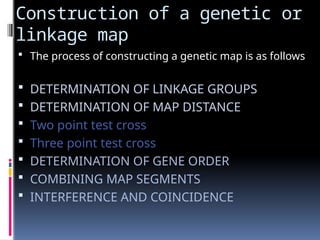
The process of constructing a genetic map is as follows
DETERMINATION OF LINKAGE GROUPS
DETERMINATION OF MAP DISTANCE
Two point test cross
Three point test cross
DETERMINATION OF GENE ORDER
COMBINING MAP SEGMENTS
INTERFERENCE AND COINCIDENCE
7.
DETERMINATION OF LINKAGE
GROUPS
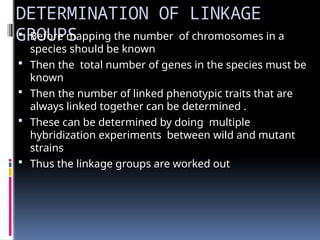
Before mapping the number of chromosomes in a
species should be known
Then the total number of genes in the species must be
known
Then the number of linked phenotypic traits that are
always linked together can be determined .
These can be determined by doing multiple
hybridization experiments between wild and mutant
strains
Thus the linkage groups are worked out
8.
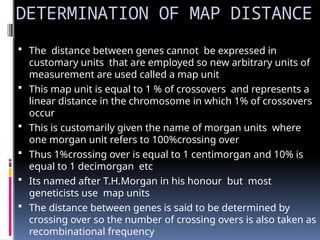
DETERMINATION OF MAPDISTANCE
The distance between genes cannot be expressed in
customary units that are employed so new arbitrary units of
measurement are used called a map unit
This map unit is equal to 1 % of crossovers and represents a
linear distance in the chromosome in which 1% of crossovers
occur
This is customarily given the name of morgan units where
one morgan unit refers to 100%crossing over
Thus 1%crossing over is equal to 1 centimorgan and 10% is
equal to 1 decimorgan etc
Its named after T.H.Morgan in his honour but most
geneticists use map units
The distance between genes is said to be determined by
crossing over so the number of crossing overs is also taken as
recombinational frequency
9.
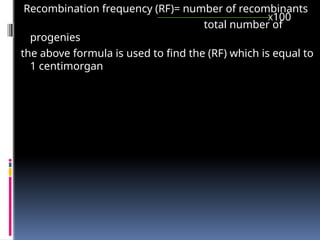
Recombination frequency (RF)=number of recombinants
total number of
progenies
the above formula is used to find the (RF) which is equal to
1 centimorgan
X100
10.
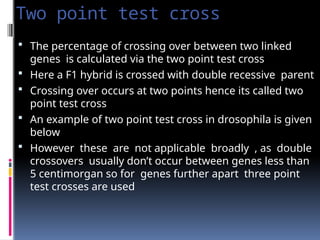
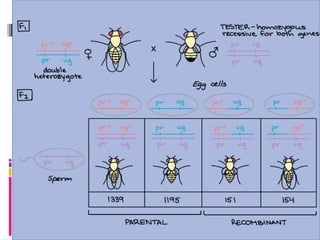
Two point testcross
The percentage of crossing over between two linked
genes is calculated via the two point test cross
Here a F1 hybrid is crossed with double recessive parent
Crossing over occurs at two points hence its called two
point test cross
An example of two point test cross in drosophila is given
below
However these are not applicable broadly , as double
crossovers usually don’t occur between genes less than
5 centimorgan so for genes further apart three point
test crosses are used
12.
Three point testcross
These gives us information about the relative distance
between genes and the order that genes are arranged
on the chromosomes
It can be done if three points or loci on a chromosome
pair can be identified by marker genes
To find distance between the 2 genes such as a and b
the alleles are identified and the number of offsprings
that are present are noted and the RF is calculated by
the formula
Without the middle marker the double crossovers occur
along with the parental phenotypes and are not taken
and the crossovers with the middle marker are also not
taken
14.
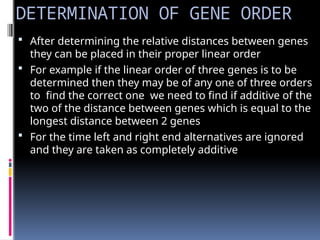
DETERMINATION OF GENEORDER
After determining the relative distances between genes
they can be placed in their proper linear order
For example if the linear order of three genes is to be
determined then they may be of any one of three orders
to find the correct one we need to find if additive of the
two of the distance between genes which is equal to the
longest distance between 2 genes
For the time left and right end alternatives are ignored
and they are taken as completely additive
15.
B 12
A
B 12
A
A5
C
A 5
C
A 5
C
B 7
C
B 7
C
C 7
B
B 12
A
CASE A
CASE B
CASE C
16.
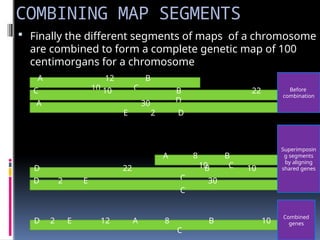
COMBINING MAP SEGMENTS
Finally the different segments of maps of a chromosome
are combined to form a complete genetic map of 100
centimorgans for a chromosome
A 12 B
10 C
C 10 B 22
D
A 30
E 2 D
D 22 B 10
C
D 2 E 30
C
D 2 E 12 A 8 B 10
C
A 8 B
10 C
Before
combination
Superimposin
g segments
by aligning
shared genes
Combined
genes
17.
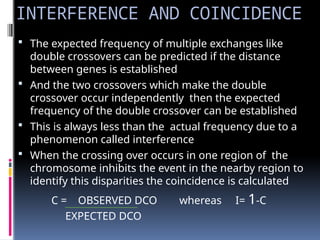
INTERFERENCE AND COINCIDENCE
The expected frequency of multiple exchanges like
double crossovers can be predicted if the distance
between genes is established
And the two crossovers which make the double
crossover occur independently then the expected
frequency of the double crossover can be established
This is always less than the actual frequency due to a
phenomenon called interference
When the crossing over occurs in one region of the
chromosome inhibits the event in the nearby region to
identify this disparities the coincidence is calculated
C = OBSERVED DCO whereas I= 1-C
EXPECTED DCO
18.
If theinterference is complete then there is no
occurrence of double crossovers
If fewer double crossovers occur then Interference is
positive and is called positive interference
Whereas if more double crossovers occur then
interference is negative and is called negative inference
Interferences may occur due to closely occurring
chiasmata where occurrence of one prevents the
occurrence of another in an immediately adjacent
distance, this may be due to the inability of chromatids
to bend back on themselves within certain minimum
distances as ,interference decreases as genes are located
farther apart
19.
Molecular markers
genemapping was limited in most organisms by the
availability of genetic markers .one of the first used markers
included genes
As in the early days variable genes with easily observable
phenotypes for which inheritance could be studied.
These genes that encode easily observable characteristics
such as flower color, seed shape, blood types, and biochemical
differences.
New molecular techniques made it possible to examine
variations in DNA sequences themselves .
An near unlimited amount of these molecular markers are
present and can be used for creating genetic maps and
studying linkage relations.
Genes are useful markers but are not ideal in especially with
larger genomes such as those of generally eukaryotes as a
map based entirely on genes is not very detailed.
20.
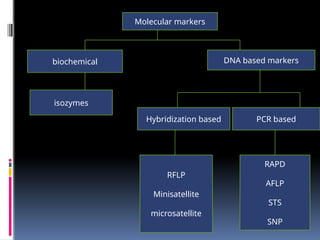
Molecular markers
biochemical DNAbased markers
isozymes
Hybridization based PCR based
RFLP
Minisatellite
microsatellite
RAPD
AFLP
STS
SNP
21.
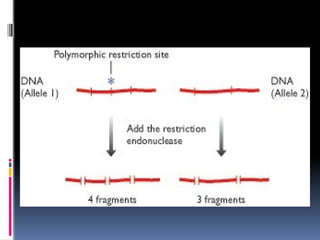
Hybridization based markers
restriction enzymes cut DNA molecules at specific
recognition sequences. This would means that treatment of
a DNA molecule with a restriction enzyme (a restriction
endonuclease like EcoRI)should always produce the same set
of fragments.
but this is not the case all the time in case of genomic DNA
due to the fact alleles have different sequences and thus
variations in locations of the recognition sequences .
Thus leads to sequences where two fragments are joined
together leading to length polymorphisms
This is an RFLP and its position on a genome map can be
worked out by following the inheritance of alleles, just as is
done when genes are used as markers.
There are thought to be about 105
RFLPs in the human
genome, but of course for each RFLP there can only be two
alleles (with and without the site).
23.
Scoring an RFLP
In order to score an RFLP it is necessary to determine the
size of just one or two individual restriction fragments
against a background of many irrelevant fragments.
an enzyme such as EcoRI, with a 6-bp recognition
sequence, should cut approximately once every 4096 bp
and so would give almost 800 000 fragments when used
with human DNA
After separation by agarose gel electrophoresis these
800 000 fragments produce a smear and the RFLP
cannot be distinguished.
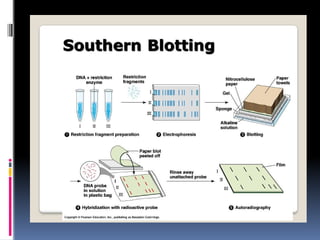
The fragments are transferred to a nitrocellulose
membrane by southern blotting
But using a radioactive probe that can bind with the
restriction fragments can help distinguish the sites by
autoradiography
25.
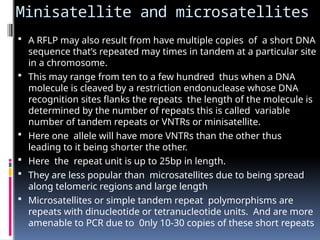
Minisatellite and microsatellites
A RFLP may also result from have multiple copies of a short DNA
sequence that’s repeated may times in tandem at a particular site
in a chromosome.
This may range from ten to a few hundred thus when a DNA
molecule is cleaved by a restriction endonuclease whose DNA
recognition sites flanks the repeats the length of the molecule is
determined by the number of repeats this is called variable
number of tandem repeats or VNTRs or minisatellite.
Here one allele will have more VNTRs than the other thus
leading to it being shorter the other.
Here the repeat unit is up to 25bp in length.
They are less popular than microsatellites due to being spread
along telomeric regions and large length
Microsatellites or simple tandem repeat polymorphisms are
repeats with dinucleotide or tetranucleotide units. And are more
amenable to PCR due to 0nly 10-30 copies of these short repeats
26.
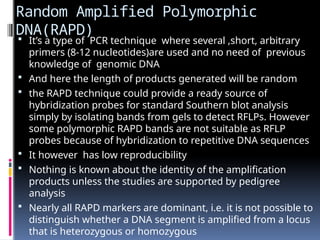
Random Amplified Polymorphic
DNA(RAPD)
It’s a type of PCR technique where several ,short, arbitrary
primers (8-12 nucleotides)are used and no need of previous
knowledge of genomic DNA
And here the length of products generated will be random
the RAPD technique could provide a ready source of
hybridization probes for standard Southern blot analysis
simply by isolating bands from gels to detect RFLPs. However
some polymorphic RAPD bands are not suitable as RFLP
probes because of hybridization to repetitive DNA sequences
It however has low reproducibility
Nothing is known about the identity of the amplification
products unless the studies are supported by pedigree
analysis
Nearly all RAPD markers are dominant, i.e. it is not possible to
distinguish whether a DNA segment is amplified from a locus
that is heterozygous or homozygous
28.
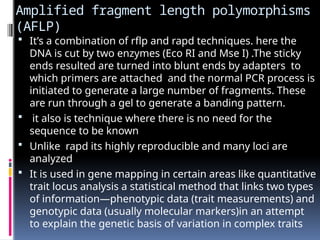
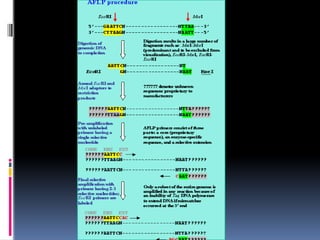
Amplified fragment lengthpolymorphisms
(AFLP)
It’s a combination of rflp and rapd techniques. here the
DNA is cut by two enzymes (Eco RI and Mse I) .The sticky
ends resulted are turned into blunt ends by adapters to
which primers are attached and the normal PCR process is
initiated to generate a large number of fragments. These
are run through a gel to generate a banding pattern.
it also is technique where there is no need for the
sequence to be known
Unlike rapd its highly reproducible and many loci are
analyzed
It is used in gene mapping in certain areas like quantitative
trait locus analysis a statistical method that links two types
of information—phenotypic data (trait measurements) and
genotypic data (usually molecular markers)in an attempt
to explain the genetic basis of variation in complex traits
30.
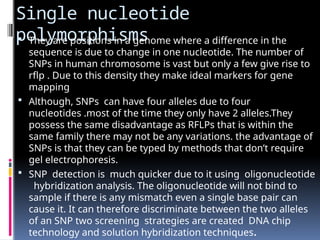
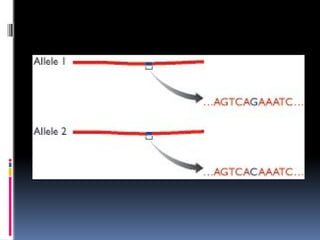
Single nucleotide
polymorphisms
Theyare positions in a genome where a difference in the
sequence is due to change in one nucleotide. The number of
SNPs in human chromosome is vast but only a few give rise to
rflp . Due to this density they make ideal markers for gene
mapping
Although, SNPs can have four alleles due to four
nucleotides .most of the time they only have 2 alleles.They
possess the same disadvantage as RFLPs that is within the
same family there may not be any variations. the advantage of
SNPs is that they can be typed by methods that don’t require
gel electrophoresis.
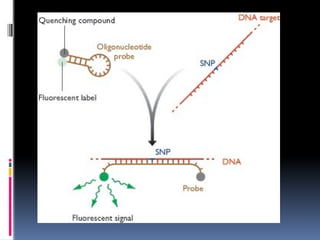
SNP detection is much quicker due to it using oligonucleotide
hybridization analysis. The oligonucleotide will not bind to
sample if there is any mismatch even a single base pair can
cause it. It can therefore discriminate between the two alleles
of an SNP two screening strategies are created DNA chip
technology and solution hybridization techniques.
32.
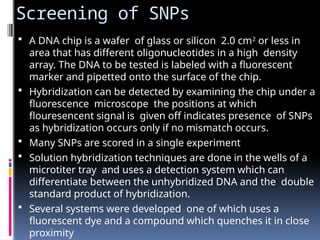
Screening of SNPs
A DNA chip is a wafer of glass or silicon 2.0 cm2
or less in
area that has different oligonucleotides in a high density
array. The DNA to be tested is labeled with a fluorescent
marker and pipetted onto the surface of the chip.
Hybridization can be detected by examining the chip under a
fluorescence microscope the positions at which
flouresencent signal is given off indicates presence of SNPs
as hybridization occurs only if no mismatch occurs.
Many SNPs are scored in a single experiment
Solution hybridization techniques are done in the wells of a
microtiter tray and uses a detection system which can
differentiate between the unhybridized DNA and the double
standard product of hybridization.
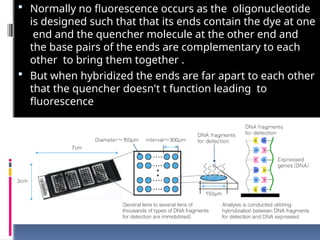
Several systems were developed one of which uses a
fluorescent dye and a compound which quenches it in close
proximity
33.
Normally nofluorescence occurs as the oligonucleotide
is designed such that that its ends contain the dye at one
end and the quencher molecule at the other end and
the base pairs of the ends are complementary to each
other to bring them together .
But when hybridized the ends are far apart to each other
that the quencher doesn't t function leading to
fluorescence
35.
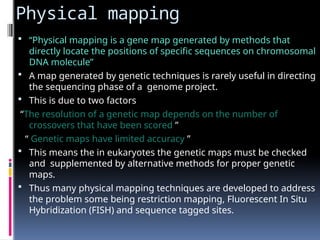
Physical mapping
“Physicalmapping is a gene map generated by methods that
directly locate the positions of specific sequences on chromosomal
DNA molecule”
A map generated by genetic techniques is rarely useful in directing
the sequencing phase of a genome project.
This is due to two factors
“The resolution of a genetic map depends on the number of
crossovers that have been scored ”
“ Genetic maps have limited accuracy ”
This means the in eukaryotes the genetic maps must be checked
and supplemented by alternative methods for proper genetic
maps.
Thus many physical mapping techniques are developed to address
the problem some being restriction mapping, Fluorescent In Situ
Hybridization (FISH) and sequence tagged sites.
36.
Restriction mapping
Itis a method that’s similar to rflp while rflp uses polymorphic
sites to map DNA the major issue of it is that there is very few sites
in the chromosome are polymorphic. This can be improved upon
by using two restriction enzymes.
The sequence is first digested by one type of restriction enzyme
then the original sequence is then digested by another restriction
enzyme the fragments are run on gel. This only helps to identify
the recognition sites of the restriction enzymes. By digesting the
DNA by both the enzymes then the resulting fragments can be
arranged by comparing them to fragments acquired by previous
single digestions.
Any ambiguity in positions of the double digested fragments can
be resolved by partially digesting the original fragment this results
in complex sequences of DNA which can be compared with the
double digested sequences to give the correct order of the
fragments and a restriction map. if many restriction sites are
present they can be narrowed by adding radioactive markers to
ends of the DNA molecule.
38.
These mapsare easy to generate relatively few cut sites for
the enzymes being used. If the number of cut sites increases
so does the single, double and partial restriction fragments
which must be analyzed to determine the arrangement even
though it can be managed by using computers there can be a
stage where the numerous fragments present can cause
bands to merge and if multiple fragments are of the same
size then it can result in mistakes.
it is therefore useful to small than large molecules. the
upper limit depending on the frequency of the restriction
sites of sequence. At about 50 kb.
These limitations can be eased slightly by choosing enzymes
with infrequent cut sites like Enzymes with seven- or eight-
nucleotide recognition sequences (e.g Sap I )and Enzymes
whose recognition sequences contain motifs that are rare in
the target DNA(Sma I) but the whole genome of eukaryotes
cant be mapped but the genomes of prokaryotes or that of
eukaryotes like yeast . And another type of gel techniques like
orthogonal field alternation gel electrophoresis (OFAGE)
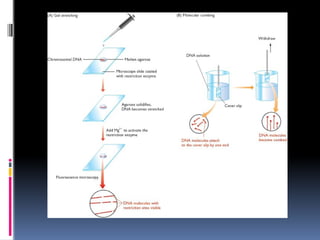
40.
With thetechnique called optical mapping restriction sites are
directly located by looking at the cut DNA molecules with a
microscope .The DNA must first be attached to a glass slide in
such a way that the individual molecules become stretched out,
rather than clumped together in a mass. Its done in two methods
In gel stretching the chromosomal dna is suspended in gel and
placed on slide .This cools and solidifies DNA is extended.
the microscope slide onto which the molten agarose is placed is
first coated with a restriction enzyme. Its inactive for now , Once
the gel has solidified it is washed with a solution containing
magnesium chloride, which activates the enzymes.
Fluorescent dye is added, such as DAPI(4,6-diamino-2-
phenylindole dihydrochloride), which stains the DNA so that the
fibers can be seen when the slide is examined with a high-power
fluorescence microscope.
The restriction sites in the extended molecules gradually become
gaps as the degree of fiber extension is reduced by the natural
springiness of the DNA, enabling the relative positions of the cuts
to be recorded.
41.
In molecularcombing the DNA fibers are prepared by
dipping a silicone-coated cover slip into a solution of
DNA, leaving it for 5 minutes
The dna molecules attach to the cover slip by their ends
and then removing the slip at a constant speed of 0.3
mm/s.
The force required to pull the DNA molecules through
the meniscus causes them to line up. Once in the air, the
surface of the cover slip dries, retaining the DNA
molecules as an array of parallel fibers
43.
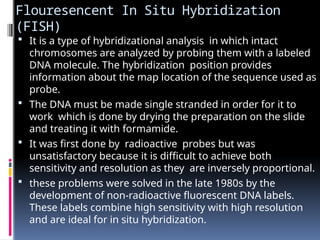
Flouresencent In SituHybridization
(FISH)
It is a type of hybridizational analysis in which intact
chromosomes are analyzed by probing them with a labeled
DNA molecule. The hybridization position provides
information about the map location of the sequence used as
probe.
The DNA must be made single stranded in order for it to
work which is done by drying the preparation on the slide
and treating it with formamide.
It was first done by radioactive probes but was
unsatisfactory because it is difficult to achieve both
sensitivity and resolution as they are inversely proportional.
these problems were solved in the late 1980s by the
development of non-radioactive fluorescent DNA labels.
These labels combine high sensitivity with high resolution
and are ideal for in situ hybridization.
44.
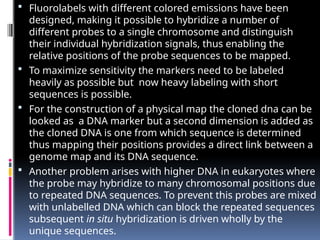
Fluorolabels withdifferent colored emissions have been
designed, making it possible to hybridize a number of
different probes to a single chromosome and distinguish
their individual hybridization signals, thus enabling the
relative positions of the probe sequences to be mapped.
To maximize sensitivity the markers need to be labeled
heavily as possible but now heavy labeling with short
sequences is possible.
For the construction of a physical map the cloned dna can be
looked as a DNA marker but a second dimension is added as
the cloned DNA is one from which sequence is determined
thus mapping their positions provides a direct link between a
genome map and its DNA sequence.
Another problem arises with higher DNA in eukaryotes where
the probe may hybridize to many chromosomal positions due
to repeated DNA sequences. To prevent this probes are mixed
with unlabelled DNA which can block the repeated sequences
subsequent in situ hybridization is driven wholly by the
unique sequences.
45.
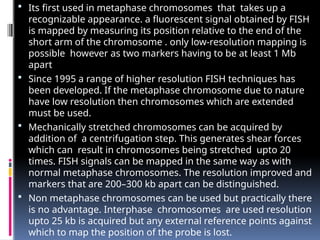
Its firstused in metaphase chromosomes that takes up a
recognizable appearance. a fluorescent signal obtained by FISH
is mapped by measuring its position relative to the end of the
short arm of the chromosome . only low-resolution mapping is
possible however as two markers having to be at least 1 Mb
apart
Since 1995 a range of higher resolution FISH techniques has
been developed. If the metaphase chromosome due to nature
have low resolution then chromosomes which are extended
must be used.
Mechanically stretched chromosomes can be acquired by
addition of a centrifugation step. This generates shear forces
which can result in chromosomes being stretched upto 20
times. FISH signals can be mapped in the same way as with
normal metaphase chromosomes. The resolution improved and
markers that are 200–300 kb apart can be distinguished.
Non metaphase chromosomes can be used but practically there
is no advantage. Interphase chromosomes are used resolution
upto 25 kb is acquired but any external reference points against
which to map the position of the probe is lost.
46.
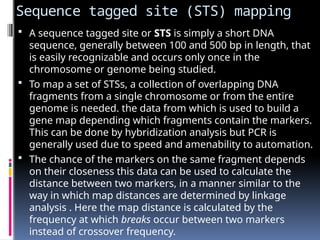
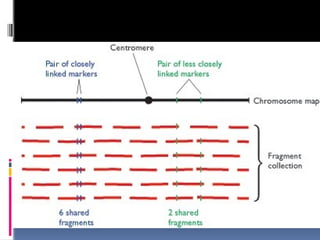
Sequence tagged site(STS) mapping
A sequence tagged site or STS is simply a short DNA
sequence, generally between 100 and 500 bp in length, that
is easily recognizable and occurs only once in the
chromosome or genome being studied.
To map a set of STSs, a collection of overlapping DNA
fragments from a single chromosome or from the entire
genome is needed. the data from which is used to build a
gene map depending which fragments contain the markers.
This can be done by hybridization analysis but PCR is
generally used due to speed and amenability to automation.
The chance of the markers on the same fragment depends
on their closeness this data can be used to calculate the
distance between two markers, in a manner similar to the
way in which map distances are determined by linkage
analysis . Here the map distance is calculated by the
frequency at which breaks occur between two markers
instead of crossover frequency.
48.
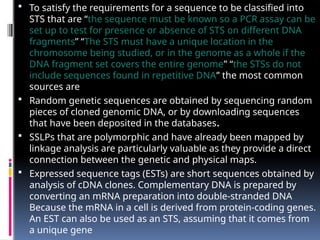
To satisfythe requirements for a sequence to be classified into
STS that are “the sequence must be known so a PCR assay can be
set up to test for presence or absence of STS on different DNA
fragments” “The STS must have a unique location in the
chromosome being studied, or in the genome as a whole if the
DNA fragment set covers the entire genome” “the STSs do not
include sequences found in repetitive DNA” the most common
sources are
Random genetic sequences are obtained by sequencing random
pieces of cloned genomic DNA, or by downloading sequences
that have been deposited in the databases.
SSLPs that are polymorphic and have already been mapped by
linkage analysis are particularly valuable as they provide a direct
connection between the genetic and physical maps.
Expressed sequence tags (ESTs) are short sequences obtained by
analysis of cDNA clones. Complementary DNA is prepared by
converting an mRNA preparation into double-stranded DNA
Because the mRNA in a cell is derived from protein-coding genes.
An EST can also be used as an STS, assuming that it comes from
a unique gene
49.
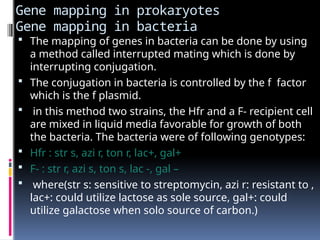
Gene mapping inprokaryotes
Gene mapping in bacteria
The mapping of genes in bacteria can be done by using
a method called interrupted mating which is done by
interrupting conjugation.
The conjugation in bacteria is controlled by the f factor
which is the f plasmid.
in this method two strains, the Hfr and a F- recipient cell
are mixed in liquid media favorable for growth of both
the bacteria. The bacteria were of following genotypes:
Hfr : str s, azi r, ton r, lac+, gal+
F- : str r, azi s, ton s, lac -, gal –
where(str s: sensitive to streptomycin, azi r: resistant to ,
lac+: could utilize lactose as sole source, gal+: could
utilize galactose when solo source of carbon.)
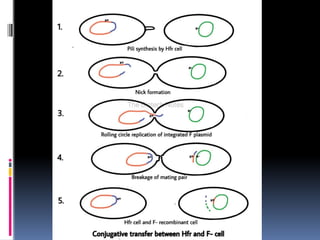
51.
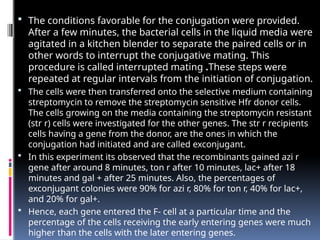
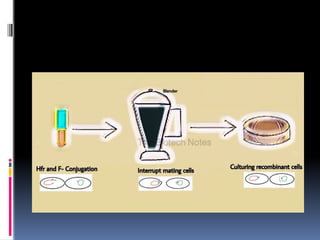
The conditionsfavorable for the conjugation were provided.
After a few minutes, the bacterial cells in the liquid media were
agitated in a kitchen blender to separate the paired cells or in
other words to interrupt the conjugative mating. This
procedure is called interrupted mating .These steps were
repeated at regular intervals from the initiation of conjugation.
The cells were then transferred onto the selective medium containing
streptomycin to remove the streptomycin sensitive Hfr donor cells.
The cells growing on the media containing the streptomycin resistant
(str r) cells were investigated for the other genes. The str r recipients
cells having a gene from the donor, are the ones in which the
conjugation had initiated and are called exconjugant.
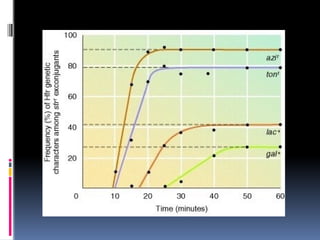
In this experiment its observed that the recombinants gained azi r
gene after around 8 minutes, ton r after 10 minutes, lac+ after 18
minutes and gal + after 25 minutes. Also, the percentages of
exconjugant colonies were 90% for azi r, 80% for ton r, 40% for lac+,
and 20% for gal+.
Hence, each gene entered the F- cell at a particular time and the
percentage of the cells receiving the early entering genes were much
higher than the cells with the later entering genes.
53.
These observationsled to the conclusions that:
The transfer of the Hfr initiated at a particular point,
hence each gene was transferred at a particular time
after the initiation of the conjugation. This point of
initiation is termed as origin of transfer.
The transfer of the genes took place in a linear manner
hence the later genes were transferred to a smaller
number of bacterial cells compared to the initial genes
as the mating pairs were separated during the transfer
process.
These experiments made it clear that such experiments
could be used to predict the order of the genes in the
bacterial chromosome (early to late entering genes).
Hence, a bacterial chromosome map can be prepared
and the distance between the genes can be measured in
terms of the time in minutes of the chromosome
transfer.
55.
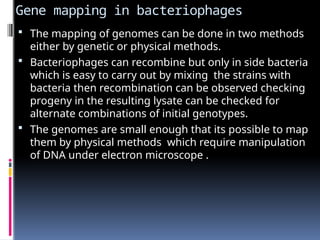
Gene mapping inbacteriophages
The mapping of genomes can be done in two methods
either by genetic or physical methods.
Bacteriophages can recombine but only in side bacteria
which is easy to carry out by mixing the strains with
bacteria then recombination can be observed checking
progeny in the resulting lysate can be checked for
alternate combinations of initial genotypes.
The genomes are small enough that its possible to map
them by physical methods which require manipulation
of DNA under electron microscope .
56.
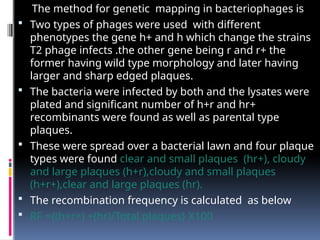
The method forgenetic mapping in bacteriophages is
Two types of phages were used with different
phenotypes the gene h+ and h which change the strains
T2 phage infects .the other gene being r and r+ the
former having wild type morphology and later having
larger and sharp edged plaques.
The bacteria were infected by both and the lysates were
plated and significant number of h+r and hr+
recombinants were found as well as parental type
plaques.
These were spread over a bacterial lawn and four plaque
types were found clear and small plaques (hr+), cloudy
and large plaques (h+r),cloudy and small plaques
(h+r+),clear and large plaques (hr).
The recombination frequency is calculated as below
RF ={(h+r+) +(hr)/Total plaques} X100
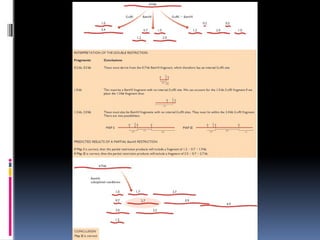
58.
The methodfor genetic mapping in bacteriophages is
Restriction mapping here can be done by using two
different enzymes like Eco R1 and Bam H1 the molecule is
digested by both enzymes separately and then they are
scored separately .this gives clear picture about restriction
sites .
The DNA is cut with both enzymes at once and they are
compared to the singly digested fragments and are
arranged in order .ambiguities can arise this is solved by
doing partial restriction by one of the enzymes .this results
in multiple complex fragments and they can be used for
further analysis to find the gene order
Its rapid easy and gives detailed information
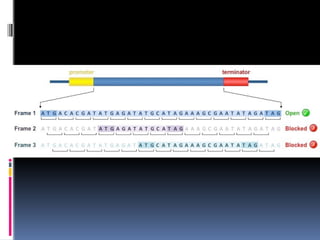
The gene location can also be located by a ORF scan (open
reading frame) due to the small size of genomes .
ORF begins with ATG and ends with the termination codon
either TAA ,TAG ,TGA thus searching for sequences like this
is one way of looking for genes
59.
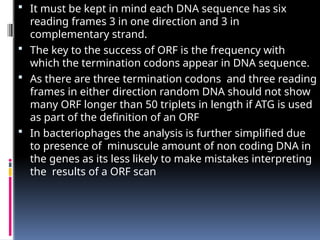
It mustbe kept in mind each DNA sequence has six
reading frames 3 in one direction and 3 in
complementary strand.
The key to the success of ORF is the frequency with
which the termination codons appear in DNA sequence.
As there are three termination codons and three reading
frames in either direction random DNA should not show
many ORF longer than 50 triplets in length if ATG is used
as part of the definition of an ORF
In bacteriophages the analysis is further simplified due
to presence of minuscule amount of non coding DNA in
the genes as its less likely to make mistakes interpreting
the results of a ORF scan
61.
Gene mapping ineukaryotes
gene mapping in neurospora
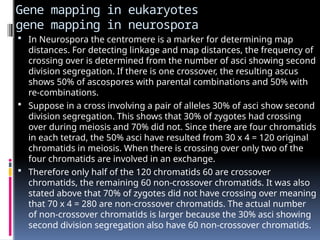
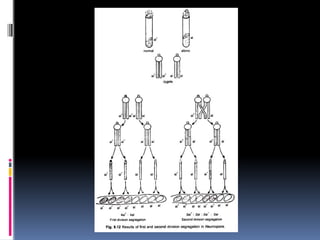
In Neurospora the centromere is a marker for determining map
distances. For detecting linkage and map distances, the frequency of
crossing over is determined from the number of asci showing second
division segregation. If there is one crossover, the resulting ascus
shows 50% of ascospores with parental combinations and 50% with
re-combinations.
Suppose in a cross involving a pair of alleles 30% of asci show second
division segregation. This shows that 30% of zygotes had crossing
over during meiosis and 70% did not. Since there are four chromatids
in each tetrad, the 50% asci have resulted from 30 x 4 = 120 original
chromatids in meiosis. When there is crossing over only two of the
four chromatids are involved in an exchange.
Therefore only half of the 120 chromatids 60 are crossover
chromatids, the remaining 60 non-crossover chromatids. It was also
stated above that 70% of zygotes did not have crossing over meaning
that 70 x 4 = 280 are non-crossover chromatids. The actual number
of non-crossover chromatids is larger because the 30% asci showing
second division segregation also have 60 non-crossover chromatids.
63.
The exactnumber is therefore 280 + 60 = 340. Therefore, of
the original 100 tetrads or asci 340 are non-crossover
chromatids and 60 are crossover chromatids. Since 100
tetrads or asci also mean 400 chromatids, the percentage
of crossover chromatids is (60/400) x 100 = 15%.
From this we can conclude that there was 15% crossing
over between the gene and the centromere. We can also
say that the gene in question is 15 map units apart from
the centromere. Because the centromere itself serves as a
marker, in Neurospora it is possible to map a single gene
pair. It is also called a two-point cross.
the method of detecting gene linkage in fungi is
basically similar to that for diploids. The main feature
consists in comparing the frequency of parental types
to recombinant types. If there is a significant
reduction in the frequency of recombinant types on
basis of independent assortment, we can consider
linkage.
64.
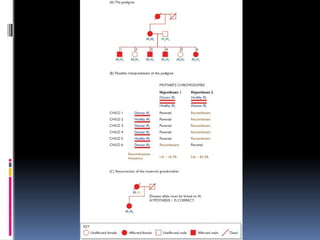
Gene mapping inhumans
data for the calculation of recombination frequencies are
obtained by examining the genotypes of members of
successive generations of existing families. This means that
only limited data is available.
Genetic diseases are frequently used as gene markers in
humans, the disease state being one allele and the healthy
state being a second allele. The pedigree shows us that the
mother is affected by the disease, as are four of her
children. We know from family accounts that the maternal
grandmother also suffered from this disease, but both she
and her husband are now dead. We can include them in the
pedigree, with slashes indicating that they are dead. Our
aim is to map the position of the gene for the genetic
disease. For this purpose we are studying its linkage to a
microsatellite marker M, four alleles of which - M1, M2, M3
and M4 - are present in the living family members
66.
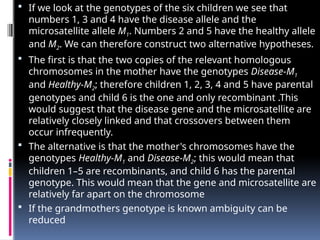
If welook at the genotypes of the six children we see that
numbers 1, 3 and 4 have the disease allele and the
microsatellite allele M1. Numbers 2 and 5 have the healthy allele
and M2. We can therefore construct two alternative hypotheses.
The first is that the two copies of the relevant homologous
chromosomes in the mother have the genotypes Disease-M1
and Healthy-M2; therefore children 1, 2, 3, 4 and 5 have parental
genotypes and child 6 is the one and only recombinant .This
would suggest that the disease gene and the microsatellite are
relatively closely linked and that crossovers between them
occur infrequently.
The alternative is that the mother's chromosomes have the
genotypes Healthy-M1 and Disease-M2; this would mean that
children 1–5 are recombinants, and child 6 has the parental
genotype. This would mean that the gene and microsatellite are
relatively far apart on the chromosome
If the grandmothers genotype is known ambiguity can be
reduced
67.
Let thegrandmother’s genotype for microsatellite M be
assumed to be M1M5 .This tells us that the disease allele is
on the same chromosome as M1. We can therefore
conclude with certainty that Hypothesis 1 is correct and
that only child 6 is a recombinant.
Imperfect pedigrees are analyzed statistically, using a
measure called the lod score. This stands for logarithm
of the odds that the genes are linked and is used
primarily to determine if the two markers being studied
lie on the same chromosome.
Ideally the available data will derive from more than one
pedigree, increasing the confidence in the result. The
analysis is less ambiguous for families with larger
numbers of children, and, as we saw in, it is important
that the members of at least three generations can be
genotyped.