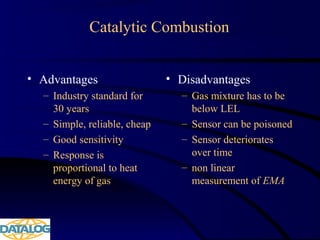
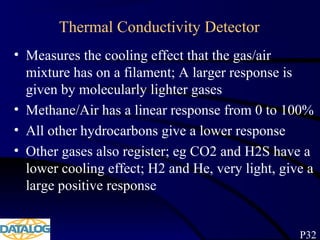
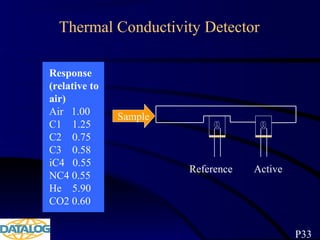
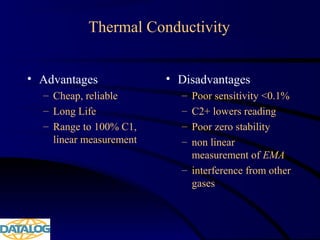
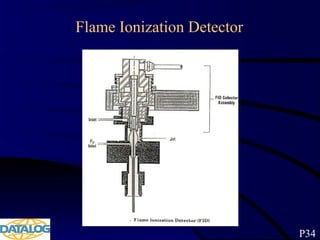
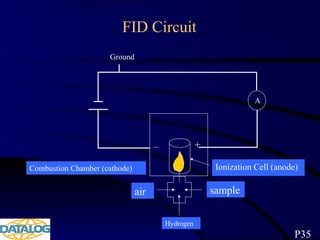
Dave Hawker
DATALOG
Hydrocarbon Evaluation
and Interpretation
W. Wylie ERCB
Standard Safety & Consulting Service (1978) Ltd
W.Wylie ERCB
Aims of the Course
• Study mechanisms by which gas enters the borehole.
• Identify factors controlling final gas measurements.
• Determine the importance of extraction methods, Total
Gas and Chromatographic analysis.
• Correct interpretation of real-time/depth-based logs.
• Evaluation of formation pressures.
• Reservoir evaluation from gas responses, including
porosity, saturation and permeability changes.
• Using gas ratios to determine fluid type and contacts.
• Further applications and benefits of gas analysis.
Timetable - Day 1
• What gases are being measured?
– Common hydrocarbon groups, API classification
• Extraction and measurement; What service to
select?
– Gas Traps; Quantitative Measurement; Total Gas
Detectors; Chromatography
• Quantitative Fluorescence Technique™
• Phase and solubility considerations
• Classification of gas sources
– recognition from surface measurements
Timetable - Day 1
• Controls on quantity and composition
– Formation, drilling and external influences
• Show evaluation
– Real-time and depth based logs
– Determination of Background gas
– Show evaluation to determine porosity and gas
saturation changes
– Gas normalization
Timetable - Day 2
• Recognition and evaluation of produced gas
– Background trend analysis; Evaluation of connection
and trip gases
• Chromatographic Analysis
– Evaluating fluid type and contact points using gas ratio
analysis; limitations to gas ratios
• Case Studies and Applications
– productive or non-productive? Wireline correlation and
non-correlation; geosteering; fracture identification
Hydrocarbon Compounds
• Saturated Hydrocarbons
– possessing single covalent bonds between the
carbon atoms; all free bonds used by hydrogen
• Unsaturated Hydrocarbons
– possessing double bonds between the carbon
atoms
P9
Saturated Hydrocarbons
• ALKANES
– short carbon chains with every bond occupied
by hydrogen atoms
• Paraffin Group - most common hydrocarbons
– straight chained - termed the normal Alkanes
– branch chained - isomers with 4+ carbon atoms
• Naphthene
– cyclic chained group
P10
Straight Chain Paraffins or Normal Alkanes
Structure Name Abbreviation Formula
Methane C1 CH4
Ethane C2 C2H6
Propane C3 C3H8
Normal Butane nC4 C4H10
Normal Pentane nC5 C5H12
P11
Cn H2n+2
Paraffins - Branched Alkanes
Structure Name Abbreviation Formula
Iso Butane iC4 C4H10
Iso Pentane iC5 C5H12
P12
Saturated Hydrocarbons
ALKANES
Paraffin
straight or branch chained
Naphthene
closed, cyclic chain
Paraffin names prefixed with cyclo-
Molecularly lighter than paraffins but analyzed as
if the same
Associated with higher density crude oil
P12
Naphthene - Cyclic Chained Alkanes
Structure Name Formula
Cyclopropane C3H6
Cyclobutane C4H8
Cyclopentane C5H10
P13
Cn H2n
Unsaturated Hydrocarbons or Aromatics
• Saturated Hydrocarbons
– possessing single covalent bonds between the
carbon atoms
• Unsaturated Hydrocarbons
– possessing double bonds between the carbon
atoms
P14
Unsaturated Hydrocarbons or Aromatics
Structure Name Formula
Benzene C6H6
Toluene C6H5 CH3
P14
Cn H2n-6
Unsaturated Hydrocarbons or Aromatics
• Closed chained but not saturated with
hydrogen
• Minor component to crude oils
• Highly soluble, difficult to detect
• Benzene
– most common aromatic, present in most crude
oils; proximity to source indicator
Wellsite Measurement
• Gas analysis is typically restricted to the
lighter, common hydrocarbons due to
analysis time and heavier hydrocarbons not
being present as a gas at surface
– Saturated Hydrocarbons
• Normal Alkanes and isomers (Paraffins)
• Methane (C1) through Pentane (C5)
• Cyclo-Alkanes (Naphthenes)
Extraction and Measurement
• Agitator Trap
– operational limitations; quantification
• Direct Gas in Mud - The GasWizardTM
• Total Gas Detectors
– combustion, thermal conductivity, flame
ionization, stand alone detectors
• Gas Chromatographs
– advantages, thermal conductivity, flame
ionization
Agitator Trap
mud flow
electric or air motor
gas released by
impeller agitation
and lifted by air
flow
mud in
mud out
air in
Gas/air sample
drawn to unit
P20
Mud level & parameters
Flowline design & length
Trap position
Length of sample line
Limitations of the Agitator
• Changes in mud flowrate
– inconsistent sampling and measurement
• Extracted gas expelled with mud
• Air dilution of gas sample
– causing delay and reduced definition
• Trap loading or saturation
– erroneously high measurement
• Extraction efficiency
– rheological, mechanical, gas composition
P18
Location and Positioning
• Directly over flowline entry?
• Correct depth for maximum efficiency?
• Away from cuttings obstruction so that flow
of mud is not restricted?
• Direction of exit port?
– downstream so not recycling degassed mud
– avoiding wind fluctuations
Quantifying the Gas Measurement?
• Texaco QGMTM
system
– patented trap design reduces the limitation of
flowrate change and expelled gas; eliminates
wind fluctuations
• Calibrate gas-in-air measurement against
gas-in-mud measurement
– using steam or microwave stills
– accounting for losses to the atmosphere?
– poor sample quality if mud is gas cut?
– frequency of mud gas sampling?
P22
Quantifying the Gas Measurement?
• Equate to formation gas volume (apparent
gas porosity) by comparing cuttings to mud
volume ratio and allowing for gas
expansion
– changes in liberated gas volume due to the
effects of flushing, influxes, washouts
• The system is only accurate for low gas
volumes and small bubble size
EVALUATION OF RELATIVE CHANGES
P23
GasWizardTM
- QUANTITATIVE
GAS IN MUD MEASUREMENT
P24
DIRECT TOTAL GAS
MEASUREMENT - GasWizardTM
• Patented quantitative gas-in-mud
measurement
• Flow line, bell nipple or suction line
mountable
• Oil, water, air / foam drilling systems
• Automatic calibration, zeroing,
thermostat & ranging
• No moving parts
• No agitator; No sample line
P25
GasWizardTM
- Evaluation Advantages
• Quantitative extraction from mud, of all
gas components, dissolved or free
• Response 6x faster than agitator traps
• No ‘trap loading’ leading to erroneously
high gas values
• Minimal dilution - better defined shows
• Excellent depth resolution
• Not affected by mud density/viscosity
• Sample heated - no condensing of gas
GasWizard Test Response
GasWizardTM
vs Gas Trap…..% By Volume
5 min
0% 10%
Gas Trap
Direct Gas
in Mud
GasWizardTM
versus Agitator
Values typically lower in
water-based muds; higher
in oil-based muds
P27
Total Gas Detectors
• How do the different types of gas detector
vary in their operation, response and resulting
evaluation?
• What is the value of Total gas measurement?
• What are the limitations to Total gas
measurement?
– Catalytic Combustion or “Hotwire”
– Thermal Conductivity
– Flame Ionization
Catalytic Combustion Detector
P29
Platinum filament
catalyst
Alumina bead
• A filament combusts a
fraction of the gas
sample; it’s temperature
increases resulting in a
change of electrical
resistance and potential
difference which is
calibrated in terms of gas
concentration
CC Response
• Detector response increases with molecular
weight; An increase can therefore be caused by
a change in quantity or in composition
• Non-linear measurement of EMA
Response (relative to C1)
C1 1.000
C2 1.478
C3 1.812
iC4 1.938
NC4 1.710
H2S 2.456
P30
CC Response
Detector
Response
Concentration in Air
C1C2C3
LEL
P31
• For linear methane response, the gas mixture
has to be diluted and kept below the LEL
Catalytic Combustion
• Advantages
– Industry standard for
30 years
– Simple, reliable, cheap
– Good sensitivity
– Response is
proportional to heat
energy of gas
• Disadvantages
– Gas mixture has to be
below LEL
– Sensor can be poisoned
– Sensor deteriorates
over time
– non linear
measurement of EMA
Thermal Conductivity Detector
• Measures the cooling effect that the gas/air
mixture has on a filament; A larger response is
given by molecularly lighter gases
• Methane/Air has a linear response from 0 to 100%
• All other hydrocarbons give a lower response
• Other gases also register; eg CO2 and H2S have a
lower cooling effect; H2 and He, very light, give a
large positive response
P32
Thermal Conductivity Detector
Response
(relative to
air)
Air 1.00
C1 1.25
C2 0.75
C3 0.58
iC4 0.55
NC4 0.55
He 5.90
CO2 0.60
ActiveReference
Sample
P33
Thermal Conductivity
• Advantages
– Cheap, reliable
– Long Life
– Range to 100% C1,
linear measurement
• Disadvantages
– Poor sensitivity <0.1%
– C2+ lowers reading
– Poor zero stability
– non linear
measurement of EMA
– interference from other
gases
Flame Ionization Detector
P34
FID Circuit
Ground
A
Hydrogen
Ionization Cell (anode)Combustion Chamber (cathode)
+
air sample
P35
FID Operation
• Complete combustion of gas sample in a
hydrogen flame
• Detects the ionization process when
combustion breaks down the carbon-hydrogen
bonds, releasing electrons that change the
electrical current
• Gives a linear measurement of Equivalent
Methane in Air
Flame ionization
• Advantages
– Excellent sensitivity
and range
– Stable
– Response equal to
number of carbon
atoms, linear
measurement of EMA
• Disadvantages
– Expensive
– Complicated
– USE OF HYDROGEN
The Value of Total Gas Measurement
• Continuous gas monitoring, instantaneous
response
• Effective when zone is well known or only
one fluid type or gas will be encountered
• Assists the wellsite geologist in core point
selection and formation tops
• Backup to chromatographic analysis
• Safety
• Stand-alone monitoring systems
P39
Limitations
• Measurement is qualitative rather than
quantitative
• Can not distinguish hydrocarbon type,
therefore can’t identify fluid type
• Poor understanding of the differences
between detector measurements
Difference in Detector Response
P38
Total Gas Monitoring Systems
• Used independently by wellsite geologist
• Automated with lagged gas, ROP and basic
logging information, optional H2S
• Continual printout and data storage; LAS
output, compatible with strip-log software
• Well safety
• Insurance against wireline data not being
run or being of poor quality due to invasion
P40
Chromatographic Analysis
• Absolute measurement of individual gases
and hydrocarbon compounds
– Separation occurs as sample passed through
columns containing separating medium
• Different retention rates for gases of varying
chemical or physical properties
• Individual components passed to detector
where they are analyzed and measured
P42
Chromatographic Analysis
• Chromatographs can work on the
principle of any of the previous detectors
• Particular gases analyzed dependent on:-
• separating medium
• carrier gas
• column temperature and pressure
• separation time allowed
Chromatographic Analysis
• Samples have to be separated and analyzed before
the following sample can be taken
• Chromatographs can be limited by this sample cycle
• Short sample time allows for: -
• effective analysis with fast ROP’s
• detection of fractures, thin beds
• identifying formation tops
• identifying fluid contacts
P43
The Portable Micro-Chromatograph
Capillary Column & Micro-Detector
Sample Chromatogram
10 20 30
elution time (seconds)
O2+N2
C1
CO2
C2
C3
iC4
nC4
iC5 nC5
composite Column A
Column B
P45
Advantages/Benefits of Chromatography
• Quantitative measurement of all selected
hydrocarbon components
• Non-hydrocarbon analysis with TCD’s
• Determination of reservoir fluid type
• Determination of fluid contacts
• Applications such as geo-steering
TCD versus FID?
• TCD variable response due to air flow and gas type is
not a factor due to auto-zeroing and gas separation
• Micro-detector provides fast response ensuring
linearity comparable to FID
• Both subject to non-linearity as a result of gas
viscosity and entry into columns
• Both subject to amplifier and column saturation
• FID’s requirement of hydrogen supply
• Measurement of non-hydrocarbons with TCD
• TCD lower sensitivity is 10ppm, FID to the ppb.
P44
Summary
• Careful consideration should be
given, as to the requirements of gas
detection, when selecting the type of
service.
What Type of Service?
• Total Gas Detection is effective when….
– drilling gas wells
– identification of relative changes is sufficient to
determine zones of interest
– users understand the different responses from
the different types of detectors
• Gas Chromatography should be used….
– in exploratory wells with minimal offset data
– when fluid type/changes is to be evaluated
Conventional Fluorescence
• Colour under ultra-violet light being an
indication of the density of the petroleum
fluid
• The intensity of the fluorescence being an
indication of the presence of water
• Solvent cut as an indication of density and
mobility
P225/228
Fluorescence Colour
High API gravity oil
Medium API gravity oil
Low API gravity oil
Very low gravity, typically low
intensity
Condensate
10
15
35
45
P237
API degree
Solvent Cut
• Solvent takes the fluid
into solution and
leaches it out of the
cutting
• Speed and nature of
the ‘cut’ reflects fluid
density, viscosity,
solubility and
permeability
• The better the permeability, the
faster the cut
• The lower the viscosity, the
faster the cut
• Uniform blooming indicates
good permeability and mobility
• Streaming cut indicates reduced
permeability and/or high
viscosity
P230
Limitations to UV Fluorescence
• Subjective colour descriptions
• Presence of contaminants
• Much of the fluorescence emissions fall in
the ultra-violet range of the spectrum
– any fluorescence visible is only a fraction of the
total emission
– Some emissions may go completely undetected
Quantitative Fluorescence Technique™
• Patented and licensed by Texaco
• Quantitative measurement of the fluorescence
intensity which is proportional to the quantity of
oil
– removes subjective descriptions
– removes error through fluorescence in the ultra-violet
range
• Uses crushed dried drilled cuttings, solvent such
as heptane and a portable fluorometer
P232
QFT™ vs Gas/Fluorescence
Reservoir Top
Reservoir Base
Fluoresence
QFT
Total Gas
P233
QFT™ - Operational Limitations
• For a given oil, QFT response relates to oil concentration,
however:
• Response is not linear across changing oil gravity - heavier
oils generate a larger response
• How representative is the cuttings sample to the producing
formation?
• Less accurate with flushed zones or very good permeability
• Responses can be seen from coals and other solid
hydrocarbons that possess the fluorescing aromatics
• Mud contamination, OBM systems, recycled hydrocarbons
P234
Gas measurement

Gas measurement

  • 1.
  • 2.
  • 3.
    Standard Safety &Consulting Service (1978) Ltd
  • 4.
  • 5.
    Aims of theCourse • Study mechanisms by which gas enters the borehole. • Identify factors controlling final gas measurements. • Determine the importance of extraction methods, Total Gas and Chromatographic analysis. • Correct interpretation of real-time/depth-based logs. • Evaluation of formation pressures. • Reservoir evaluation from gas responses, including porosity, saturation and permeability changes. • Using gas ratios to determine fluid type and contacts. • Further applications and benefits of gas analysis.
  • 6.
    Timetable - Day1 • What gases are being measured? – Common hydrocarbon groups, API classification • Extraction and measurement; What service to select? – Gas Traps; Quantitative Measurement; Total Gas Detectors; Chromatography • Quantitative Fluorescence Technique™ • Phase and solubility considerations • Classification of gas sources – recognition from surface measurements
  • 7.
    Timetable - Day1 • Controls on quantity and composition – Formation, drilling and external influences • Show evaluation – Real-time and depth based logs – Determination of Background gas – Show evaluation to determine porosity and gas saturation changes – Gas normalization
  • 8.
    Timetable - Day2 • Recognition and evaluation of produced gas – Background trend analysis; Evaluation of connection and trip gases • Chromatographic Analysis – Evaluating fluid type and contact points using gas ratio analysis; limitations to gas ratios • Case Studies and Applications – productive or non-productive? Wireline correlation and non-correlation; geosteering; fracture identification
  • 9.
    Hydrocarbon Compounds • SaturatedHydrocarbons – possessing single covalent bonds between the carbon atoms; all free bonds used by hydrogen • Unsaturated Hydrocarbons – possessing double bonds between the carbon atoms P9
  • 10.
    Saturated Hydrocarbons • ALKANES –short carbon chains with every bond occupied by hydrogen atoms • Paraffin Group - most common hydrocarbons – straight chained - termed the normal Alkanes – branch chained - isomers with 4+ carbon atoms • Naphthene – cyclic chained group P10
  • 11.
    Straight Chain Paraffinsor Normal Alkanes Structure Name Abbreviation Formula Methane C1 CH4 Ethane C2 C2H6 Propane C3 C3H8 Normal Butane nC4 C4H10 Normal Pentane nC5 C5H12 P11 Cn H2n+2
  • 12.
    Paraffins - BranchedAlkanes Structure Name Abbreviation Formula Iso Butane iC4 C4H10 Iso Pentane iC5 C5H12 P12
  • 13.
    Saturated Hydrocarbons ALKANES Paraffin straight orbranch chained Naphthene closed, cyclic chain Paraffin names prefixed with cyclo- Molecularly lighter than paraffins but analyzed as if the same Associated with higher density crude oil P12
  • 14.
    Naphthene - CyclicChained Alkanes Structure Name Formula Cyclopropane C3H6 Cyclobutane C4H8 Cyclopentane C5H10 P13 Cn H2n
  • 15.
    Unsaturated Hydrocarbons orAromatics • Saturated Hydrocarbons – possessing single covalent bonds between the carbon atoms • Unsaturated Hydrocarbons – possessing double bonds between the carbon atoms P14
  • 16.
    Unsaturated Hydrocarbons orAromatics Structure Name Formula Benzene C6H6 Toluene C6H5 CH3 P14 Cn H2n-6
  • 17.
    Unsaturated Hydrocarbons orAromatics • Closed chained but not saturated with hydrogen • Minor component to crude oils • Highly soluble, difficult to detect • Benzene – most common aromatic, present in most crude oils; proximity to source indicator
  • 18.
    Wellsite Measurement • Gasanalysis is typically restricted to the lighter, common hydrocarbons due to analysis time and heavier hydrocarbons not being present as a gas at surface – Saturated Hydrocarbons • Normal Alkanes and isomers (Paraffins) • Methane (C1) through Pentane (C5) • Cyclo-Alkanes (Naphthenes)
  • 19.
    Extraction and Measurement •Agitator Trap – operational limitations; quantification • Direct Gas in Mud - The GasWizardTM • Total Gas Detectors – combustion, thermal conductivity, flame ionization, stand alone detectors • Gas Chromatographs – advantages, thermal conductivity, flame ionization
  • 20.
    Agitator Trap mud flow electricor air motor gas released by impeller agitation and lifted by air flow mud in mud out air in Gas/air sample drawn to unit P20
  • 21.
    Mud level &parameters Flowline design & length Trap position Length of sample line
  • 22.
    Limitations of theAgitator • Changes in mud flowrate – inconsistent sampling and measurement • Extracted gas expelled with mud • Air dilution of gas sample – causing delay and reduced definition • Trap loading or saturation – erroneously high measurement • Extraction efficiency – rheological, mechanical, gas composition P18
  • 23.
    Location and Positioning •Directly over flowline entry? • Correct depth for maximum efficiency? • Away from cuttings obstruction so that flow of mud is not restricted? • Direction of exit port? – downstream so not recycling degassed mud – avoiding wind fluctuations
  • 24.
    Quantifying the GasMeasurement? • Texaco QGMTM system – patented trap design reduces the limitation of flowrate change and expelled gas; eliminates wind fluctuations • Calibrate gas-in-air measurement against gas-in-mud measurement – using steam or microwave stills – accounting for losses to the atmosphere? – poor sample quality if mud is gas cut? – frequency of mud gas sampling? P22
  • 25.
    Quantifying the GasMeasurement? • Equate to formation gas volume (apparent gas porosity) by comparing cuttings to mud volume ratio and allowing for gas expansion – changes in liberated gas volume due to the effects of flushing, influxes, washouts • The system is only accurate for low gas volumes and small bubble size EVALUATION OF RELATIVE CHANGES P23
  • 26.
  • 27.
    DIRECT TOTAL GAS MEASUREMENT- GasWizardTM • Patented quantitative gas-in-mud measurement • Flow line, bell nipple or suction line mountable • Oil, water, air / foam drilling systems • Automatic calibration, zeroing, thermostat & ranging • No moving parts • No agitator; No sample line P25
  • 28.
    GasWizardTM - Evaluation Advantages •Quantitative extraction from mud, of all gas components, dissolved or free • Response 6x faster than agitator traps • No ‘trap loading’ leading to erroneously high gas values • Minimal dilution - better defined shows • Excellent depth resolution • Not affected by mud density/viscosity • Sample heated - no condensing of gas
  • 29.
  • 30.
    GasWizardTM vs Gas Trap…..%By Volume 5 min 0% 10% Gas Trap Direct Gas in Mud
  • 31.
    GasWizardTM versus Agitator Values typicallylower in water-based muds; higher in oil-based muds P27
  • 33.
    Total Gas Detectors •How do the different types of gas detector vary in their operation, response and resulting evaluation? • What is the value of Total gas measurement? • What are the limitations to Total gas measurement? – Catalytic Combustion or “Hotwire” – Thermal Conductivity – Flame Ionization
  • 34.
    Catalytic Combustion Detector P29 Platinumfilament catalyst Alumina bead • A filament combusts a fraction of the gas sample; it’s temperature increases resulting in a change of electrical resistance and potential difference which is calibrated in terms of gas concentration
  • 35.
    CC Response • Detectorresponse increases with molecular weight; An increase can therefore be caused by a change in quantity or in composition • Non-linear measurement of EMA Response (relative to C1) C1 1.000 C2 1.478 C3 1.812 iC4 1.938 NC4 1.710 H2S 2.456 P30
  • 36.
    CC Response Detector Response Concentration inAir C1C2C3 LEL P31 • For linear methane response, the gas mixture has to be diluted and kept below the LEL
  • 37.
    Catalytic Combustion • Advantages –Industry standard for 30 years – Simple, reliable, cheap – Good sensitivity – Response is proportional to heat energy of gas • Disadvantages – Gas mixture has to be below LEL – Sensor can be poisoned – Sensor deteriorates over time – non linear measurement of EMA
  • 38.
    Thermal Conductivity Detector •Measures the cooling effect that the gas/air mixture has on a filament; A larger response is given by molecularly lighter gases • Methane/Air has a linear response from 0 to 100% • All other hydrocarbons give a lower response • Other gases also register; eg CO2 and H2S have a lower cooling effect; H2 and He, very light, give a large positive response P32
  • 39.
    Thermal Conductivity Detector Response (relativeto air) Air 1.00 C1 1.25 C2 0.75 C3 0.58 iC4 0.55 NC4 0.55 He 5.90 CO2 0.60 ActiveReference Sample P33
  • 40.
    Thermal Conductivity • Advantages –Cheap, reliable – Long Life – Range to 100% C1, linear measurement • Disadvantages – Poor sensitivity <0.1% – C2+ lowers reading – Poor zero stability – non linear measurement of EMA – interference from other gases
  • 41.
  • 42.
    FID Circuit Ground A Hydrogen Ionization Cell(anode)Combustion Chamber (cathode) + air sample P35
  • 43.
    FID Operation • Completecombustion of gas sample in a hydrogen flame • Detects the ionization process when combustion breaks down the carbon-hydrogen bonds, releasing electrons that change the electrical current • Gives a linear measurement of Equivalent Methane in Air
  • 44.
    Flame ionization • Advantages –Excellent sensitivity and range – Stable – Response equal to number of carbon atoms, linear measurement of EMA • Disadvantages – Expensive – Complicated – USE OF HYDROGEN
  • 45.
    The Value ofTotal Gas Measurement • Continuous gas monitoring, instantaneous response • Effective when zone is well known or only one fluid type or gas will be encountered • Assists the wellsite geologist in core point selection and formation tops • Backup to chromatographic analysis • Safety • Stand-alone monitoring systems P39
  • 46.
    Limitations • Measurement isqualitative rather than quantitative • Can not distinguish hydrocarbon type, therefore can’t identify fluid type • Poor understanding of the differences between detector measurements
  • 47.
  • 48.
    Total Gas MonitoringSystems • Used independently by wellsite geologist • Automated with lagged gas, ROP and basic logging information, optional H2S • Continual printout and data storage; LAS output, compatible with strip-log software • Well safety • Insurance against wireline data not being run or being of poor quality due to invasion P40
  • 49.
    Chromatographic Analysis • Absolutemeasurement of individual gases and hydrocarbon compounds – Separation occurs as sample passed through columns containing separating medium • Different retention rates for gases of varying chemical or physical properties • Individual components passed to detector where they are analyzed and measured P42
  • 50.
    Chromatographic Analysis • Chromatographscan work on the principle of any of the previous detectors • Particular gases analyzed dependent on:- • separating medium • carrier gas • column temperature and pressure • separation time allowed
  • 51.
    Chromatographic Analysis • Sampleshave to be separated and analyzed before the following sample can be taken • Chromatographs can be limited by this sample cycle • Short sample time allows for: - • effective analysis with fast ROP’s • detection of fractures, thin beds • identifying formation tops • identifying fluid contacts P43
  • 52.
  • 53.
    Capillary Column &Micro-Detector
  • 54.
    Sample Chromatogram 10 2030 elution time (seconds) O2+N2 C1 CO2 C2 C3 iC4 nC4 iC5 nC5 composite Column A Column B P45
  • 55.
    Advantages/Benefits of Chromatography •Quantitative measurement of all selected hydrocarbon components • Non-hydrocarbon analysis with TCD’s • Determination of reservoir fluid type • Determination of fluid contacts • Applications such as geo-steering
  • 56.
    TCD versus FID? •TCD variable response due to air flow and gas type is not a factor due to auto-zeroing and gas separation • Micro-detector provides fast response ensuring linearity comparable to FID • Both subject to non-linearity as a result of gas viscosity and entry into columns • Both subject to amplifier and column saturation • FID’s requirement of hydrogen supply • Measurement of non-hydrocarbons with TCD • TCD lower sensitivity is 10ppm, FID to the ppb. P44
  • 57.
    Summary • Careful considerationshould be given, as to the requirements of gas detection, when selecting the type of service.
  • 58.
    What Type ofService? • Total Gas Detection is effective when…. – drilling gas wells – identification of relative changes is sufficient to determine zones of interest – users understand the different responses from the different types of detectors • Gas Chromatography should be used…. – in exploratory wells with minimal offset data – when fluid type/changes is to be evaluated
  • 59.
    Conventional Fluorescence • Colourunder ultra-violet light being an indication of the density of the petroleum fluid • The intensity of the fluorescence being an indication of the presence of water • Solvent cut as an indication of density and mobility P225/228
  • 60.
    Fluorescence Colour High APIgravity oil Medium API gravity oil Low API gravity oil Very low gravity, typically low intensity Condensate 10 15 35 45 P237 API degree
  • 61.
    Solvent Cut • Solventtakes the fluid into solution and leaches it out of the cutting • Speed and nature of the ‘cut’ reflects fluid density, viscosity, solubility and permeability • The better the permeability, the faster the cut • The lower the viscosity, the faster the cut • Uniform blooming indicates good permeability and mobility • Streaming cut indicates reduced permeability and/or high viscosity P230
  • 62.
    Limitations to UVFluorescence • Subjective colour descriptions • Presence of contaminants • Much of the fluorescence emissions fall in the ultra-violet range of the spectrum – any fluorescence visible is only a fraction of the total emission – Some emissions may go completely undetected
  • 63.
    Quantitative Fluorescence Technique™ •Patented and licensed by Texaco • Quantitative measurement of the fluorescence intensity which is proportional to the quantity of oil – removes subjective descriptions – removes error through fluorescence in the ultra-violet range • Uses crushed dried drilled cuttings, solvent such as heptane and a portable fluorometer P232
  • 64.
    QFT™ vs Gas/Fluorescence ReservoirTop Reservoir Base Fluoresence QFT Total Gas P233
  • 65.
    QFT™ - OperationalLimitations • For a given oil, QFT response relates to oil concentration, however: • Response is not linear across changing oil gravity - heavier oils generate a larger response • How representative is the cuttings sample to the producing formation? • Less accurate with flushed zones or very good permeability • Responses can be seen from coals and other solid hydrocarbons that possess the fluorescing aromatics • Mud contamination, OBM systems, recycled hydrocarbons P234