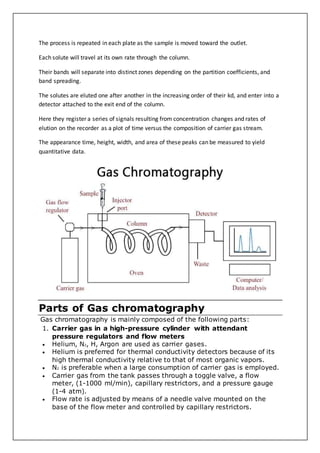
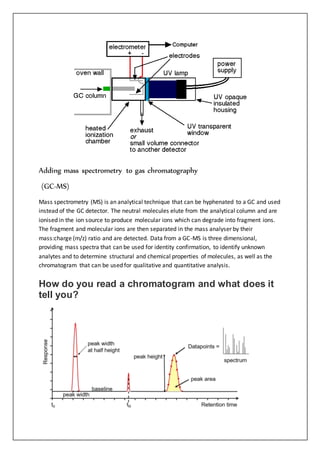
A separation technique in which the mobile phase is a gas. Gas chromatography is always carried out in a column.
Separating mixtures of gases or volatile materials based primarily on their physical properties.
fluid chromatography (SFC) can be used on an analytical
scale.
It is a combination of High performance liquid chromatography (HPLC)
and Gas chromatography (GC).
It can be used with non-volatile and thermally labile analytes.
It can be used with the universal flame ionization detector.
It is important to producing narrower peaks due to rapid diffusion.
It is important for the chiral separations and analysis of high-molecularweight
hydrocarbons.
Supercritical fluids are suitable as a substitute for organic solvents in a
range of industrial and laboratory processes.
Gas chromatography and its instrumentationArgha Sen
Gas chromatography is an unique technology which helps us in separating volatile analytes. Its is an easy and reproduciple method for detecting residual solvents found in APIs.
in this slides contains principle and types of detectors used in Gas Chromatography.
Presented by: J.Vinay Krishna. (Department of industrial pharmacy),
RIPER, anantapur.
In this slide contains types of HPLC Columns, Plate theory and Van Deemter Equation.
Presented by : Malarvannan.M (Department of pharmaceutical analysis).
RIPER,anantpur.
The GC produces a graph called a chromatogram, which shows peaks: the size of a peak indicates the amount of each component reaching the detector. The number of peaks shows different compounds present in the sample. The position of each peak shows the retention time for each compound
Acetabularia Information For Class 9 .docxvaibhavrinwa19
Acetabularia acetabulum is a single-celled green alga that in its vegetative state is morphologically differentiated into a basal rhizoid and an axially elongated stalk, which bears whorls of branching hairs. The single diploid nucleus resides in the rhizoid.
Honest Reviews of Tim Han LMA Course Program.pptxtimhan337
Personal development courses are widely available today, with each one promising life-changing outcomes. Tim Han’s Life Mastery Achievers (LMA) Course has drawn a lot of interest. In addition to offering my frank assessment of Success Insider’s LMA Course, this piece examines the course’s effects via a variety of Tim Han LMA course reviews and Success Insider comments.
Francesca Gottschalk - How can education support child empowerment.pptxEduSkills OECD
Francesca Gottschalk from the OECD’s Centre for Educational Research and Innovation presents at the Ask an Expert Webinar: How can education support child empowerment?
The Roman Empire A Historical Colossus.pdfkaushalkr1407
The Roman Empire, a vast and enduring power, stands as one of history's most remarkable civilizations, leaving an indelible imprint on the world. It emerged from the Roman Republic, transitioning into an imperial powerhouse under the leadership of Augustus Caesar in 27 BCE. This transformation marked the beginning of an era defined by unprecedented territorial expansion, architectural marvels, and profound cultural influence.
The empire's roots lie in the city of Rome, founded, according to legend, by Romulus in 753 BCE. Over centuries, Rome evolved from a small settlement to a formidable republic, characterized by a complex political system with elected officials and checks on power. However, internal strife, class conflicts, and military ambitions paved the way for the end of the Republic. Julius Caesar’s dictatorship and subsequent assassination in 44 BCE created a power vacuum, leading to a civil war. Octavian, later Augustus, emerged victorious, heralding the Roman Empire’s birth.
Under Augustus, the empire experienced the Pax Romana, a 200-year period of relative peace and stability. Augustus reformed the military, established efficient administrative systems, and initiated grand construction projects. The empire's borders expanded, encompassing territories from Britain to Egypt and from Spain to the Euphrates. Roman legions, renowned for their discipline and engineering prowess, secured and maintained these vast territories, building roads, fortifications, and cities that facilitated control and integration.
The Roman Empire’s society was hierarchical, with a rigid class system. At the top were the patricians, wealthy elites who held significant political power. Below them were the plebeians, free citizens with limited political influence, and the vast numbers of slaves who formed the backbone of the economy. The family unit was central, governed by the paterfamilias, the male head who held absolute authority.
Culturally, the Romans were eclectic, absorbing and adapting elements from the civilizations they encountered, particularly the Greeks. Roman art, literature, and philosophy reflected this synthesis, creating a rich cultural tapestry. Latin, the Roman language, became the lingua franca of the Western world, influencing numerous modern languages.
Roman architecture and engineering achievements were monumental. They perfected the arch, vault, and dome, constructing enduring structures like the Colosseum, Pantheon, and aqueducts. These engineering marvels not only showcased Roman ingenuity but also served practical purposes, from public entertainment to water supply.
Biological screening of herbal drugs: Introduction and Need for
Phyto-Pharmacological Screening, New Strategies for evaluating
Natural Products, In vitro evaluation techniques for Antioxidants, Antimicrobial and Anticancer drugs. In vivo evaluation techniques
for Anti-inflammatory, Antiulcer, Anticancer, Wound healing, Antidiabetic, Hepatoprotective, Cardio protective, Diuretics and
Antifertility, Toxicity studies as per OECD guidelines
Macroeconomics- Movie Location
This will be used as part of your Personal Professional Portfolio once graded.
Objective:
Prepare a presentation or a paper using research, basic comparative analysis, data organization and application of economic information. You will make an informed assessment of an economic climate outside of the United States to accomplish an entertainment industry objective.
Synthetic Fiber Construction in lab .pptxPavel ( NSTU)
Synthetic fiber production is a fascinating and complex field that blends chemistry, engineering, and environmental science. By understanding these aspects, students can gain a comprehensive view of synthetic fiber production, its impact on society and the environment, and the potential for future innovations. Synthetic fibers play a crucial role in modern society, impacting various aspects of daily life, industry, and the environment. ynthetic fibers are integral to modern life, offering a range of benefits from cost-effectiveness and versatility to innovative applications and performance characteristics. While they pose environmental challenges, ongoing research and development aim to create more sustainable and eco-friendly alternatives. Understanding the importance of synthetic fibers helps in appreciating their role in the economy, industry, and daily life, while also emphasizing the need for sustainable practices and innovation.
1. Gas-Liquid Chromatography
By-SUBHASMITH PRADHAN
What is gas chromatography?
Gas chromatography differs from other forms of chromatography in that the mobile phase
is a gas and the components are separated as vapors.
It is thus used to separate and detect small molecular weight compounds in the gas phase.
The sample is either a gas or a liquid that is vaporized in the injection port. The mobile
phase for gas chromatography is a carrier gas, typically helium because of its low molecular
weight and being chemically inert.
The pressure is applied and the mobile phase moves the analyte through the column. The
separation is accomplished using a column coated with a stationary phase.
Principle of Gas chromatography (how
does gas chromatography work)
The equilibrium for gas chromatography is partitioning, and the components of the sample
will partition (i.e. distribute) between the two phases: the stationary phase and the mobile
phase.
Compounds that have a greater affinity for the stationary phase spend more time in the
column and thus elute later and have a longer retention time (Rt) than samples that have a
higher affinity for the mobile phase.
Affinity for the stationary phase is driven mainly by intermolecular interactions and the
polarity of the stationary phase can be chosen to maximize interactions and thus the
separation.
Ideal peaks are Gaussian distributions and symmetrical, because of the random nature of
the analyte interactions with the column.
The separation is hence accomplished by partitioning the sample between the gas and a
thin layer of a nonvolatile liquid held on a solid support.
A sample containing the solutes is injected into a heated block where it is immediately
vaporized and swept as a plug of vapor by the carrier gas streaminto the column inlet.
The solutes are adsorbed by the stationary phase and then desorbed by a fresh carrier gas.
2. The process is repeated in each plate as the sample is moved toward the outlet.
Each solute will travel at its own rate through the column.
Their bands will separate into distinct zones depending on the partition coefficients, and
band spreading.
The solutes are eluted one after another in the increasing order of their kd, and enter into a
detector attached to the exit end of the column.
Here they register a series of signals resulting from concentration changes and rates of
elution on the recorder as a plot of time versus the composition of carrier gas stream.
The appearance time, height, width, and area of these peaks can be measured to yield
quantitative data.
Parts of Gas chromatography
Gas chromatography is mainly composed of the following parts:
1. Carrier gas in a high-pressure cylinder with attendant
pressure regulators and flow meters
Helium, N2, H, Argon are used as carrier gases.
Helium is preferred for thermal conductivity detectors because of its
high thermal conductivity relative to that of most organic vapors.
N2 is preferable when a large consumption of carrier gas is employed.
Carrier gas from the tank passes through a toggle valve, a flow
meter, (1-1000 ml/min), capillary restrictors, and a pressure gauge
(1-4 atm).
Flow rate is adjusted by means of a needle valve mounted on the
base of the flow meter and controlled by capillary restrictors.
3. The operating efficiency of the gas chromatograph is directly
dependant on the maintenance of constant gas flow.
2. Sample injection system
Liquid samples are injected by a microsyringe with a needle inserted
through a self-scaling, silicon-rubber septum into a heated metal
block by a resistance heater.
Gaseous samples are injected by a gas-tight syringe or through a by-
pass loop and valves.
Typical sample volumes range from 0.1 to 0.2 ml.
3. The separation column
The heart of the gas chromatography is the column which is made of
metals bent in U shape or coiled into an open spiral or a flat pancake
shape.
Copper is useful up to 2500
Swege lock fittings make column insertion easy.
Several sizes of columns are used depending upon the requirements.
4. Liquid phases
An infinite variety of liquid phases are available limited only by their
volatility, thermal stability and ability to wet the support.
No single phase will serve for all separation problems at all
temperatures.
Non-Polar – Parafin, squalane, silicone greases, apiezon L, silicone gum
rubber. These materials separate the components in order of their boiling
points.
Intermediate Polarity – These materials contain a polar or polarizable
group on a long non-polar skeleton which can dissolve both polar and
non-polar solutes. For example. diethyl hexyl phthalate is used for the
separation of high boiling alcohols.
Polar – Carbowaxes – Liquid phases with a large proportion of polar
groups. Separation of polar and non-polar substances.
Hydrogen bonding – Polar liquid phases with high hydrogen bonding
e.g. Glycol.
Specific purpose phases – Relying on a chemical reaction with solute to
achieve separations. e.g AgNO3 in glycol separates unsaturated
hydrocarbons.
5. Supports
The structure and surface characteristics of the support materials are
important parameters, which determine the efficiency of the support
and the degree of separation respectively.
The support should be inert but capable of immobilizing a large
volume of liquid phase as a thin film over its surface.
The surface area should be large to ensure the rapid attainment of
equilibrium between stationary and mobile phases.
Support should be strong enough to resist breakdown in handling and
be capable of packed into a uniform bed.
Diatomaceous earth, kieselguhr treated with Na 2CO 3 for 9000
C
causes the particle fusion into coarser aggregates.
4. Glass beads with a low surface area and low porosity can be used to
coat up to 3% stationary phases.
Porous polymer beads differing in the degree of cross-linking of
styrene with alkyl-vinyl benzene are also used which are stable up to
2500
6. Detector
Detectors sense the arrival of the separated components and provide
a signal.
These are either concentration-dependent or mass dependant.
The detector should be close to the column exit and the correct
temperature to prevent decomposition.
7. Recorder
The recorder should be generally 10 mv (full scale) fitted with a fast
response pen (1 sec or less). The recorder should be connected with a
series of good quality resistances connected across the input to
attenuate the large signals.
An integrator may be a good addition.
The procedure of Gas Chromatography
Step 1: Sample Injection and Vapourization
1. A small amount of liquid sample to be analyzed is drawn up into a
syringe.
2. The syringe needle is positioned in the hot injection port of the gas
chromatograph and the sample is injected quickly.
3. The injection of the sample is considered to be a “point” in time, that
is, it is assumed that the entire sample enters the gas chromatograph
at the same time, so the sample must be injected quickly.
4. The temperature is set to be higher than the boiling points of the
components of the mixture so that the components will vaporize.
5. The vaporized components then mix with the inert gas mobile phase
to be carried to the gas chromatography column to be separated.
Step 2: Separation in the Column
Components in the mixture are separated based on their abilities to
adsorb on or bind to, the stationary phase.
A component that adsorbs most strongly to the stationary phase will
spend the most time in the column (will be retained in the column for
the longest time) and will, therefore, have the longest retention time
(Rt). It will emerge from the gas chromatograph last.
A component that adsorbs the least strongly to the stationary phase
will spend the least time in the column (will be retained in the column
for the shortest time) and will, therefore, have the shortest retention
time (Rt). It will emerge from the gas chromatograph first.
If we consider a 2 component mixture in which component A is
more polar than component B then:
5. 1. component A will have a longer retention time in a polar column
than component B
2. component A will have a shorter retention time in a non-polar
column than component B
Step 3: Detecting and Recording Results
1. The components of the mixture reach the detector at different times
due to differences in the time they are retained in the column.
2. The component that is retained the shortest time in the column is
detected first. The component that is retained the longest time in the
column is detected last.
3. The detector sends a signal to the chart recorder which results in a
peak on the chart paper. The component that is detected first is
recorded first. The component that is detected last is recorded last.
Instrumentation
Sample Injection
A sample port is necessary for introducing the sample at the head of the
column. Modern injection techniques often employ the use of heated sample
ports through which the sample can be injected and vaporized in a near
simultaneous fashion. A calibrated microsyringe is used to deliver a sample
volume in the range of a few microliters through a rubber septum and into
the vaporization chamber. Most separations require only a small fraction of
the initial sample volume and a sample splitter is used to direct excess sample
to waste. Commercial gas chromatographs often allow for both split and
splitless injections when alternating between packed columns and capillary
columns. The vaporization chamber is typically heated 50 °C above the lowest
boiling point of the sample and subsequently mixed with the carrier gas to
transport the sample into the column.
6. Figure 1: A cross-sectional view of a microflash vaporizer direct injector.
Carrier Gas
The carrier gas plays an important role, and varies in the GC used. Carrier gas must
be dry, free of oxygen and chemically inert mobile-phase employed in gas
chromatography. Helium is most commonly used because it is safer than, but
comprable to hydrogen in efficiency, has a larger range of flow rates and is
compatible with many detectors. Nitrogen, argon, and hydrogen are also used
depending upon the desired performance and the detector being used. Both
hydrogen and helium, which are commonly used on most traditional detectors such
as Flame Ionization(FID), thermal conductivity (TCD) and Electron capture (ECD),
provide a shorter analysis time and lower elution temperatures of the sample due to
higher flow rates and low molecular weight. For instance, hydrogen or helium as the
carrier gas gives the highest sensitivity with TCD because the difference in thermal
conductivity between the organic vapor and hydrogen/helium is greater than other
carrier gas. Other detectors such as mass spectroscopy, uses nitrogen or argon
which has a much better advantage than hydrogen or helium due to their higher
molecular weights, in which improve vacuum pump efficiency.
All carrier gasses are available in pressurized tanks and pressure regulators, gages
and flow meters are used to meticulously control the flow rate of the gas. Most gas
supplies used should fall between 99.995% - 99.9995% purity range and contain a
low levels (< 0.5 ppm) of oxygen and total hydrocarbons in the tank. The carrier gas
system contains a molecular sieve to remove water and other impurities. Traps are
another option to keep the system pure and optimum sensitive and removal traces
7. of water and other contaminants. A two stage pressure regulation is required to use
to minimize the pressure surges and to monitor the flow rate of the gas. To monitor
the flow rate of the gas a flow or pressure regulator was also require onto both tank
and chromatograph gas inlet. This applies different gas type will use different type of
regulator.The carrier gas is preheated and filtered with a molecular sieve to remove
impurities and water prior to being introduced to the vaporization chamber. A carrier
gas is typically required in GC system to flow through the injector and push the
gaseous components of the sample onto the GC column, which leads to the detector
( see more detail in detector section).
Gas Recommendations For Capilary Columns
8. Gas Recommendations for Packed Columns
Column Oven
The thermostatted oven serves to control the temperature of the column within a
few tenths of a degree to conduct precise work. The oven can be operated in two
manners: isothermal programming or temperature programming. In isothermal
programming, the temperature of the column is held constant throughout the entire
separation. The optimum column temperature for isothermal operation is about the
middle point of the boiling range of the sample. However, isothermal programming
works best only if the boiling point range of the sample is narrow. If a low
isothermal column temperature is used with a wide boiling point range, the low
boiling fractions are well resolved but the high boiling fractions are slow to elute with
extensive band broadening. If the temperature is increased closer to the boiling
points of the higher boiling components, the higher boiling components elute as
sharp peaks but the lower boiling components elute so quickly there is no
separation.
9. In the temperature programming method, the column temperature is either
increased continuously or in steps as the separation progresses. This method is well
suited to separating a mixture with a broad boiling point range. The analysis begins
at a low temperature to resolve the low boiling components and increases during the
separation to resolve the less volatile, high boiling components of the sample. Rates
of 5-7 °C/minute are typical for temperature programming separations.
Open Tubular Columns and Packed Columns
Open tubular columns, which are also known as capillary columns, come in two basic
forms. The first is a wall-coated open tubular (WCOT) column and the second type is
a support-coated open tubular (SCOT) column. WCOT columns are capillary tubes
that have a thin later of the stationary phase coated along the column walls. In
SCOT columns, the column walls are first coated with a thin layer (about 30
micrometers thick) of adsorbant solid, such as diatomaceous earth, a material which
consists of single-celled, sea-plant skeletons. The adsorbant solid is then treated
with the liquid stationary phase. While SCOT columns are capable of holding a
greater volume of stationary phase than a WCOT column due to its greater sample
capacity, WCOT columns still have greater column efficiencies.
Most modern WCOT columns are made of glass, but T316 stainless steel, aluminum,
copper and plastics have also been used. Each material has its own relative merits
depending upon the application. Glass WCOT columns have the distinct advantage of
chemical etching, which is usually achieved by gaseous or concentrated hydrochloric
acid treatment. The etching process gives the glass a rough surface and allows the
bonded stationary phase to adhere more tightly to the column surface.
10. One of the most popular types of capillary columns is a special WCOT column called
the fused-silica wall-coated (FSWC) open tubular column. The walls of the fused-
silica columns are drawn from purified silica containing minimal metal oxides. These
columns are much thinner than glass columns, with diameters as small as 0.1 mm
and lengths as long as 100 m. To protect the column, a polyimide coating is applied
to the outside of the tubing and bent into coils to fit inside the thermostatted oven
of the gas chromatography unit. The FSWC columns are commercially available and
currently replacing older columns due to increased chemical inertness, greater
column efficiency and smaller sampling size requirements. It is possible to achieve
up to 400,000 theoretical plates with a 100 m WCOT column, yet the world record
for the largest number of theoretical plates is over 2 million plates for 1.3 km section
of column.
Packed columns are made of a glass or a metal tubing which is densely packed with
a solid support like diatomaceous earth. Due to the difficulty of packing the tubing
uniformly, these types of columns have a larger diameter than open tubular columns
and have a limited range of length. As a result, packed columns can only achieve
about 50% of the efficiency of a comparable WCOT column. Furthermore, the
diatomaceous earth packing is deactivated over time due to the semi-permanent
adsorption of impurities within the column. In contrast, FSWC open tubular columns
are manufactured to be virtually free of these adsorption problems.
Figure 4. Properties of gas chromatography columns.
11. Figure 5. Computer Generated Image of a FSWC column (specialized for
measuring BAC levels)
Figure 6. Computer Generated Image of a FSWC column (specialized to
withstand extreme heat)
Different types of columns can be applied for different fields. Depending on the type
of sample, some GC columns are better than the others. For example, the FSWC
column shown in Figure 5 is designed specially for blood alcohol analysis. It
produces fast run times with baseline resolution of key components in under 3
minutes. Moreover, it displays enhanced resolutions of ethanol and acetone peaks,
which helps with determining the BAC levels. This particular column is known as
Zebron-BAC and it made with polyimide coating on the outside and the inner layer is
made of fused silica and the inner diameter ranges from .18 mm to .25 mm. There
are also many other Zebron brand columns designed for other purposes.
Another example of a Zebron GC column is known as the Zebron-inferno. Its outer
layer is coated with a special type of polyimide that is designed to withstand high
temperatures. As shown in figure 6, it contains an extra layer inside. It can
withstand up to 430 °C to be exact and it is designed to provide true boiling point
separation of hydrocarbons distillation methods. Moreover, it is also used for acidic
and basic samples.
Detection Systems
The detector is the device located at the end of the column which provides a
quantitative measurement of the components of the mixture as they elute in
combination with the carrier gas. In theory, any property of the gaseous mixture
that is different from the carrier gas can be used as a detection method. These
detection properties fall into two categories: bulk properties and specific properties.
Bulk properties, which are also known as general properties, are properties that both
the carrier gas and analyte possess but to different degrees. Specific properties,
such as detectors that measure nitrogen-phosphorous content, have limited
applications but compensate for this by their increased sensitivity.
12. Each detector has two main parts that when used together they serve as
transducers to convert the detected property changes into an electrical signal that is
recorded as a chromatogram. The first part of the detector is the sensor which is
placed as close the the column exit as possible in order to optimize detection. The
second is the electronic equipment used to digitize the analog signal so that a
computer may analyze the acquired chromatogram. The sooner the analog signal is
converted into a digital signal, the greater the signal-to-noise ratio becomes, as
analog signal are easily susceptible to many types of interferences.
An ideal GC detector is distinguished by several characteristics. The first requirement
is adequate sensitivity to provide a high resolution signal for all components in the
mixture. This is clearly an idealized statement as such a sample would approach zero
volume and the detector would need infinite sensitivity to detect it. In modern
instruments, the sensitivities of the detectors are in the range of 10-8 to 10-15 g of
solute per second. Furthermore, the quantity of sample must be reproducible and
many columns will distort peaks if enough sample is not injected. An ideal column
will also be chemically inert and and should not alter the sample in any way.
Optimized columns will be able to withstand temperatures in the range of -200 °C to
at least 400 °C. In addition, such a column would have a short linear response time
that is independent of flow rate and extends for several orders of magnitude.
Moreover, the detector should be reliable, predictable and easy to operate.
Understandably, it is not possible for a detector meet all of these requirements. The
next subsections will discuss some of the more common types of gas
chromatography detectors and the relative advantages and/or disadvantages of
each.
Type of Detector Applicable Samples Detection Limit
Mass Spectrometer (MS) Tunable for any sample .25 to 100 pg
Flame Ionization (FID) Hydrocarbons 1 pg/s
Thermal Conductivity (TCD) Universal 500 pg/ml
Electron-Capture (ECD) Halogenated hydrocarbons 5 fg/s
Atomic Emission (AED) Element-selective 1 pg
Chemiluminescence (CS) Oxidizing reagent Dark current of PMT
Photoionization (PID) Vapor and gaseous
Compounds
.002 to .02 µg/L
Mass Spectrometry Detectors
Mass Spectrometer (MS) detectors are most powerful of all gas chromatography
detectors. In a GC/MS system, the mass spectrometer scans the masses
continuously throughout the separation. When the sample exits the chromatography
column, it is passed through a transfer line into the inlet of the mass spectrometer .
13. The sample is then ionized and fragmented, typically by an electron-impact ion
source. During this process, the sample is bombarded by energetic electrons which
ionize the molecule by causing them to lose an electron due to electrostatic
repulsion. Further bombardment causes the ions to fragment. The ions are then
passed into a mass analyzer where the ions are sorted according to their m/z value,
or mass-to-charge ratio. Most ions are only singly charged.
The Chromatogram will point out the retention times and the mass spectrometer will
use the peaks to determine what kind of molecules are exist in the mixture. The
figure below represents a typical mass spectrum of water with the absorption peaks
at the appropriate m/z ratios.
Figure 8. Mass Spectrum of Water
Instrumentation
One of the most common types of mass analyzer in GC/MS is the quadrupole ion-
trap analyzer, which allows gaseous anions or cations to be held for long periods of
time by electric and magnetic fields. A simple quadrupole ion-trap consists of a
hollow ring electrode with two grounded end-cap electrodes as seen in figure #.
Ions are allowed into the cavity through a grid in the upper end cap. A variable
radio-frequency is applied to the ring electrode and ions with an appropriate m/z
value orbit around the cavity. As the radio-frequency is increased linearly, ions of a
stable m/z value are ejected by mass-selective ejection in order of mass. Ions that
are too heavy or too light are destabilized and their charge is neutralized upon
collision with the ring electrode wall. Emitted ions then strike an electron multiplier
which converts the detected ions into an electrical signal. This electrical signal is
then picked up by the computer through various programs. As an end result, a
chromatogram is produced representing the m/z ratio versus the abundance of the
sample.
14. GC/MS units are advantageous because they allow for the immediate determination
of the mass of the analyte and can be used to identify the components of incomplete
separations. They are rugged, easy to use and can analyze the sample almost as
quickly as it is eluted. The disadvantages of mass spectrometry detectors are the
tendency for samples to thermally degrade before detection and the end result of
obliterating all the sample by fragmentation.
Flame Ionization Detectors
Flame ionization detectors (FID) are the most generally applicable and most widely
used detectors. In a FID, the sample is directed at an air-hydrogen flame after
exiting the column. At the high temperature of the air-hydrogen flame, the sample
undergoes pyrolysis, or chemical decomposition through intense heating. Pyrolized
15. hydrocarbons release ions and electrons that carry current. A high-impedance
picoammeter measures this current to monitor the sample's elution.
It is advantageous to use FID because the detector is unaffected by flow rate,
noncombustible gases and water. These properties allow FID high sensitivity and low
noise. The unit is both reliable and relatively easy to use. However, this technique
does require flammable gas and also destroys the sample.
Thermal Conductivity Detectors
Thermal conductivity detectors (TCD) were one the earliest detectors developed for
use with gas chromatography. The TCD works by measuring the change in carrier
gas thermal conductivity caused by the presence of the sample, which has a
different thermal conductivity from that of the carrier gas. Their design is relatively
simple, and consists of an electrically heated source that is maintained at constant
power. The temperature of the source depends upon the thermal conductivities of
the surrounding gases. The source is usually a thin wire made of platinum, gold or .
The resistance within the wire depends upon temperature, which is dependent upon
the thermal conductivity of the gas.
TCDs usually employ two detectors, one of which is used as the reference for the
carrier gas and the other which monitors the thermal conductivity of the carrier gas
and sample mixture. Carrier gases such as helium and hydrogen has very high
thermal conductivities so the addition of even a small amount of sample is readily
detected.
16. The advantages of TCDs are the ease and simplicity of use, the devices' broad
application to inorganic and organic compounds, and the ability of the analyte to be
collected after separation and detection. The greatest drawback of the TCD is the
low sensitivity of the instrument in relation to other detection methods, in addition to
flow rate and concentration dependency.
Chromatogram
Figure 13 represents a standard chromatogram produced by a TCD detector. In a
standard chromatogram regardless of the type detector, the x-axis is the time and
the y-axis is the abundance or the absorbance. From these chromatograms,
17. retention times and the peak heights are determined and used to further investigate
the chemical properties or the abundance of the samples.
Electron-capture Detectors
Electron-capture detectors (ECD) are highly selective detectors commonly used for
detecting environmental samples as the device selectively detects organic
compounds with moieties such as halogens, peroxides, quinones and nitro groups
and gives little to no response for all other compounds. Therefore, this method is
best suited in applications where traces quantities of chemicals such as pesticides
are to be detected and other chromatographic methods are unfeasible.
The simplest form of ECD involves gaseous electrons from a radioactive ? emitter in
an electric field. As the analyte leaves the GC column, it is passed over this ?
emitter, which typically consists of nickle-63 or tritium. The electrons from the ?
emitter ionize the nitrogen carrier gas and cause it to release a burst of electrons. In
the absence of organic compounds, a constant standing current is maintained
between two electrodes. With the addition of organic compounds with
electronegative functional groups, the current decreases significantly as the
functional groups capture the electrons.
The advantages of ECDs are the high selectivity and sensitivity towards certain
organic species with electronegative functional groups. However, the detector has a
limited signal range and is potentially dangerous owing to its radioactivity. In
addition, the signal-to-noise ratio is limited by radioactive decay and the presence of
O2 within the detector.
Atomic Emission Detectors
18. Atomic emission detectors (AED), one of the newest addition to the gas
chromatographer's arsenal, are element-selective detectors that utilize plasma,
which is a partially ionized gas, to atomize all of the elements of a sample and excite
their characteristic atomic emission spectra. AED is an extremely powerful alternative
that has a wider applicability due to its based on the detection of atomic
emissions.There are three ways of generating plasma: microwave-induced plasma
(MIP), inductively coupled plasma (ICP) or direct current plasma (DCP). MIP is the
most commonly employed form and is used with a positionable diode array to
simultaneously monitor the atomic emission spectra of several elements.
Instrumentation
The components of the Atomic emission detectors include 1) an interface for the
incoming capillary GC column to induce plasma chamber,2) a microwave chamber,
3) a cooling system, 4) a diffration grating that associated optics, and 5) a position
adjustable photodiode array interfaced to a computer.
GC Chemiluminescence Detectors
Chemiluminescence spectroscopy (CS) is a process in which both qualitative and
quantitative properties can be be determined using the optical emission from excited
chemical species. It is very similar to AES, but the difference is that it utilizes the
light emitted from the energized molecules rather than just excited molecules.
Moreover, chemiluminescence can occur in either the solution or gas phase whereas
AES is designed for gaseous phases. The light source for chemiluminescence comes
from the reactions of the chemicals such that it produces light energy as a product.
This light band is used instead of a separate source of light such as a light beam.
19. Like other methods, CS also has its limitations and the major limitation to the
detection limits of CS concerns with the use of a photomultiplier tube (PMT). A PMT
requires a dark current in it to detect the light emitted from the analyte.
Photoionization Detectors
Another different kind of detector for GC is the photoionization detector which
utilizes the properties of chemiluminescence spectroscopy. Photoionization detector
(PID) is a portable vapor and gas detector that has selective determination of
aromatic hydrocarbons, organo-heteroatom, inorganice species and other organic
compounds. PID comprise of an ultrviolet lamp to emit photons that are absorbed by
the compounds in an ionization chamber exiting from a GC column. Small fraction of
the analyte molecules are actually ionized, nondestructive, allowing confirmation
analytical results through other detectors. In addition, PIDs are available in portable
hand-held models and in a number of lamp configurations. Results are almost
immediate. PID is used commonly to detect VOCs in soil, sediment, air and water,
which is often used to detect contaminants in ambient air and soil. The disavantage
of PID is unable to detect certain hydrocarbon that has low molecular weight, such
as methane and ethane.
Instrumentation
20. Adding mass spectrometry to gas chromatography
(GC-MS)
Mass spectrometry (MS) is an analytical technique that can be hyphenated to a GC and used
instead of the GC detector. The neutral molecules elute from the analytical column and are
ionised in the ion source to produce molecular ions which can degrade into fragment ions.
The fragment and molecular ions are then separated in the mass analyser by their
mass:charge (m/z) ratio and are detected. Data from a GC-MS is three dimensional,
providing mass spectra that can be used for identity confirmation, to identify unknown
analytes and to determine structural and chemical properties of molecules, as well as the
chromatogram that can be used for qualitative and quantitative analysis.
How do you read a chromatogram and what does it
tell you?
21. Much information can be gained from the chromatogram on the health of the GC or
GC-MS system as well as the data required to perform qualitative or quantitative
analysis.
The x-axis is the retention time, taken from the time the sample was injected into the GC
(t0) to the end of the GC run. Each analyte peak has a retention time measured from the
apex of the peak, for example tR. The y-axis is the measured response of the analyte peak in
the detector. The baseline shows the signal from the detector when no analyte is eluting
from the column, or it is below the detection limit. The baseline response is a mix of
electrical noise (usually low) and chemical noise, such as impurities in the carrier gas,
column stationary phase bleed and systemcontamination. Hence, if the baseline is higher
than it should be, it is an indication of a problem or that maintenance is required. Various
measurements can be taken from the peak, such as width at the baseline, width at half
height, total height and area. The latter two are proportional to the concentration, however
it is the area that is used for quantitation as it is less affected by band broadening. The
measurements can be used to calculate the extent of band broadening, the spread of the
analyte molecules on the column. Narrower, sharper peaks give better sensitivity (signal to
noise ratio) and better resolution (peak separation). The peaks shown are Gaussian,
however peak tailing (the right side of the peak is wider) indicates activity or a dead volume
in the system, whereas a peak fronting (the left side of the peak is wider) indicates the
column is overloaded. Accurate measurements are affected by the number of data points
across a peak, with an ideal number being 15-25. Too few, makes the peak look like a child’s
join-the-dots drawing, affecting peak area, resolution and, with GC-MS, deconvolution. Too
many reduces the signal to noise, reducing sensitivity. For GC-MS data, each data point is a
mass spectrum, the third dimension of data.
Applications
GC analysis is used to calculate the content of a chemical product, for
example in assuring the quality of products in the chemical industry;
or measuring toxic substances in soil, air or water.
Gas chromatography is used in the analysis of:
(a) air-borne pollutants
(b) performance-enhancing drugs in athlete’s urine samples
(c) oil spills
(d) essential oils in perfume preparation
GC is very accurate if used properly and can measure picomoles of a
substance in a 1 ml liquid sample, or parts-per-billion concentrations
in gaseous samples.
22. Gas Chromatography is used extensively in forensic science.
Disciplines as diverse as solid drug dose (pre-consumption form)
identification and quantification, arson investigation, paint chip
analysis, and toxicology cases, employ GC to identify and quantify
various biological specimens and crime-scene evidence.
Advantages
The use of longer columns and higher velocity of carrier gas permits
the fast separation in a matter of a few minutes.
Higher working temperatures up to 5000C and the possibility of
converting any material into a volatile component make gas
chromatography one of the most versatile techniques.
GC is popular for environmental monitoring and industrial applications
because it is very reliable and can be run nearly continuously.
GC is typically used in applications where small, volatile molecules are
detected and with non-aqueous solutions.
GC is favored for non-polar molecules.
Limitations
Compound to be analyzed should be stable under GC operation
conditions.
They should have a vapor pressure significantly greater than zero.
Typically, the compounds analyzed are less than 1,000 Da, because it
is difficult to vaporize larger compounds.
The samples are also required to be salt-free; they should not
contain ions.
Very minute amounts of a substance can be measured, but it is often
required that the sample must be measured in comparison to a
sample containing the pure, suspected substance known as
a reference standard.