Download to read offline
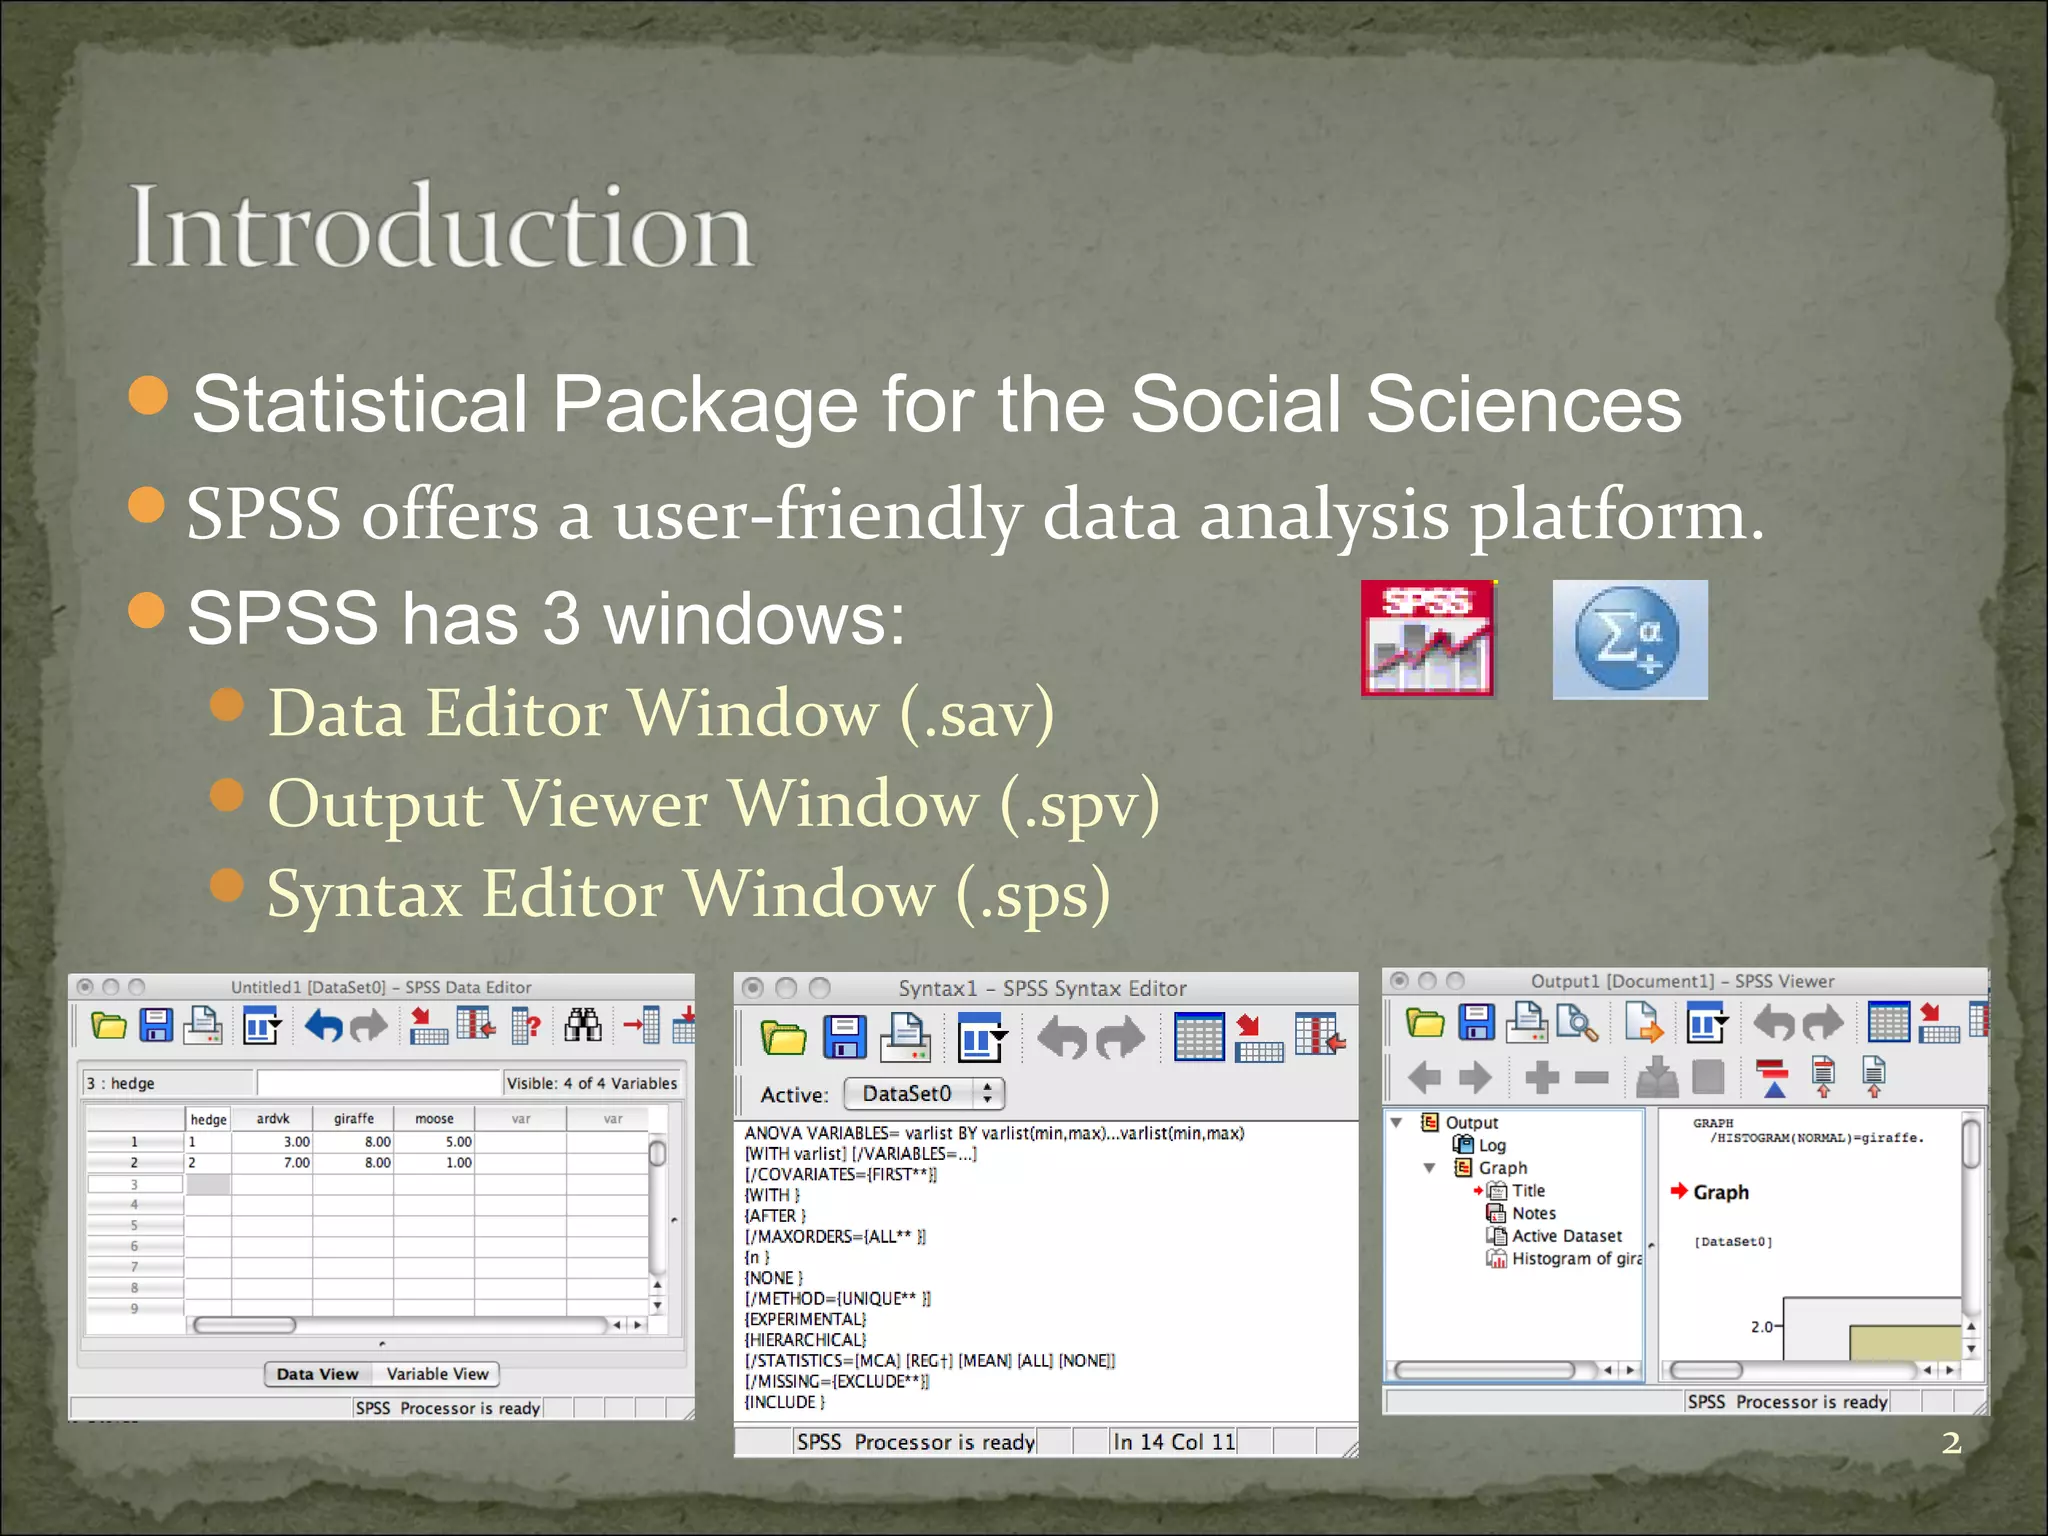
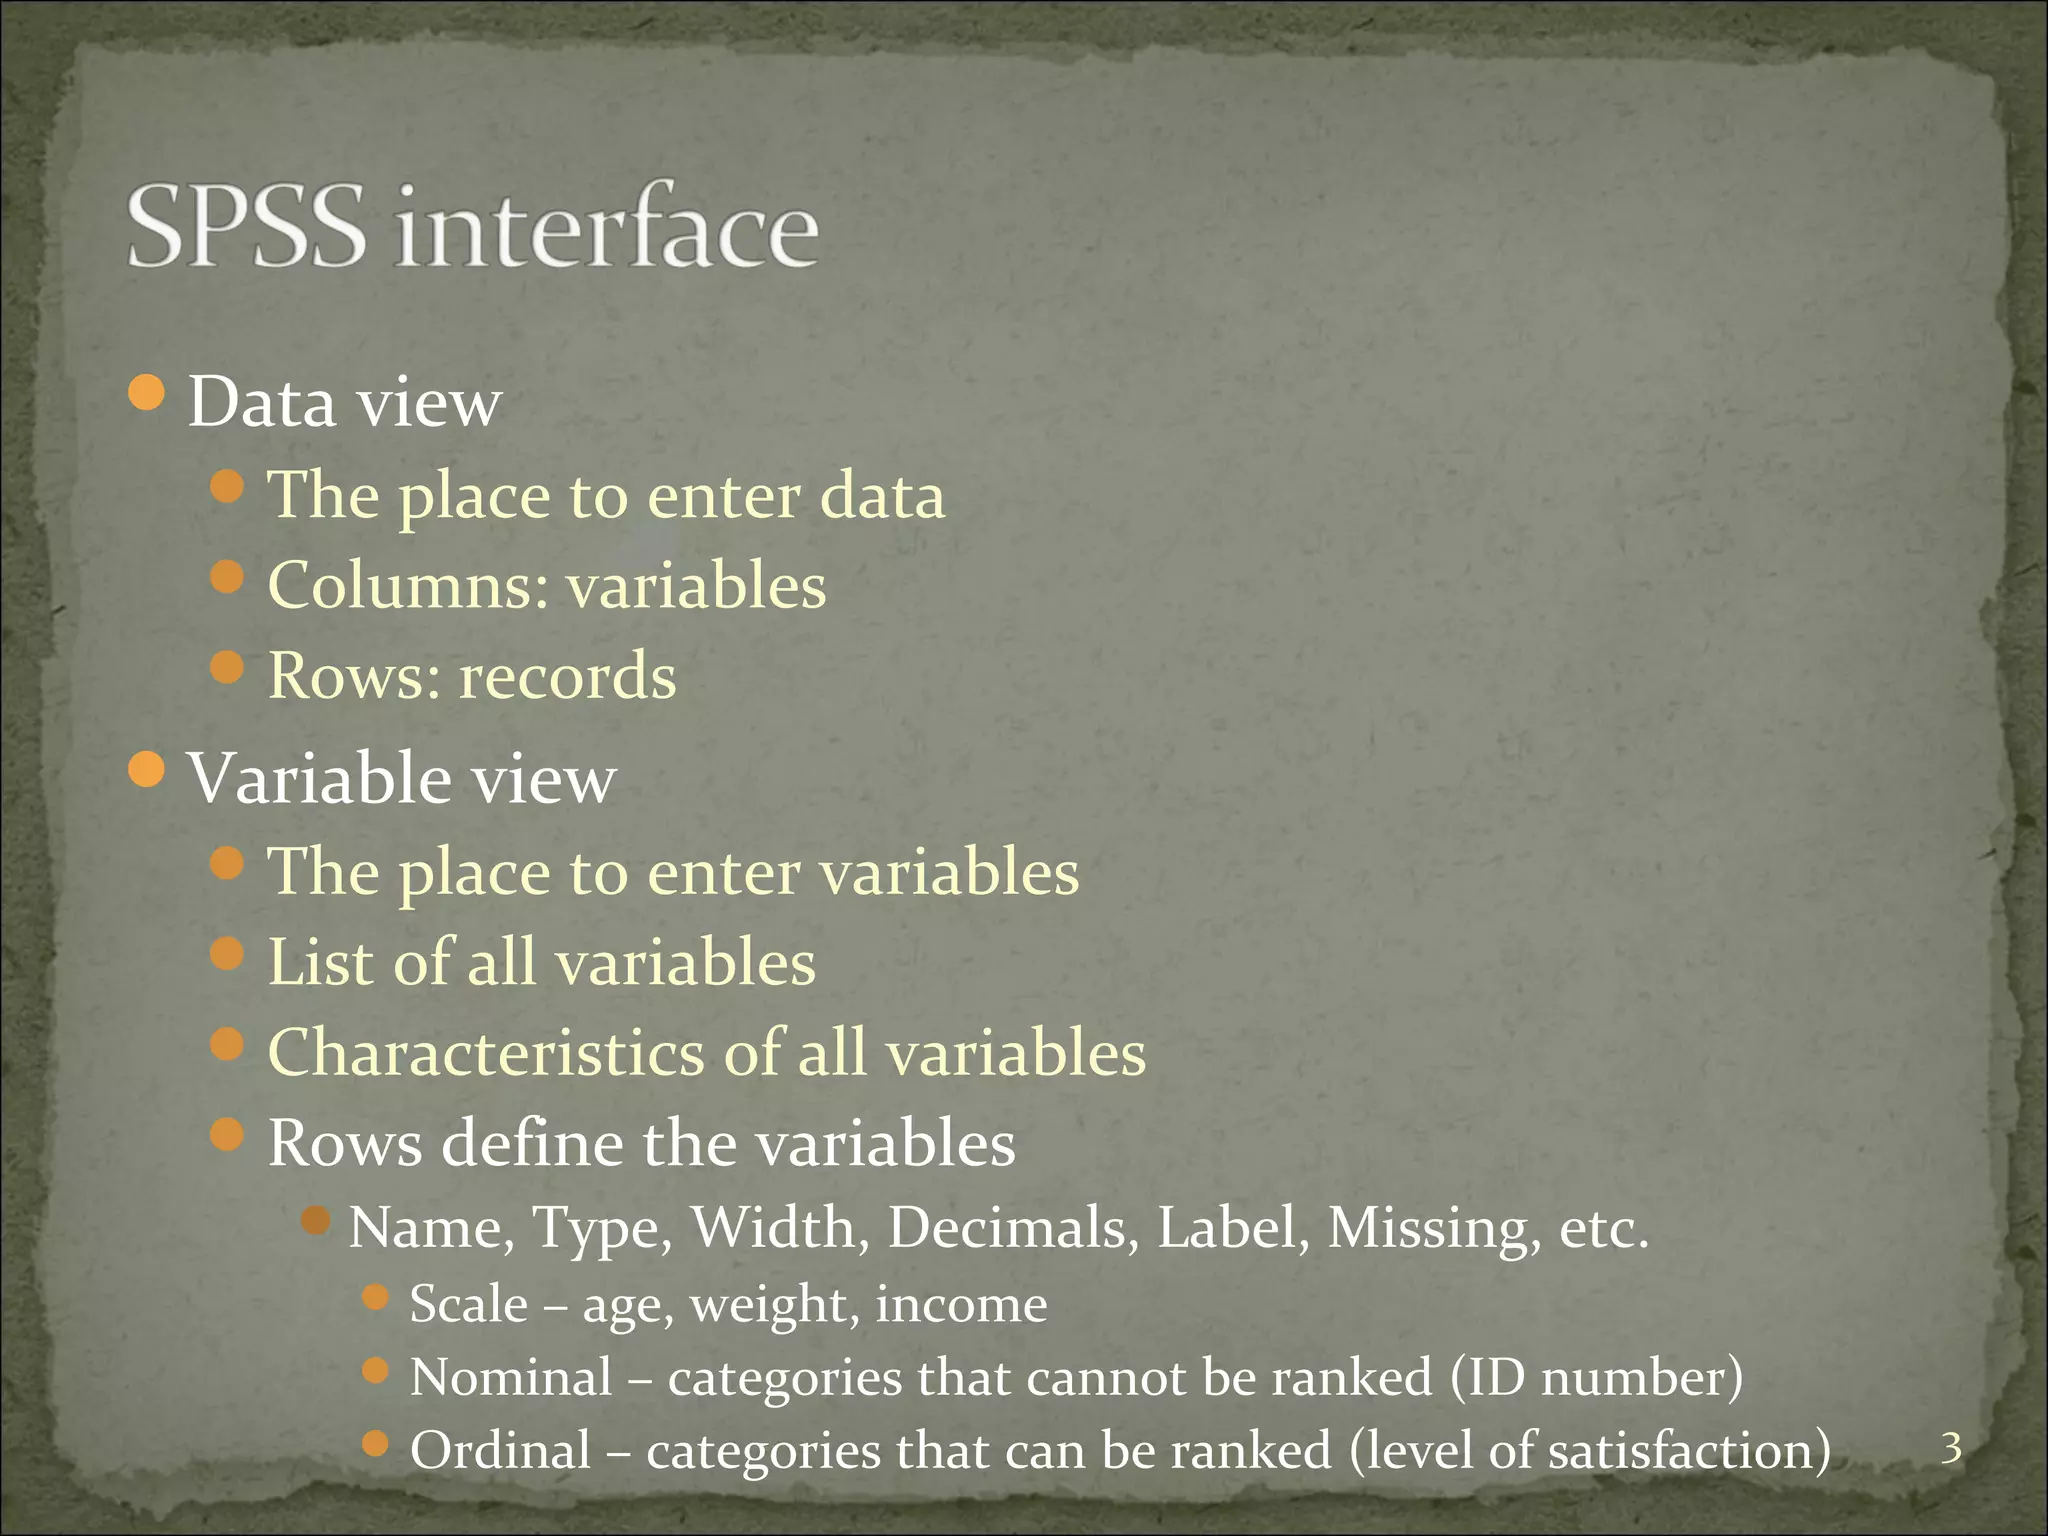


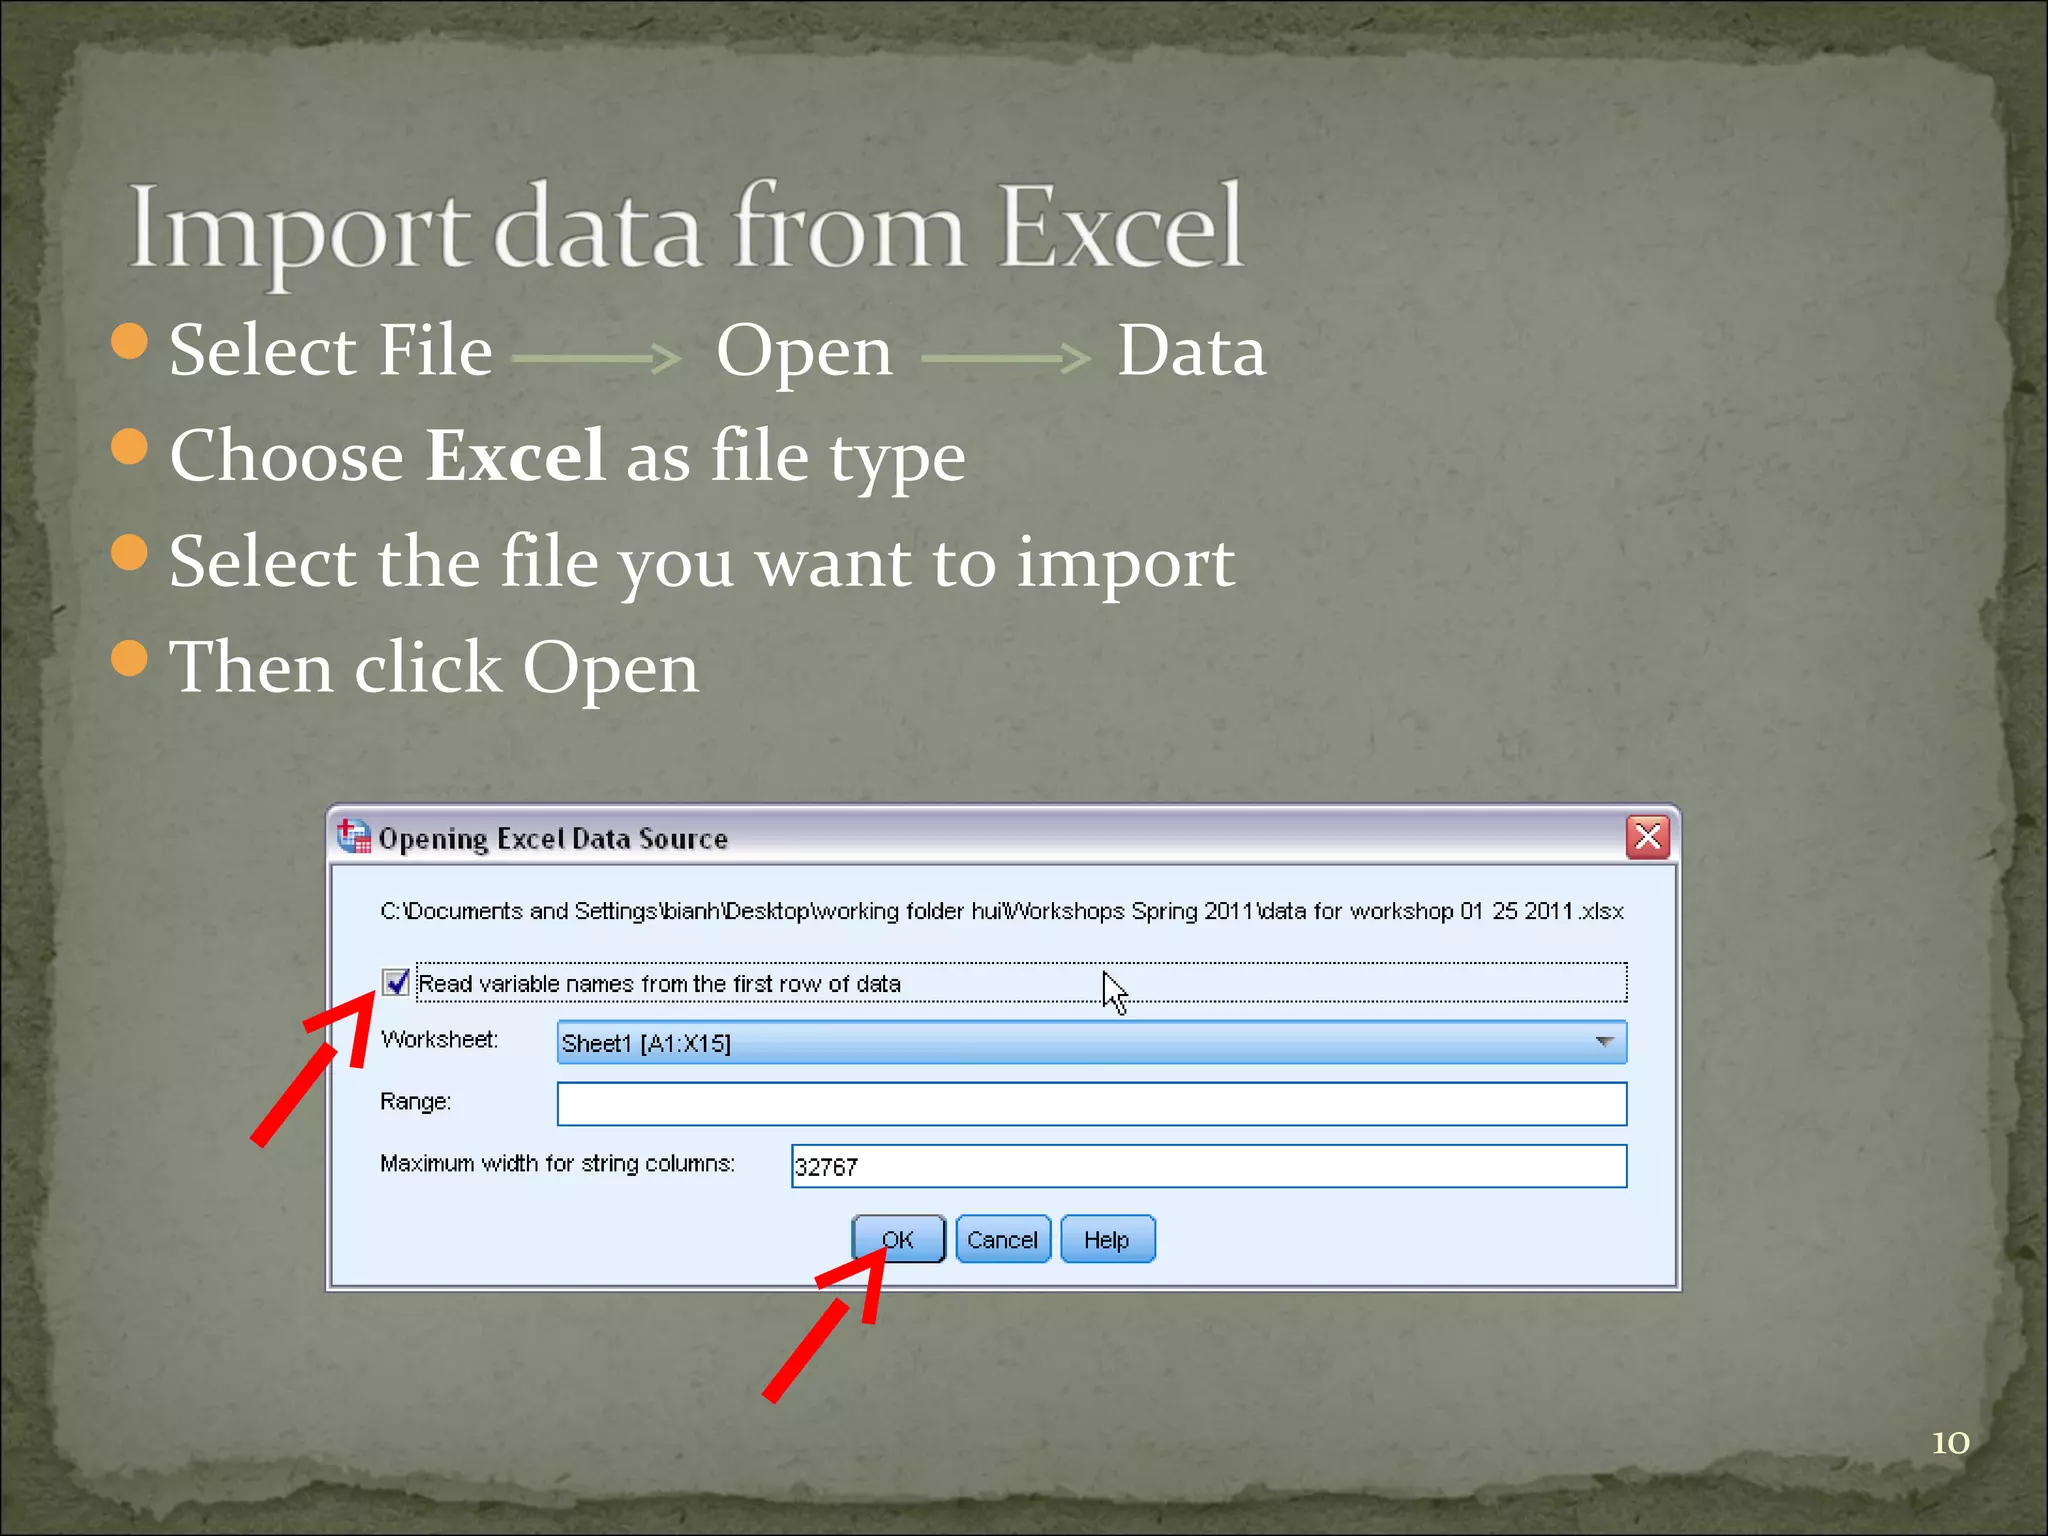


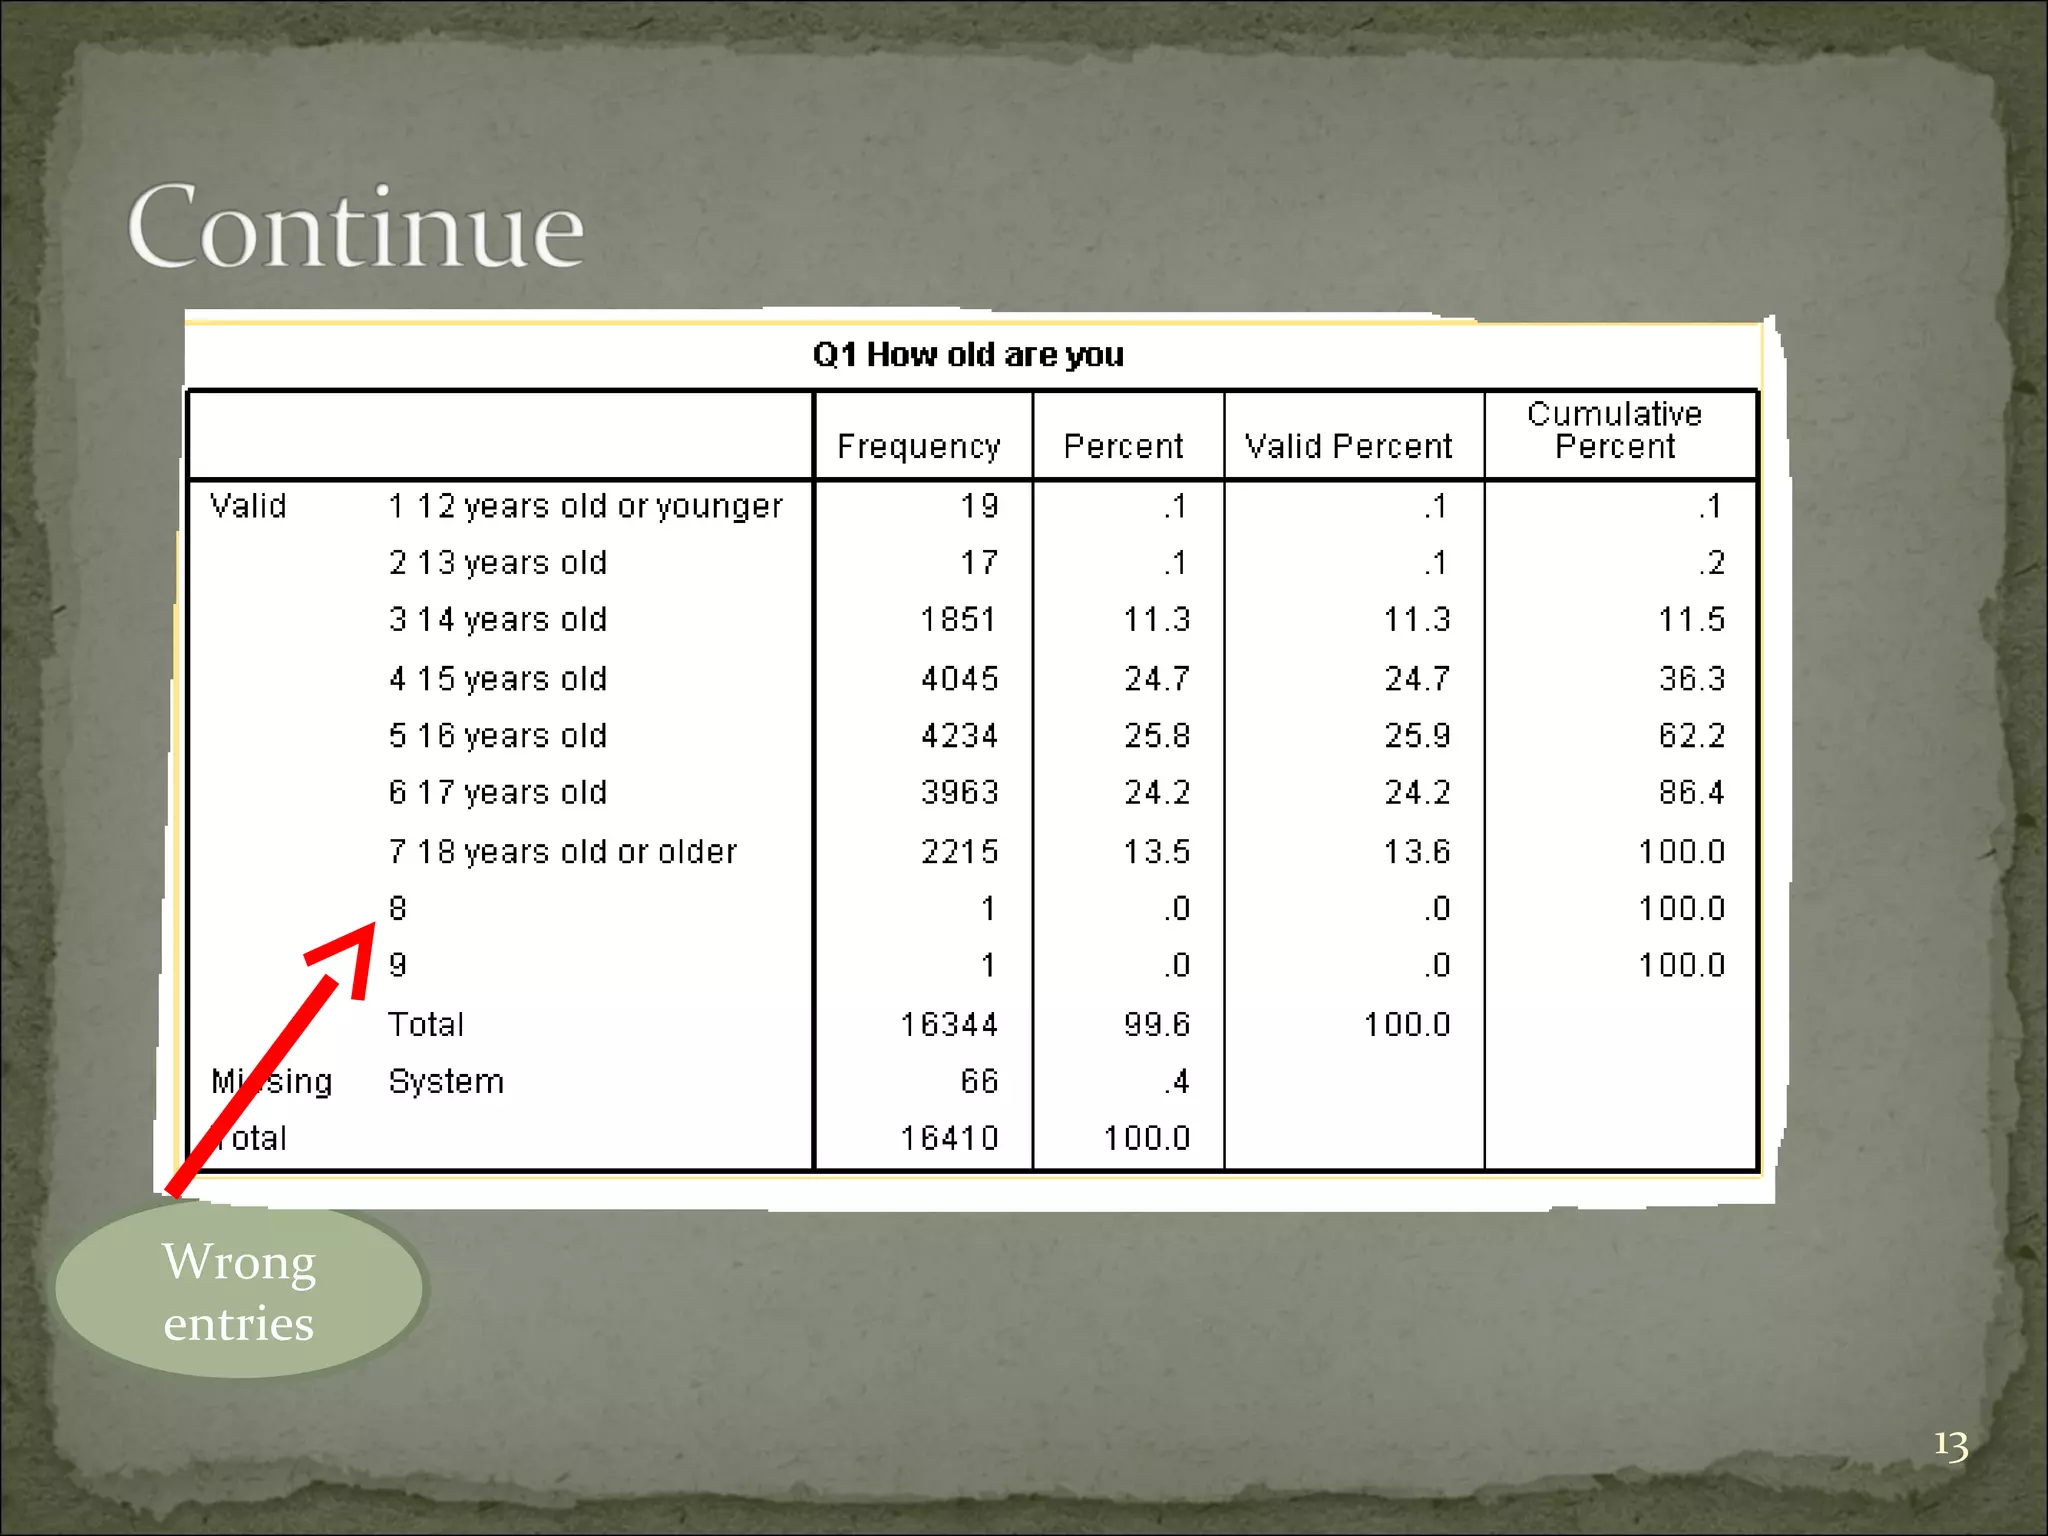


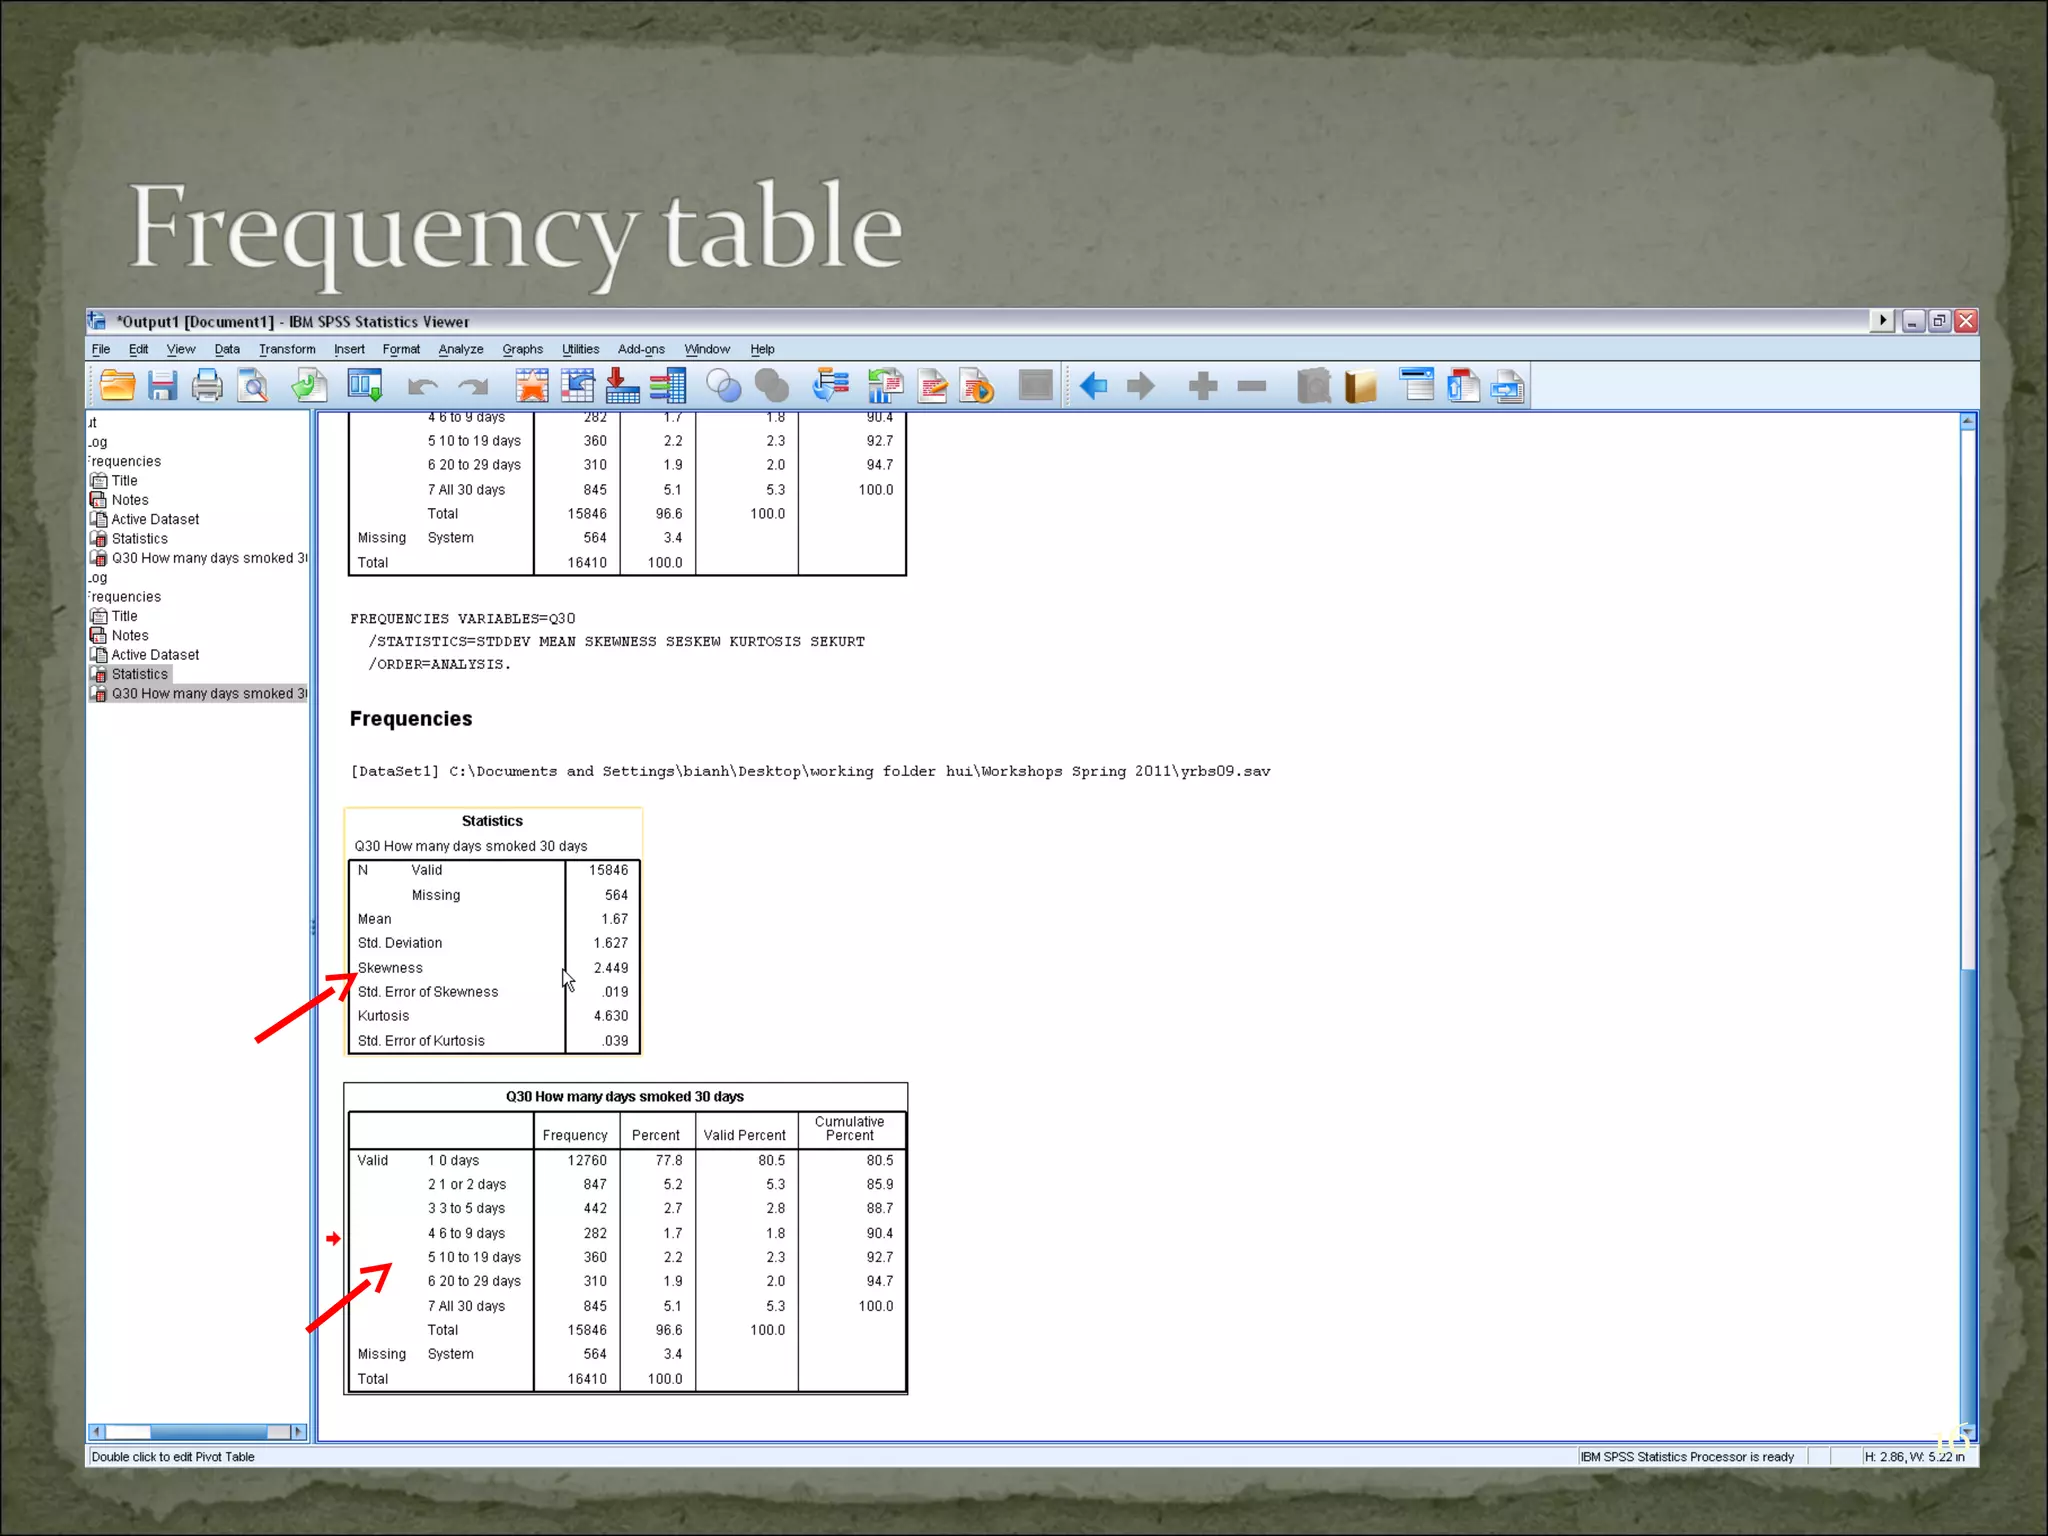


This document provides an overview of using the Statistical Package for the Social Sciences (SPSS) for data analysis. It details the functionality of various windows in SPSS, including data entry, variable management, and the importance of a code book for organizing variables and their characteristics. Additionally, it offers guidelines on importing data, running descriptive statistics, and managing variable labels and values.


![SPSS Lecture_1 [Autosaved].pptx](https://cdn.slidesharecdn.com/ss_thumbnails/spsslecture1autosaved-231105165336-b29c7b18-thumbnail.jpg?width=640&height=640&fit=bounds)