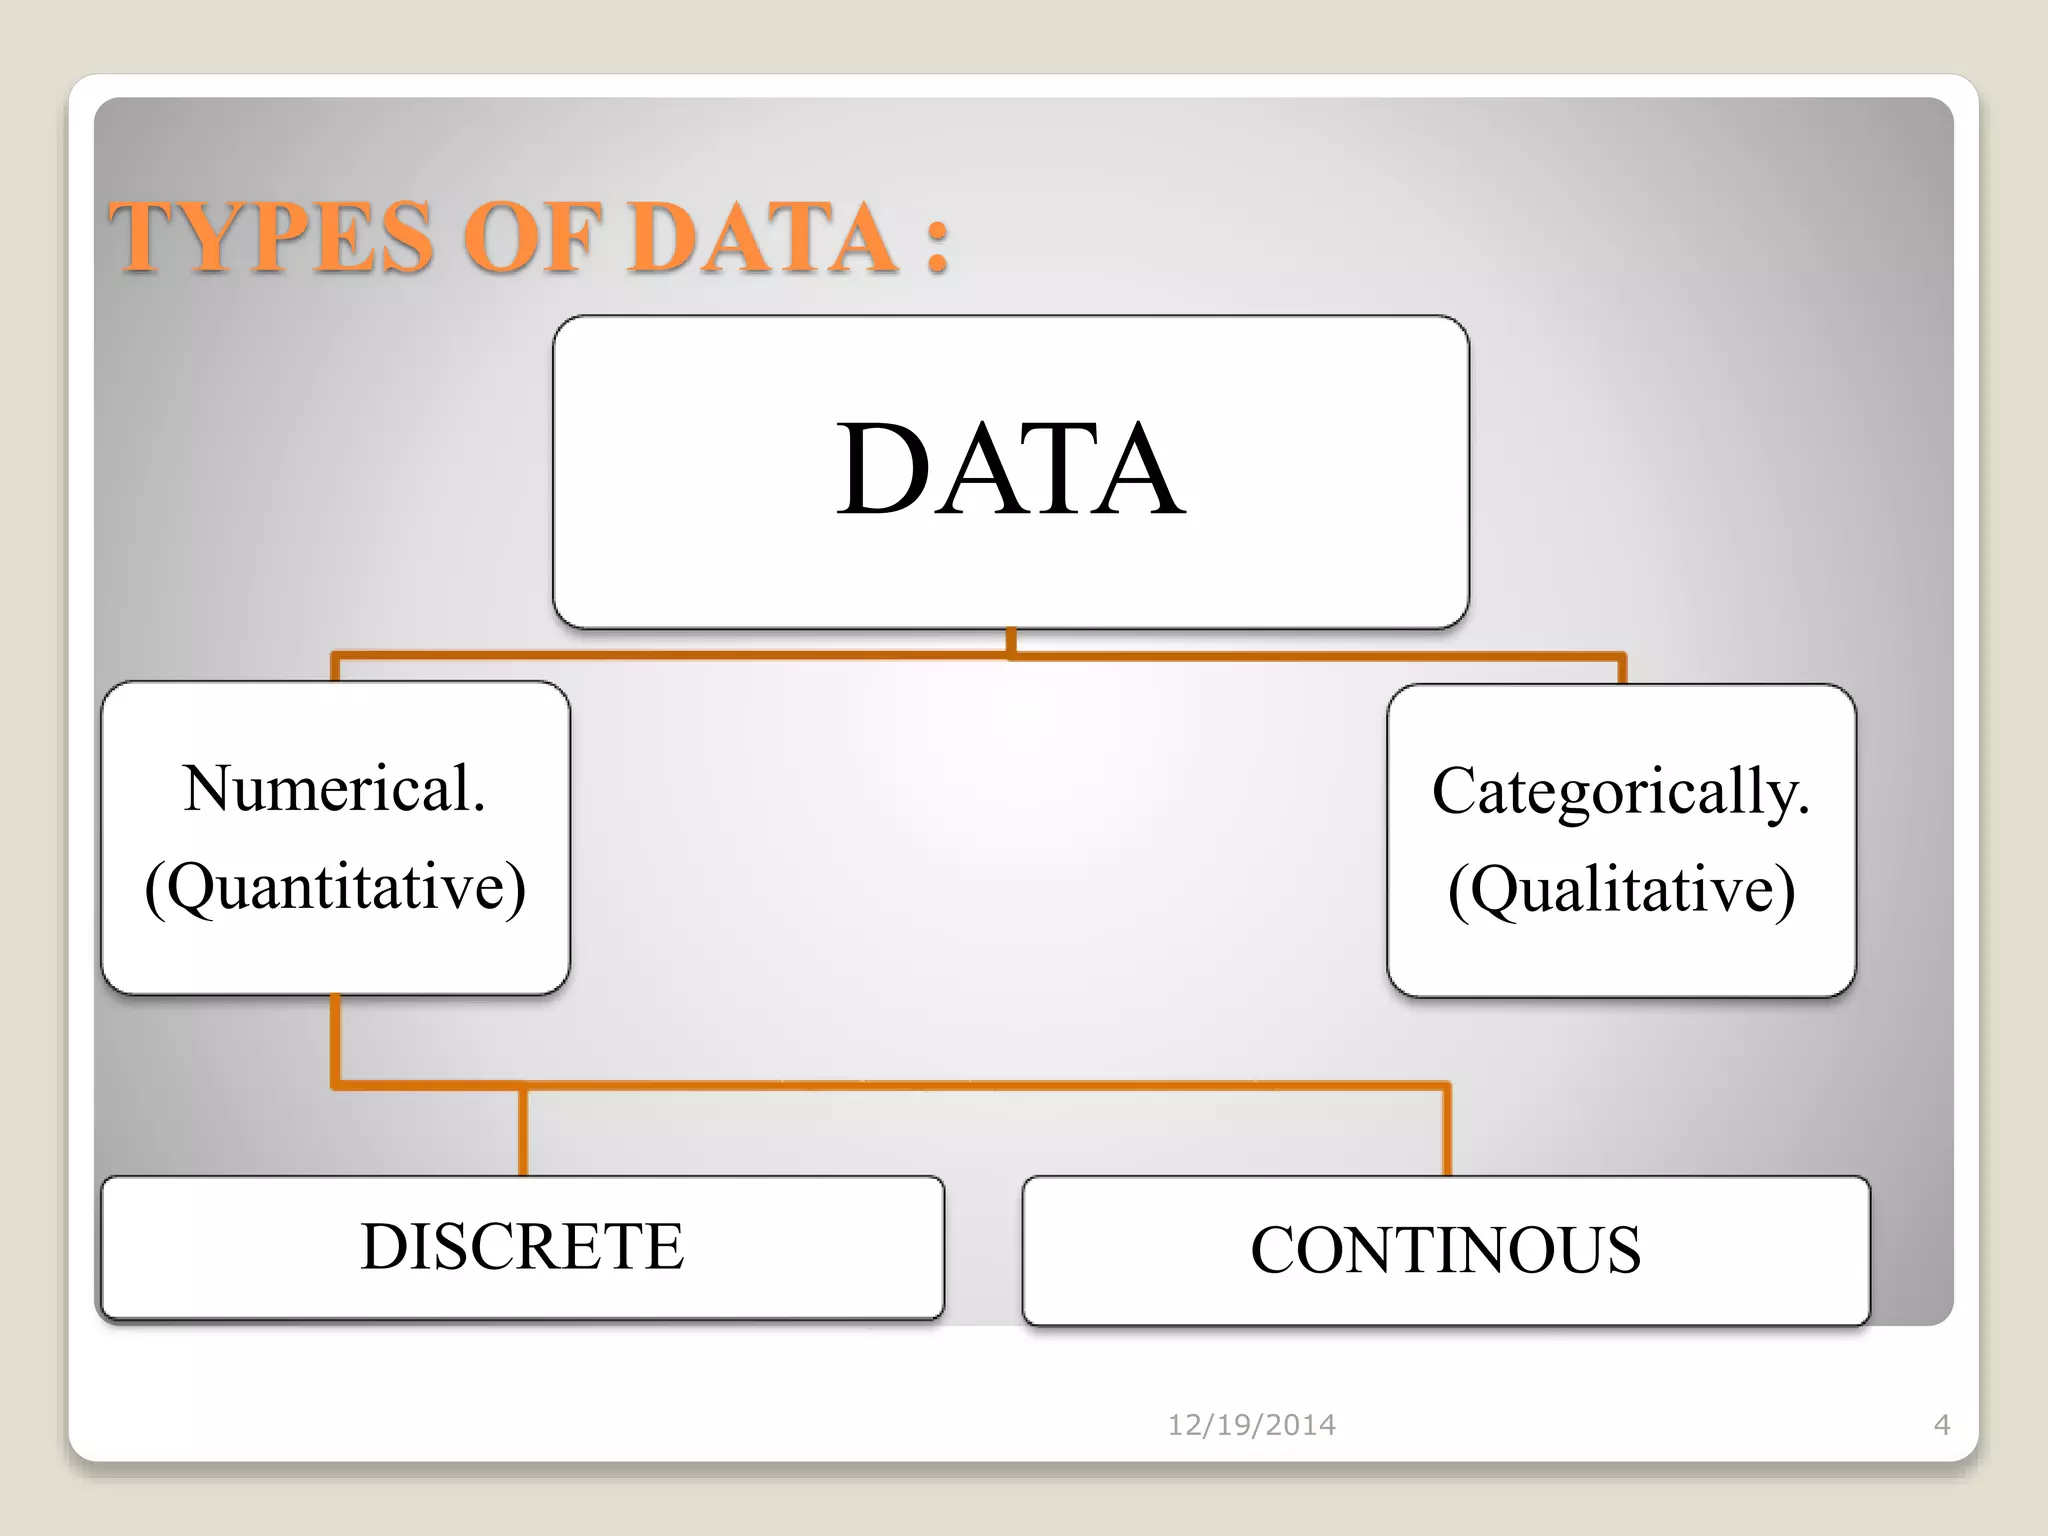
DATA MANAGEMENT AND
PRESENTATION.
Presented By:
Mian Muhammad Syed Hassan Iqbal.
Naveed Iqbal.
Yaser Ud-din.
Faisal Zahir.
Mehboob Ali.
Aftab Ahmad.
Royal College Of Nursing (SSSS).
OBJECTIVES:
 By the end of presentation the students will be able to:
 Define the term data ?? ??
 Discuss the types of data and various methods of data
collection ?? ??
 Discuss the different means and interpretation of data
presentation through:
Tables ?? ??
Graphs ?? ??
Charts ?? ??
12/19/2014 2
“DATA”
 Data is a collection of facts, such as values or measurements.
 It can Be:
o Numbers, words, measurements, observations or even just
descriptions of things.
 Simply data is information.
12/19/2014 3
TYPES OF DATA :
DATA
Numerical.
(Quantitative)
DISCRETE CONTINOUS
Categorically.
(Qualitative)
12/19/2014 4
QUALITATIVE vs. QUANTITATIVE:
 Data can be qualitative or quantitative.
• Qualitative data is descriptive information.
(It describes something).
• Quantitative data is numerical information.
(Numbers).
12/19/2014 5
CONT. . .
1. Qualitative Data. 2. Quantitative Data
12/19/2014 6
 OVERVIEW:
 Deals with descriptions.
 Data can be observed but
measured.
 Colors, textures, smells, tastes,
Appearance, beauty etc.
 Qualitative Quality
 OVERVIEW:
 Deals with numbers.
 Data which can be measured.
 Length, height, area, weight,
temperature, speed, time, ages,
members, etc.
 Quantitative. Quantity
QUANTITATIVE DATA CAN ALSO BE:
 Discrete or Continuous.
 Discrete data can only takes certain values.
(Like whole numbers).
 Continuous data can take any value.
(Within a range).
a) Discrete data is counted.
b) Continuous data is measured.
12/19/2014 7
EXAMPLE:
12/19/2014 8
 What do we know about the tiger?? ??
1. Qualitative:
• He is brown & black.
• He has long hairs.
• He has lot of energy.
EXAMPLE:
12/19/2014 9
2) Quantitative:
a) Discrete:
 He has 4 legs.
 He has 2 brothers.
b) Continuous:
 He weighs 400 pound.
 He is 3.5 feet tall.
ANOTHER TYPES OF DATA :
SPATIAL DATA. DEFINITIVE DATA.
12/19/2014 10
 Which is normally presented
on maps and plans and
provides an indication of
where things are.
 Usually provide in the form
of a drawing, which define a
particular item and the way
in which it has been or is to
be build.
METHODS OF DATA COLLECTION:
OBSTRUCTIVE UNOBSTRUCTIVE
12/19/2014 11
 Obtrusive data collection
methods that directly obtain
information from those
being evaluated e.g.
interviews, surveys, focus
groups, observation, case
study, questionnaires.
Unobtrusive data
collection methods that do
not collect information
directly from evaluees.
e.g. : Document analysis,
observation at a distance.
DATA COLLECTION TOOLS:
 Participatory Methods.
 Records and Secondary Data.
 Observation.
 Surveys and Interviews.
 Focus Groups.
 Diaries, Journals, Self-reported Checklists.
12/19/2014 12
CONT. . .
 Expert Judgment.
 Delphi Technique.
 Other Tools.
-scales (weight).
- tape measure.
- stop watches.
- chemical tests :
i.e. quality of water.
12/19/2014 13
- health testing tools:
i.e. blood pressure.
-citizen report cards.
DATA PRESENTATIONS:
1. TABLES.
2. GRAPH.
3. CHART.
12/19/2014 14
DATA PRESENTATIONS:
 Tables:
◦ Simplest way to summarize data.
◦ Data are presented as absolute numbers or percentages.
12/19/2014 15
 Adults and children with HIV/AIDS by region in Country Y,
end year X:
EXAMPLE: TABLE.
Region Adults and adolescents ≥ 15 years Children <15 years Total
1 14 800 200 15 000
2 400 000 20 000 420 000
3 997 000 3 000 1 000 000
4 985 000 15 000 1 000 000
5 1 460 000 40 000 1 500 000
6 465 000 35 000 500 000
7 940 000 10 000 950 000
8 380 000 220 000 600 000
9 900 000 600 000 1 500 000
10 545 000 5 000 550 000
Total 7 086 800 948 200 8 035 000
12/19/2014 16
CHARTS AND GRAPS:
 Charts and graphs:
◦ Visual representation of data.
◦ Data are presented as absolute numbers or percentages
12/19/2014 17
CONT. . .
 GRAPHS:
 Graphs Make Data Easier to Understand.
 Below is data without a graph. World wide disease ratio.
12/19/2014 18
ANIMALS. QUANTITY.
HIV/AIDS 65
CERVICAL CANCER. 28
DIABETES MELLITUS. 70
LUNG CANCER. 33
12/19/2014 19
0
10
20
30
40
50
60
70
HIV/AIDS CERVICAL CANCER DIABETES
MELLITUS
LUNG CANCER
LUNG CANCER
DIABETES MELLITUS
CERVICAL CANCER
HIV/AIDS
COLOUMN GRAPH:
BAR GRAPH:
12/19/2014 20
0 10 20 30 40 50 60 70
HIV/AIDS
CERVICAL CANCER
DIABETES MELLITUS
LUNG CANCER
LUNG CANCER
DIABETES MELLITUS
CERVICAL CANCER
HIV/AIDS
LINE GRAPH:
12/19/2014 21
0
10
20
30
40
50
60
70
80
HIV/AIDS CERVICAL CANCER DIABETES MELLITUS LUNG CANCER
LUNG CANCER
DIABETES MELLITUS
CERVICAL CANCER
HIV/AIDS
PIE CHARTS:
 A circular (360 degree) graphic representation
 Compares subclasses or categories to the whole class or
category using differently coloured or patterned segments.
12/19/2014 22
12/19/2014 23
DATA INTERPRETATION:
1. It involves 2 terms:
• ‘Results’ – presentation of data/findings
(statistics).
• ‘Discussion’ – interpretation of data/findings.
2. Things to consider when interpreting your data:
• Interpret findings based on the purpose and
objectives of your study.
• Relate the findings to real life context.
12/19/2014 24
CONT. . .
• Use persuasive language to convince your readers.
• To see the research from your point of view.
• Order your interpretation to highlight the most
important findings.
• Include limitations to your research.
• Use simple, clear language.
12/19/2014 25
12/19/2014 26
12/19/2014 27
12/19/2014 28

Data management and presentation

  • 1.
    DATA MANAGEMENT AND PRESENTATION. PresentedBy: Mian Muhammad Syed Hassan Iqbal. Naveed Iqbal. Yaser Ud-din. Faisal Zahir. Mehboob Ali. Aftab Ahmad. Royal College Of Nursing (SSSS).
  • 2.
    OBJECTIVES:  By theend of presentation the students will be able to:  Define the term data ?? ??  Discuss the types of data and various methods of data collection ?? ??  Discuss the different means and interpretation of data presentation through: Tables ?? ?? Graphs ?? ?? Charts ?? ?? 12/19/2014 2
  • 3.
    “DATA”  Data isa collection of facts, such as values or measurements.  It can Be: o Numbers, words, measurements, observations or even just descriptions of things.  Simply data is information. 12/19/2014 3
  • 4.
    TYPES OF DATA: DATA Numerical. (Quantitative) DISCRETE CONTINOUS Categorically. (Qualitative) 12/19/2014 4
  • 5.
    QUALITATIVE vs. QUANTITATIVE: Data can be qualitative or quantitative. • Qualitative data is descriptive information. (It describes something). • Quantitative data is numerical information. (Numbers). 12/19/2014 5
  • 6.
    CONT. . . 1.Qualitative Data. 2. Quantitative Data 12/19/2014 6  OVERVIEW:  Deals with descriptions.  Data can be observed but measured.  Colors, textures, smells, tastes, Appearance, beauty etc.  Qualitative Quality  OVERVIEW:  Deals with numbers.  Data which can be measured.  Length, height, area, weight, temperature, speed, time, ages, members, etc.  Quantitative. Quantity
  • 7.
    QUANTITATIVE DATA CANALSO BE:  Discrete or Continuous.  Discrete data can only takes certain values. (Like whole numbers).  Continuous data can take any value. (Within a range). a) Discrete data is counted. b) Continuous data is measured. 12/19/2014 7
  • 8.
    EXAMPLE: 12/19/2014 8  Whatdo we know about the tiger?? ?? 1. Qualitative: • He is brown & black. • He has long hairs. • He has lot of energy.
  • 9.
    EXAMPLE: 12/19/2014 9 2) Quantitative: a)Discrete:  He has 4 legs.  He has 2 brothers. b) Continuous:  He weighs 400 pound.  He is 3.5 feet tall.
  • 10.
    ANOTHER TYPES OFDATA : SPATIAL DATA. DEFINITIVE DATA. 12/19/2014 10  Which is normally presented on maps and plans and provides an indication of where things are.  Usually provide in the form of a drawing, which define a particular item and the way in which it has been or is to be build.
  • 11.
    METHODS OF DATACOLLECTION: OBSTRUCTIVE UNOBSTRUCTIVE 12/19/2014 11  Obtrusive data collection methods that directly obtain information from those being evaluated e.g. interviews, surveys, focus groups, observation, case study, questionnaires. Unobtrusive data collection methods that do not collect information directly from evaluees. e.g. : Document analysis, observation at a distance.
  • 12.
    DATA COLLECTION TOOLS: Participatory Methods.  Records and Secondary Data.  Observation.  Surveys and Interviews.  Focus Groups.  Diaries, Journals, Self-reported Checklists. 12/19/2014 12
  • 13.
    CONT. . . Expert Judgment.  Delphi Technique.  Other Tools. -scales (weight). - tape measure. - stop watches. - chemical tests : i.e. quality of water. 12/19/2014 13 - health testing tools: i.e. blood pressure. -citizen report cards.
  • 14.
    DATA PRESENTATIONS: 1. TABLES. 2.GRAPH. 3. CHART. 12/19/2014 14
  • 15.
    DATA PRESENTATIONS:  Tables: ◦Simplest way to summarize data. ◦ Data are presented as absolute numbers or percentages. 12/19/2014 15
  • 16.
     Adults andchildren with HIV/AIDS by region in Country Y, end year X: EXAMPLE: TABLE. Region Adults and adolescents ≥ 15 years Children <15 years Total 1 14 800 200 15 000 2 400 000 20 000 420 000 3 997 000 3 000 1 000 000 4 985 000 15 000 1 000 000 5 1 460 000 40 000 1 500 000 6 465 000 35 000 500 000 7 940 000 10 000 950 000 8 380 000 220 000 600 000 9 900 000 600 000 1 500 000 10 545 000 5 000 550 000 Total 7 086 800 948 200 8 035 000 12/19/2014 16
  • 17.
    CHARTS AND GRAPS: Charts and graphs: ◦ Visual representation of data. ◦ Data are presented as absolute numbers or percentages 12/19/2014 17
  • 18.
    CONT. . . GRAPHS:  Graphs Make Data Easier to Understand.  Below is data without a graph. World wide disease ratio. 12/19/2014 18 ANIMALS. QUANTITY. HIV/AIDS 65 CERVICAL CANCER. 28 DIABETES MELLITUS. 70 LUNG CANCER. 33
  • 19.
    12/19/2014 19 0 10 20 30 40 50 60 70 HIV/AIDS CERVICALCANCER DIABETES MELLITUS LUNG CANCER LUNG CANCER DIABETES MELLITUS CERVICAL CANCER HIV/AIDS COLOUMN GRAPH:
  • 20.
    BAR GRAPH: 12/19/2014 20 010 20 30 40 50 60 70 HIV/AIDS CERVICAL CANCER DIABETES MELLITUS LUNG CANCER LUNG CANCER DIABETES MELLITUS CERVICAL CANCER HIV/AIDS
  • 21.
    LINE GRAPH: 12/19/2014 21 0 10 20 30 40 50 60 70 80 HIV/AIDSCERVICAL CANCER DIABETES MELLITUS LUNG CANCER LUNG CANCER DIABETES MELLITUS CERVICAL CANCER HIV/AIDS
  • 22.
    PIE CHARTS:  Acircular (360 degree) graphic representation  Compares subclasses or categories to the whole class or category using differently coloured or patterned segments. 12/19/2014 22
  • 23.
  • 24.
    DATA INTERPRETATION: 1. Itinvolves 2 terms: • ‘Results’ – presentation of data/findings (statistics). • ‘Discussion’ – interpretation of data/findings. 2. Things to consider when interpreting your data: • Interpret findings based on the purpose and objectives of your study. • Relate the findings to real life context. 12/19/2014 24
  • 25.
    CONT. . . •Use persuasive language to convince your readers. • To see the research from your point of view. • Order your interpretation to highlight the most important findings. • Include limitations to your research. • Use simple, clear language. 12/19/2014 25
  • 26.
  • 27.
  • 28.