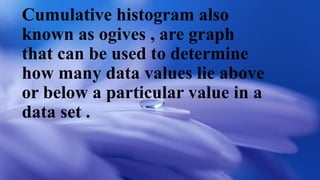
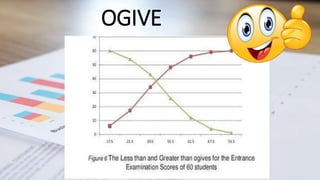
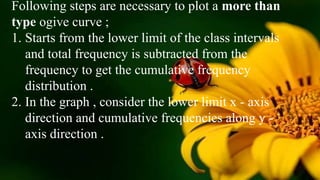
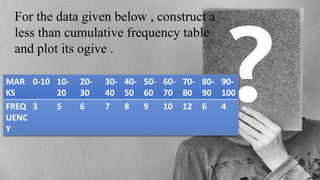
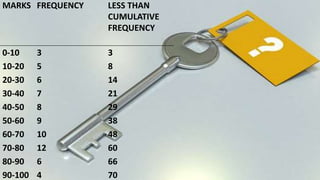
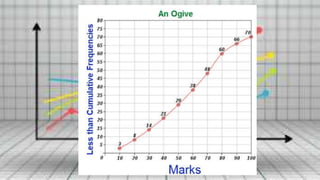
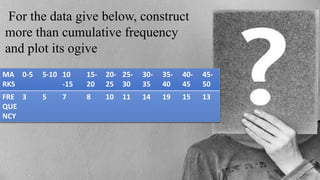
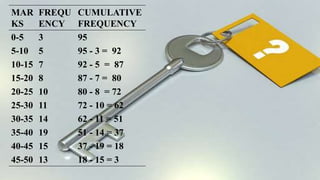
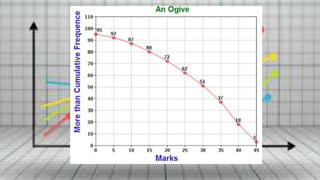
SlideShare a Scribd company logo
1 of 29
OGIVES
Cumulative histogram also
known as ogives , are graph
that can be used to determine
how many data values lie above
or below a particular value in a
data set .
OGIVE
How to plot an ogive curve?
Following steps are necessary to plot
less than type ogive curve.
1. Start from the upper limit of the
class intervals and then add class
frequency to the cumulative
frequency distribution.
2. Take upper in the x-axis direction
cumulative frequencies along the y-
axis direction.
3.Plot the points ( x,y ) , where is
the upper limit of the class and y
is the corresponding cumulative
frequency.
4.Join the points by a smooth
curve.
Following steps are necessary to plot a more than
type ogive curve ;
1. Starts from the lower limit of the class intervals
and total frequency is subtracted from the
frequency to get the cumulative frequency
distribution .
2. In the graph , consider the lower limit x - axis
direction and cumulative frequencies along y -
axis direction .
3. Plot the points x, y, where is the upper
limit of the class and y is the
corresponding cumulative frequency.
4. Joins the points by a smooth curve.
Ogive can
•Visually approximate.
•Summarize a large data set in
visual form.
Delineate each interval in the
frequency distribution.
Clarify rates of change between
classes better than other graph.
Provide visual check of
accuracy or reasonableness
of calculations.
•Be easily understood due to
widespread use in business and
media.
•Show the number of proportion
or of data point above / below
a particular value.
•Become more smooth as data
points or classes added.
Ogive can:
•Fail to reflect all data points in a data set.
•Be somewhat complicated to prepare.
•Reveal little about central
tendency, dispersion , skew
or kurtosis.
• Often requires additional written or written or
verbal explanation.
•Be inadequate to describe to attribute,
behaviour, or condition of
interest.
•Fail to reveal key assumptions.
For the data given below , construct a
less than cumulative frequency table
and plot its ogive .
MAR
KS
0-10 10-
20
20-
30
30-
40
40-
50
50-
60
60-
70
70-
80
80-
90
90-
100
FREQ
UENC
Y
3 5 6 7 8 9 10 12 6 4
MARKS FREQUENCY LESS THAN
CUMULATIVE
FREQUENCY
0-10 3 3
10-20 5 8
20-30 6 14
30-40 7 21
40-50 8 29
50-60 9 38
60-70 10 48
70-80 12 60
80-90 6 66
90-100 4 70
MA
RKS
0-5 5-10 10
-15
15-
20
20-
25
25-
30
30-
35
35-
40
40-
45
45-
50
FRE
QUE
NCY
3 5 7 8 10 11 14 19 15 13
For the data give below, construct
more than cumulative frequency
and plot its ogive
MAR
KS
FREQU
ENCY
CUMULATIVE
FREQUENCY
0-5 3 95
5-10 5 95 - 3 = 92
10-15 7 92 - 5 = 87
15-20 8 87 - 7 = 80
20-25 10 80 - 8 = 72
25-30 11 72 - 10 = 62
30-35 14 62 - 11 = 51
35-40 19 51 - 14 = 37
40-45 15 37 - 19 = 18
45-50 13 18 - 15 = 3
https://www.statisticshowto.data
sciencecentral.com/ogive-graph
/https://www.statisticshowto.dat
asciencecentral.com/ogive-graph/
http://www.mathcaptain.com/sta
tistics/ogive.html
www.preciousheart.net/chaplain
cy/Auditor_Manual/11grphd.pdf
Ogives slides

More Related Content

What's hot

Measure OF Central Tendency
Measure OF Central TendencyMeasure OF Central Tendency
Measure OF Central TendencyIqrabutt038
 
Chapter 8 (procedure of data collection)
Chapter 8 (procedure of data collection)Chapter 8 (procedure of data collection)
Chapter 8 (procedure of data collection)BoreyThai1
 
Mean Mode & Median
Mean Mode & MedianMean Mode & Median
Mean Mode & MedianHome
 
Measure of Central Tendency (Mean, Median, Mode and Quantiles)
Measure of Central Tendency (Mean, Median, Mode and Quantiles)Measure of Central Tendency (Mean, Median, Mode and Quantiles)
Measure of Central Tendency (Mean, Median, Mode and Quantiles)Salman Khan
 
#2 Classification and tabulation of data
#2 Classification and tabulation of data#2 Classification and tabulation of data
#2 Classification and tabulation of dataKawita Bhatt
 
Mba2216 week 07 08 measurement and data collection forms
Mba2216 week 07 08 measurement and data collection formsMba2216 week 07 08 measurement and data collection forms
Mba2216 week 07 08 measurement and data collection formsStephen Ong
 
Frequency Distribution
Frequency DistributionFrequency Distribution
Frequency DistributionTeacherMariza
 
Statistics in research
Statistics in researchStatistics in research
Statistics in researchBalaji P
 
Spss lecture notes
Spss lecture notesSpss lecture notes
Spss lecture notesDavid mbwiga
 
Data presentation/ How to present Research outcome data
Data presentation/ How to present Research outcome dataData presentation/ How to present Research outcome data
Data presentation/ How to present Research outcome dataDr-Jitendra Patel
 
Ogives wps office [autosaved]
Ogives wps office [autosaved]Ogives wps office [autosaved]
Ogives wps office [autosaved]SreejayaPV
 

What's hot (20)

Diagrams
DiagramsDiagrams
Diagrams
 
Median & mode
Median & modeMedian & mode
Median & mode
 
Measure OF Central Tendency
Measure OF Central TendencyMeasure OF Central Tendency
Measure OF Central Tendency
 
Chapter 8 (procedure of data collection)
Chapter 8 (procedure of data collection)Chapter 8 (procedure of data collection)
Chapter 8 (procedure of data collection)
 
Standard deviation
Standard deviationStandard deviation
Standard deviation
 
Mean Mode & Median
Mean Mode & MedianMean Mode & Median
Mean Mode & Median
 
Measure of Central Tendency (Mean, Median, Mode and Quantiles)
Measure of Central Tendency (Mean, Median, Mode and Quantiles)Measure of Central Tendency (Mean, Median, Mode and Quantiles)
Measure of Central Tendency (Mean, Median, Mode and Quantiles)
 
Measure of Central Tendency
Measure of Central TendencyMeasure of Central Tendency
Measure of Central Tendency
 
Central tendency and Measure of Dispersion
Central tendency and Measure of DispersionCentral tendency and Measure of Dispersion
Central tendency and Measure of Dispersion
 
Chapter 2
Chapter 2Chapter 2
Chapter 2
 
#2 Classification and tabulation of data
#2 Classification and tabulation of data#2 Classification and tabulation of data
#2 Classification and tabulation of data
 
Measurement & Scaling
Measurement & ScalingMeasurement & Scaling
Measurement & Scaling
 
Mba2216 week 07 08 measurement and data collection forms
Mba2216 week 07 08 measurement and data collection formsMba2216 week 07 08 measurement and data collection forms
Mba2216 week 07 08 measurement and data collection forms
 
Frequency Distribution
Frequency DistributionFrequency Distribution
Frequency Distribution
 
Measure of central tendency
Measure of central tendencyMeasure of central tendency
Measure of central tendency
 
Standard error
Standard error Standard error
Standard error
 
Statistics in research
Statistics in researchStatistics in research
Statistics in research
 
Spss lecture notes
Spss lecture notesSpss lecture notes
Spss lecture notes
 
Data presentation/ How to present Research outcome data
Data presentation/ How to present Research outcome dataData presentation/ How to present Research outcome data
Data presentation/ How to present Research outcome data
 
Ogives wps office [autosaved]
Ogives wps office [autosaved]Ogives wps office [autosaved]
Ogives wps office [autosaved]
 

Similar to Ogives slides

Ogive slide share
Ogive slide shareOgive slide share
Ogive slide shareSreejayaPV
 
Ogives wps office [autosaved]
Ogives wps office [autosaved]Ogives wps office [autosaved]
Ogives wps office [autosaved]SreejayaPV
 
Types of graphs
Types of graphsTypes of graphs
Types of graphsLALIT BIST
 
Summarizing Data : Listing and Grouping pdf
Summarizing Data : Listing and Grouping pdfSummarizing Data : Listing and Grouping pdf
Summarizing Data : Listing and Grouping pdfJustynOwen
 
1) Chapter#02 Presentation of Data.ppt
1) Chapter#02 Presentation of Data.ppt1) Chapter#02 Presentation of Data.ppt
1) Chapter#02 Presentation of Data.pptMuntazirMehdi43
 
Presentation1.pptx
Presentation1.pptxPresentation1.pptx
Presentation1.pptxMANJUNATHMP7
 
maft0a2_Statistics_lecture2_2021.pptx
maft0a2_Statistics_lecture2_2021.pptxmaft0a2_Statistics_lecture2_2021.pptx
maft0a2_Statistics_lecture2_2021.pptxTshegofatso Mphake
 
Chapter 02 mis
Chapter 02 misChapter 02 mis
Chapter 02 misRong Mohol
 
Cumulative frequency distribution
Cumulative frequency distributionCumulative frequency distribution
Cumulative frequency distributionMahrukhShehzadi1
 
lesson-data-presentation-tools-1.pptx
lesson-data-presentation-tools-1.pptxlesson-data-presentation-tools-1.pptx
lesson-data-presentation-tools-1.pptxAnalynPasto
 
Data Presentation using Descriptive Graphs.pptx
Data Presentation using Descriptive Graphs.pptxData Presentation using Descriptive Graphs.pptx
Data Presentation using Descriptive Graphs.pptxJeanettebagtoc
 
2. AAdata presentation edited edited tutor srudents(1).pptx
2. AAdata presentation edited edited tutor srudents(1).pptx2. AAdata presentation edited edited tutor srudents(1).pptx
2. AAdata presentation edited edited tutor srudents(1).pptxssuser504dda
 
Ejercicio resuelto-de-estadc3adstica-descriptiva1
Ejercicio resuelto-de-estadc3adstica-descriptiva1Ejercicio resuelto-de-estadc3adstica-descriptiva1
Ejercicio resuelto-de-estadc3adstica-descriptiva1Sandra Hernández Cely
 
Classification Systems
Classification SystemsClassification Systems
Classification SystemsJohn Reiser
 
Graphical presentation STATISTICS
Graphical presentation STATISTICSGraphical presentation STATISTICS
Graphical presentation STATISTICSGhanendra Sharma
 
Statistics slides..pptx
Statistics slides..pptxStatistics slides..pptx
Statistics slides..pptxSmnRaja2
 

Similar to Ogives slides (20)

Ogive slide share
Ogive slide shareOgive slide share
Ogive slide share
 
Ogives wps office [autosaved]
Ogives wps office [autosaved]Ogives wps office [autosaved]
Ogives wps office [autosaved]
 
More than ogive
More than ogiveMore than ogive
More than ogive
 
More than ogive Curves
More than ogive CurvesMore than ogive Curves
More than ogive Curves
 
Types of graphs
Types of graphsTypes of graphs
Types of graphs
 
Summarizing Data : Listing and Grouping pdf
Summarizing Data : Listing and Grouping pdfSummarizing Data : Listing and Grouping pdf
Summarizing Data : Listing and Grouping pdf
 
1) Chapter#02 Presentation of Data.ppt
1) Chapter#02 Presentation of Data.ppt1) Chapter#02 Presentation of Data.ppt
1) Chapter#02 Presentation of Data.ppt
 
Presentation1.pptx
Presentation1.pptxPresentation1.pptx
Presentation1.pptx
 
maft0a2_Statistics_lecture2_2021.pptx
maft0a2_Statistics_lecture2_2021.pptxmaft0a2_Statistics_lecture2_2021.pptx
maft0a2_Statistics_lecture2_2021.pptx
 
Statistics
StatisticsStatistics
Statistics
 
Chapter 02 mis
Chapter 02 misChapter 02 mis
Chapter 02 mis
 
Cumulative frequency distribution
Cumulative frequency distributionCumulative frequency distribution
Cumulative frequency distribution
 
lesson-data-presentation-tools-1.pptx
lesson-data-presentation-tools-1.pptxlesson-data-presentation-tools-1.pptx
lesson-data-presentation-tools-1.pptx
 
Data Presentation using Descriptive Graphs.pptx
Data Presentation using Descriptive Graphs.pptxData Presentation using Descriptive Graphs.pptx
Data Presentation using Descriptive Graphs.pptx
 
2. AAdata presentation edited edited tutor srudents(1).pptx
2. AAdata presentation edited edited tutor srudents(1).pptx2. AAdata presentation edited edited tutor srudents(1).pptx
2. AAdata presentation edited edited tutor srudents(1).pptx
 
Ejercicio resuelto-de-estadc3adstica-descriptiva1
Ejercicio resuelto-de-estadc3adstica-descriptiva1Ejercicio resuelto-de-estadc3adstica-descriptiva1
Ejercicio resuelto-de-estadc3adstica-descriptiva1
 
Classification Systems
Classification SystemsClassification Systems
Classification Systems
 
Graphical presentation STATISTICS
Graphical presentation STATISTICSGraphical presentation STATISTICS
Graphical presentation STATISTICS
 
Statistics slides..pptx
Statistics slides..pptxStatistics slides..pptx
Statistics slides..pptx
 
Statistics
StatisticsStatistics
Statistics
 

Recently uploaded

Software Engineering Methodologies (overview)
Software Engineering Methodologies (overview)Software Engineering Methodologies (overview)
Software Engineering Methodologies (overview)eniolaolutunde
 
IGNOU MSCCFT and PGDCFT Exam Question Pattern: MCFT003 Counselling and Family...
IGNOU MSCCFT and PGDCFT Exam Question Pattern: MCFT003 Counselling and Family...IGNOU MSCCFT and PGDCFT Exam Question Pattern: MCFT003 Counselling and Family...
IGNOU MSCCFT and PGDCFT Exam Question Pattern: MCFT003 Counselling and Family...PsychoTech Services
 
fourth grading exam for kindergarten in writing
fourth grading exam for kindergarten in writingfourth grading exam for kindergarten in writing
fourth grading exam for kindergarten in writingTeacherCyreneCayanan
 
Grant Readiness 101 TechSoup and Remy Consulting
Grant Readiness 101 TechSoup and Remy ConsultingGrant Readiness 101 TechSoup and Remy Consulting
Grant Readiness 101 TechSoup and Remy ConsultingTechSoup
 
The basics of sentences session 2pptx copy.pptx
The basics of sentences session 2pptx copy.pptxThe basics of sentences session 2pptx copy.pptx
The basics of sentences session 2pptx copy.pptxheathfieldcps1
 
Nutritional Needs Presentation - HLTH 104
Nutritional Needs Presentation - HLTH 104Nutritional Needs Presentation - HLTH 104
Nutritional Needs Presentation - HLTH 104misteraugie
 
Paris 2024 Olympic Geographies - an activity
Paris 2024 Olympic Geographies - an activityParis 2024 Olympic Geographies - an activity
Paris 2024 Olympic Geographies - an activityGeoBlogs
 
1029-Danh muc Sach Giao Khoa khoi 6.pdf
1029-Danh muc Sach Giao Khoa khoi  6.pdf1029-Danh muc Sach Giao Khoa khoi  6.pdf
1029-Danh muc Sach Giao Khoa khoi 6.pdfQucHHunhnh
 
Introduction to Nonprofit Accounting: The Basics
Introduction to Nonprofit Accounting: The BasicsIntroduction to Nonprofit Accounting: The Basics
Introduction to Nonprofit Accounting: The BasicsTechSoup
 
Student login on Anyboli platform.helpin
Student login on Anyboli platform.helpinStudent login on Anyboli platform.helpin
Student login on Anyboli platform.helpinRaunakKeshri1
 
Disha NEET Physics Guide for classes 11 and 12.pdf
Disha NEET Physics Guide for classes 11 and 12.pdfDisha NEET Physics Guide for classes 11 and 12.pdf
Disha NEET Physics Guide for classes 11 and 12.pdfchloefrazer622
 
Russian Escort Service in Delhi 11k Hotel Foreigner Russian Call Girls in Delhi
Russian Escort Service in Delhi 11k Hotel Foreigner Russian Call Girls in DelhiRussian Escort Service in Delhi 11k Hotel Foreigner Russian Call Girls in Delhi
Russian Escort Service in Delhi 11k Hotel Foreigner Russian Call Girls in Delhikauryashika82
 
SOCIAL AND HISTORICAL CONTEXT - LFTVD.pptx
SOCIAL AND HISTORICAL CONTEXT - LFTVD.pptxSOCIAL AND HISTORICAL CONTEXT - LFTVD.pptx
SOCIAL AND HISTORICAL CONTEXT - LFTVD.pptxiammrhaywood
 
Measures of Central Tendency: Mean, Median and Mode
Measures of Central Tendency: Mean, Median and ModeMeasures of Central Tendency: Mean, Median and Mode
Measures of Central Tendency: Mean, Median and ModeThiyagu K
 
Ecosystem Interactions Class Discussion Presentation in Blue Green Lined Styl...
Ecosystem Interactions Class Discussion Presentation in Blue Green Lined Styl...Ecosystem Interactions Class Discussion Presentation in Blue Green Lined Styl...
Ecosystem Interactions Class Discussion Presentation in Blue Green Lined Styl...fonyou31
 
Advanced Views - Calendar View in Odoo 17
Advanced Views - Calendar View in Odoo 17Advanced Views - Calendar View in Odoo 17
Advanced Views - Calendar View in Odoo 17Celine George
 
Web & Social Media Analytics Previous Year Question Paper.pdf
Web & Social Media Analytics Previous Year Question Paper.pdfWeb & Social Media Analytics Previous Year Question Paper.pdf
Web & Social Media Analytics Previous Year Question Paper.pdfJayanti Pande
 
Key note speaker Neum_Admir Softic_ENG.pdf
Key note speaker Neum_Admir Softic_ENG.pdfKey note speaker Neum_Admir Softic_ENG.pdf
Key note speaker Neum_Admir Softic_ENG.pdfAdmir Softic
 

Recently uploaded (20)

Software Engineering Methodologies (overview)
Software Engineering Methodologies (overview)Software Engineering Methodologies (overview)
Software Engineering Methodologies (overview)
 
Advance Mobile Application Development class 07
Advance Mobile Application Development class 07Advance Mobile Application Development class 07
Advance Mobile Application Development class 07
 
IGNOU MSCCFT and PGDCFT Exam Question Pattern: MCFT003 Counselling and Family...
IGNOU MSCCFT and PGDCFT Exam Question Pattern: MCFT003 Counselling and Family...IGNOU MSCCFT and PGDCFT Exam Question Pattern: MCFT003 Counselling and Family...
IGNOU MSCCFT and PGDCFT Exam Question Pattern: MCFT003 Counselling and Family...
 
fourth grading exam for kindergarten in writing
fourth grading exam for kindergarten in writingfourth grading exam for kindergarten in writing
fourth grading exam for kindergarten in writing
 
Grant Readiness 101 TechSoup and Remy Consulting
Grant Readiness 101 TechSoup and Remy ConsultingGrant Readiness 101 TechSoup and Remy Consulting
Grant Readiness 101 TechSoup and Remy Consulting
 
The basics of sentences session 2pptx copy.pptx
The basics of sentences session 2pptx copy.pptxThe basics of sentences session 2pptx copy.pptx
The basics of sentences session 2pptx copy.pptx
 
Nutritional Needs Presentation - HLTH 104
Nutritional Needs Presentation - HLTH 104Nutritional Needs Presentation - HLTH 104
Nutritional Needs Presentation - HLTH 104
 
Paris 2024 Olympic Geographies - an activity
Paris 2024 Olympic Geographies - an activityParis 2024 Olympic Geographies - an activity
Paris 2024 Olympic Geographies - an activity
 
Mattingly "AI & Prompt Design: The Basics of Prompt Design"
Mattingly "AI & Prompt Design: The Basics of Prompt Design"Mattingly "AI & Prompt Design: The Basics of Prompt Design"
Mattingly "AI & Prompt Design: The Basics of Prompt Design"
 
1029-Danh muc Sach Giao Khoa khoi 6.pdf
1029-Danh muc Sach Giao Khoa khoi  6.pdf1029-Danh muc Sach Giao Khoa khoi  6.pdf
1029-Danh muc Sach Giao Khoa khoi 6.pdf
 
Introduction to Nonprofit Accounting: The Basics
Introduction to Nonprofit Accounting: The BasicsIntroduction to Nonprofit Accounting: The Basics
Introduction to Nonprofit Accounting: The Basics
 
Student login on Anyboli platform.helpin
Student login on Anyboli platform.helpinStudent login on Anyboli platform.helpin
Student login on Anyboli platform.helpin
 
Disha NEET Physics Guide for classes 11 and 12.pdf
Disha NEET Physics Guide for classes 11 and 12.pdfDisha NEET Physics Guide for classes 11 and 12.pdf
Disha NEET Physics Guide for classes 11 and 12.pdf
 
Russian Escort Service in Delhi 11k Hotel Foreigner Russian Call Girls in Delhi
Russian Escort Service in Delhi 11k Hotel Foreigner Russian Call Girls in DelhiRussian Escort Service in Delhi 11k Hotel Foreigner Russian Call Girls in Delhi
Russian Escort Service in Delhi 11k Hotel Foreigner Russian Call Girls in Delhi
 
SOCIAL AND HISTORICAL CONTEXT - LFTVD.pptx
SOCIAL AND HISTORICAL CONTEXT - LFTVD.pptxSOCIAL AND HISTORICAL CONTEXT - LFTVD.pptx
SOCIAL AND HISTORICAL CONTEXT - LFTVD.pptx
 
Measures of Central Tendency: Mean, Median and Mode
Measures of Central Tendency: Mean, Median and ModeMeasures of Central Tendency: Mean, Median and Mode
Measures of Central Tendency: Mean, Median and Mode
 
Ecosystem Interactions Class Discussion Presentation in Blue Green Lined Styl...
Ecosystem Interactions Class Discussion Presentation in Blue Green Lined Styl...Ecosystem Interactions Class Discussion Presentation in Blue Green Lined Styl...
Ecosystem Interactions Class Discussion Presentation in Blue Green Lined Styl...
 
Advanced Views - Calendar View in Odoo 17
Advanced Views - Calendar View in Odoo 17Advanced Views - Calendar View in Odoo 17
Advanced Views - Calendar View in Odoo 17
 
Web & Social Media Analytics Previous Year Question Paper.pdf
Web & Social Media Analytics Previous Year Question Paper.pdfWeb & Social Media Analytics Previous Year Question Paper.pdf
Web & Social Media Analytics Previous Year Question Paper.pdf
 
Key note speaker Neum_Admir Softic_ENG.pdf
Key note speaker Neum_Admir Softic_ENG.pdfKey note speaker Neum_Admir Softic_ENG.pdf
Key note speaker Neum_Admir Softic_ENG.pdf
 

Ogives slides

Editor's Notes

  1. To plot an ogive we need class boundaries and the cumulative frequencies. For grouped data ,ogive is formed by plotting the cumulative frequency against the upper boundary of the class. For ungrouped data cumulative frequency is plotted on the y-axis against the data which is on the x- axis.
  2. An ogive is a line graph where the bases are the class boundaries and the heights are the <cf for the less than ogive and >cf for the greater than ogive.