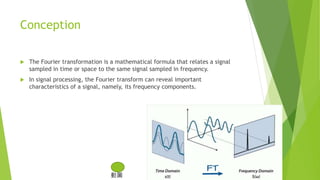
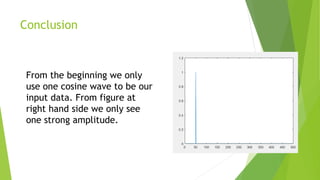
The document discusses the Fourier transform, which relates a signal sampled in time or space to the same signal sampled in frequency. It explains the mathematical definition and provides an example of using a Fourier transform to convert time domain data to the frequency domain. Specifically, it uses a cosine wave as input data and calculates the Fourier transform to reveal a strong amplitude at the expected frequency component.


![Mathematical definition
𝑓(𝑘 + 1) = 𝑗=0
𝑛−1
𝑔 𝑗 + 1 ∗ 𝑒−2𝜋𝑖∗𝑡[𝑗]∗𝑘
,
𝑠. 𝑡. 0 ≤ j, k ≤ n − 1
Length of signal: n
Time vector: t
Sampling frequency: k
Number of time point: j
𝜔 = 𝑒−2𝜋𝑖𝑡](https://image.slidesharecdn.com/fouriertransforms-190307065003/85/Fourier-transforms-5-320.jpg)
![Example
𝑔 𝑗 = cos 2𝜋 ∗ 50 ∗ 𝑡[𝑗] + 1.2, this is our time domain data.
Length of signal j = 1000, t[0] = 0,t[1] = 0.001, …, t[999] = 0.999
Our propose is using Fourier transformation to transforms data
from time domain to frequency.](https://image.slidesharecdn.com/fouriertransforms-190307065003/85/Fourier-transforms-6-320.jpg)

![ Third step: time 𝑒 𝑘 with our equation →
𝑔 𝑗 + 1 ∗ 𝑒−2𝜋𝑖∗𝑡∗𝑘
, 0 ≤ k ≤ n − 1
Reason: So far there is still nothing about frequency and how to change time
domain to frequency domain, so we time 𝑒 𝑘
with our equation, to import frequency
k into our equation
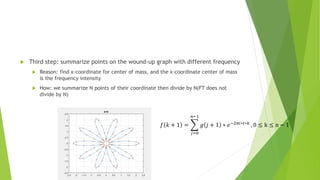
How: we summarize N points of their coordinate then divide by N(FT does not
divide by N) t[j]=5
f 𝑘 + 1 =
𝑗=0
𝑛−1
𝑔 𝑗 + 1 ∗ 𝑒−2𝜋𝑖∗𝑡[𝑗]∗𝑘
, 0 ≤ k, j ≤ n − 1](https://image.slidesharecdn.com/fouriertransforms-190307065003/85/Fourier-transforms-9-320.jpg)
![So our equation can be separate into
But also we know0 ≤ k ≤ n − 1, so the equation can do more separate into
𝑔 1 ∗ 𝑒−2𝜋𝑖∗𝑡[0]∗0
+ 𝑔 1 ∗ 𝑒−2𝜋𝑖∗𝑡 0 ∗1
+ 𝑔 1 ∗ 𝑒−2𝜋𝑖∗𝑡[0]∗2
+ … + 𝑔 1 ∗ 𝑒−2𝜋𝑖∗𝑡[0]∗(𝑛−1)
𝑔 2 ∗ 𝑒−2𝜋𝑖∗𝑡 1 ∗0 + 𝑔 2 ∗ 𝑒−2𝜋𝑖∗𝑡 1 ∗1 + 𝑔 2 ∗ 𝑒−2𝜋𝑖∗𝑡[1]∗2 + … + 𝑔 2 ∗ 𝑒−2𝜋𝑖∗𝑡[1]∗(𝑛−1)
.
.
.
𝑔 𝑛 ∗ 𝑒−2𝜋𝑖∗𝑡 𝑛−1 ∗0
+ 𝑔 𝑛 ∗ 𝑒−2𝜋𝑖∗𝑡 𝑛−1 ∗1
+ 𝑔 𝑛 ∗ 𝑒−2𝜋𝑖∗𝑡[𝑛−1]∗2
+ … + 𝑔 𝑛 ∗ 𝑒−2𝜋𝑖∗𝑡[𝑛−1]∗(𝑛−1)
𝑗=0
𝑛−1
𝑔 𝑗 + 1 ∗ 𝑒−2𝜋𝑖∗𝑡[𝑗]∗𝑘
= 𝑔 1 ∗ 𝑒−2𝜋𝑖∗𝑡 0 ∗𝑘
+
𝑔 2 ∗ 𝑒−2𝜋𝑖∗𝑡 1 ∗𝑘
+
.
.
.
𝑔 𝑛 ∗ 𝑒−2𝜋𝑖∗𝑡 𝑛−1 ∗𝑘
Time
domain
Frequency
domain](https://image.slidesharecdn.com/fouriertransforms-190307065003/85/Fourier-transforms-10-320.jpg)

![Changing variable k will find out our figure changed base on
frequency.
𝑔 𝑗 + 1 ∗ 𝑒−2𝜋𝑖∗𝑡[𝑗]∗𝑘
k = 1, 5, 10, 20, 30, 40, 50
K=1 K=5 K=10 K=20 K=30 K=40 K=50
x-
coordinate
center of
mass
5.77E-17 6.39E-17 -9.81E-17 -9.81E-17 -9.37E-17 1.72E-16 0.5](https://image.slidesharecdn.com/fouriertransforms-190307065003/85/Fourier-transforms-13-320.jpg)


![Lect 1 Number systems and base conversions. [Autosaved].pptx](https://cdn.slidesharecdn.com/ss_thumbnails/lect1numbersystemsandbaseconversions-260111134109-67c2d865-thumbnail.jpg?width=640&height=640&fit=bounds)


