Downloaded 611 times


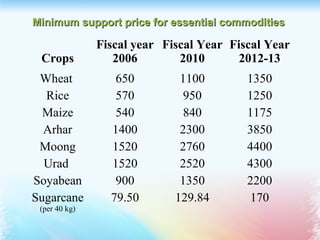

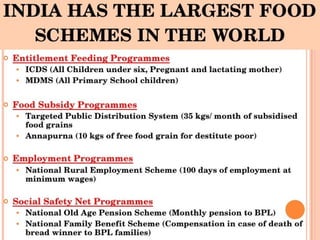
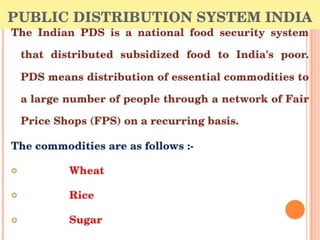


The document presents a detailed analysis of food security in India, highlighting the country's agricultural strengths and challenges, particularly addressing issues like hunger and malnutrition. It reviews the National Food Security Mission aimed at enhancing the production of essential food grains and discusses the Food Security Bill of 2013, which seeks to ensure access to adequate food for citizens. Key points include statistics on food production, current hunger challenges, and the proposed entitlements for food distribution under the bill.


